EX-99.1
Published on June 8, 2005
Searchable text section of graphics shown above
Safe Harbor Provision
During the course of this presentation, we will make projections or other forward-looking statements regarding future events or the future financial performance of the Company. We wish to caution you that such statements reflect only our current expectations, and that actual events or results may differ materially.
We refer you to the risk factors and cautionary language contained in the documents that the Company files from time to time with the Securities and Exchange Commission, specifically the Companys most recent S-3 Registration Statement and Form 10-K. Such documents contain and identify important factors that could cause the actual results to differ materially from those contained in our projections or forward-looking statements. We undertake no obligation to update such projections or such forward-looking statements in the future.
2
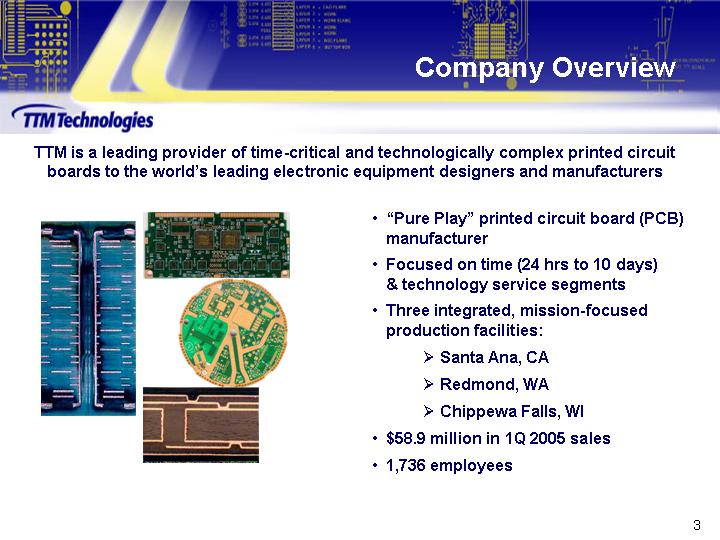
Company Overview
TTM is a leading provider of time-critical and technologically complex printed circuit boards to the worlds leading electronic equipment designers and manufacturers
[GRAPHIC]
Pure Play printed circuit board (PCB) manufacturer
Focused on time (24 hrs to 10 days) & technology service segments
Three integrated, mission-focused production facilities:
Santa Ana, CA
Redmond, WA
Chippewa Falls, WI
$58.9 million in 1Q 2005 sales
1,736 employees
3
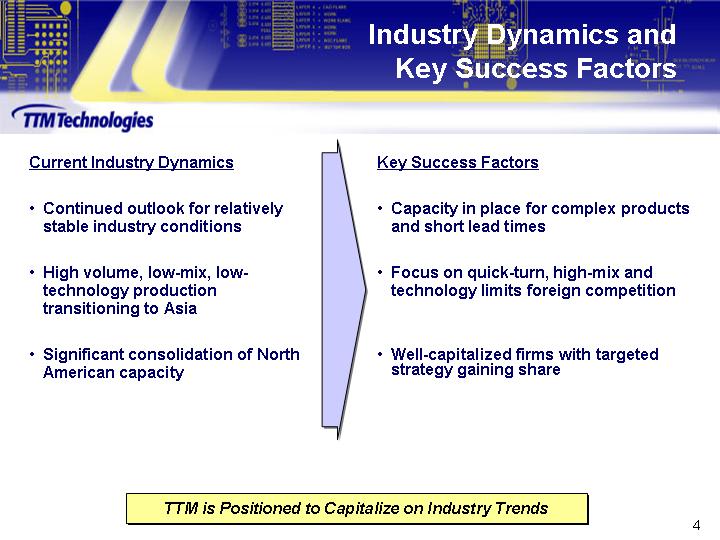
Industry Dynamics and Key Success Factors
|
Current Industry Dynamics |
|
Key Success Factors |
|
|
|
|
|
Continued outlook for relatively stable industry conditions |
|
Capacity in place for complex products and short lead times |
|
|
|
|
|
High volume, low-mix, low-technology production transitioning to Asia |
|
Focus on quick-turn, high-mix and technology limits foreign competition |
|
|
|
|
|
Significant consolidation of North American capacity |
|
Well-capitalized firms with targeted strategy gaining share |
TTM is Positioned to Capitalize on Industry Trends
4
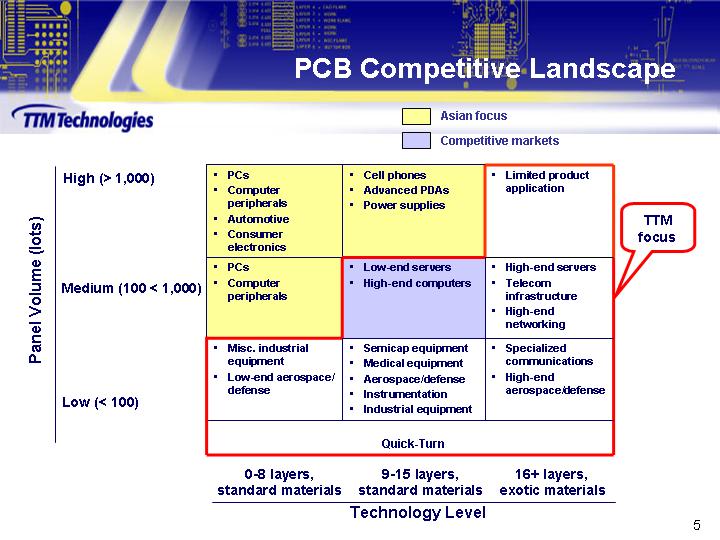
PCB Competitive Landscape
|
|
|
High (> 1,000) |
|
PCs Computer peripherals Automotive Consumer electronics |
|
Cell phones Advanced PDAs Power supplies |
|
Limited product application |
|
|
|
|
|
|
|
|
|
|
|
|
|
|
|
Panel Volume (lots) |
|
Medium (100 < 1,000) |
|
PCs Computer peripherals |
|
Low-end servers High-end computers |
|
High-end servers Telecom infrastructure High-end networking |
|
TTM |
|
|
|
|
|
|
|
|
|
|
|
|
|
|
|
Low (< 100) |
|
Misc. industrial equipment Low-end aerospace/defense |
|
Semicap equipment Medical equipment Aerospace/defense Instrumentation Industrial equipment |
|
Specialized communications High-end aerospace/defense |
|
|
|
|
|
|
|
|
|
|
|
|
|
|
|
|
|
|
|
|
|
Quick-Turn |
|
|
|
|
|
|
|
|
|
|
|
|
|
|
|
|
|
|
|
|
|
0-8 layers, |
|
9-15 layers, |
|
16+ layers, |
|
|
|
|
|
|
|
standard materials |
|
standard materials |
|
exotic materials |
|
|
|
|
|
|
|
|
|
|
|
|
|
|
|
|
|
|
|
|
|
Technology Level |
|
|
|
|
5
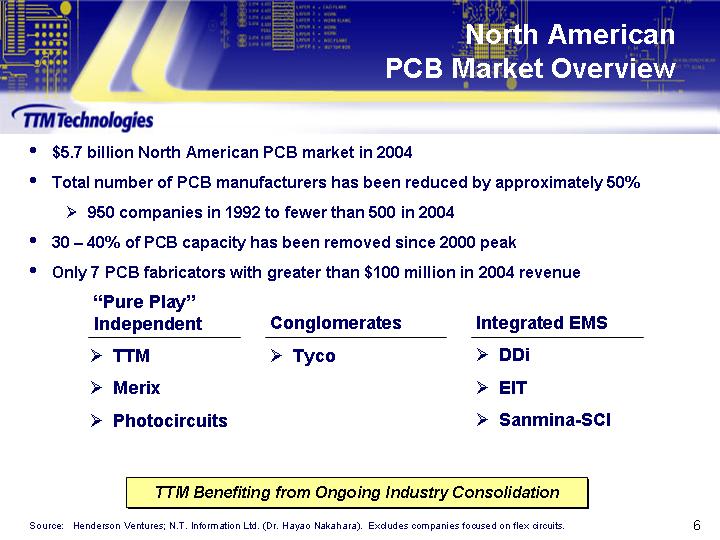
North American PCB Market Overview
$5.7 billion North American PCB market in 2004
Total number of PCB manufacturers has been reduced by approximately 50%
950 companies in 1992 to fewer than 500 in 2004
30 40% of PCB capacity has been removed since 2000 peak
Only 7 PCB fabricators with greater than $100 million in 2004 revenue
|
Pure Play |
|
Conglomerates |
|
Integrated EMS |
|
|
TTM |
|
Tyco |
|
DDi |
|
|
Merix |
|
|
|
EIT |
|
|
Photocircuits |
|
|
|
Sanmina-SCI |
|
TTM Benefiting from Ongoing Industry Consolidation
Source: Henderson Ventures; N.T. Information Ltd. (Dr. Hayao Nakahara). Excludes companies focused on flex circuits.
6
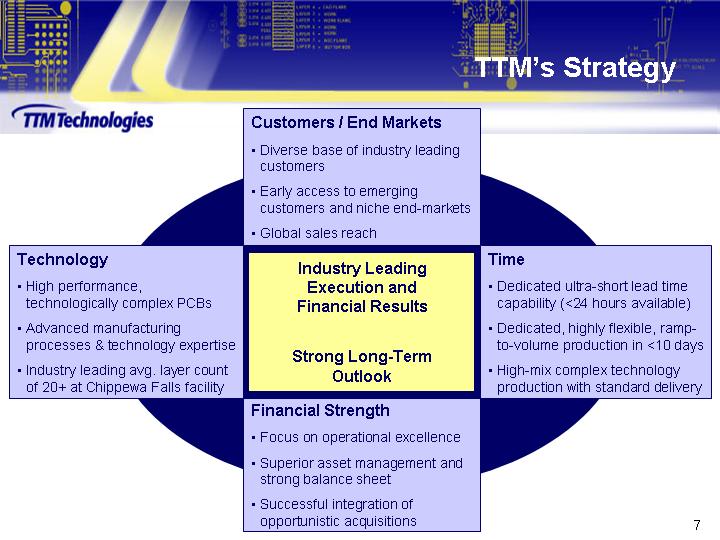
TTMs Strategy
Industry Leading Execution and Financial Results
Strong Long-Term Outlook
Technology
High performance, technologically complex PCBs
Advanced manufacturing processes & technology expertise
Industry leading avg. layer count of 20+ at Chippewa Falls facility
Customers / End Markets
Diverse base of industry leading customers
Early access to emerging customers and niche end-markets
Global sales reach
Time
Dedicated ultra-short lead time capability (<24 hours available)
Dedicated, highly flexible, ramp-to-volume production in <10 days
High-mix complex technology production with standard delivery
Financial Strength
Focus on operational excellence
Superior asset management and strong balance sheet
Successful integration of opportunistic acquisitions
7
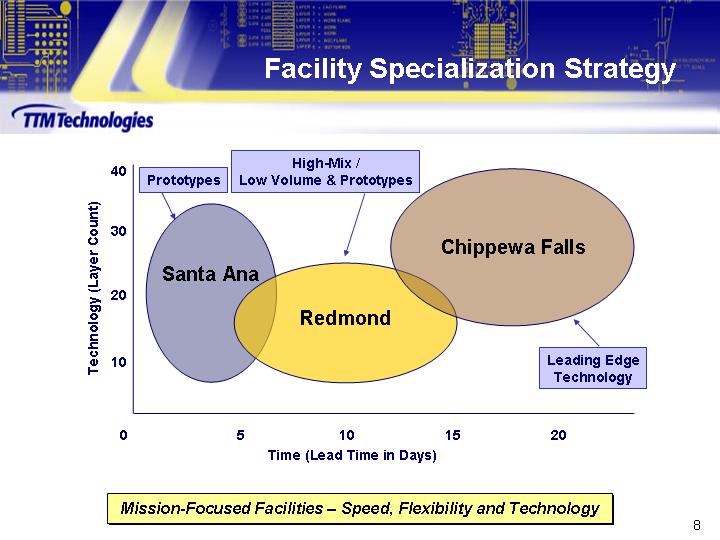
Facility Specialization Strategy
[CHART]
Mission-Focused Facilities Speed, Flexibility and Technology
8
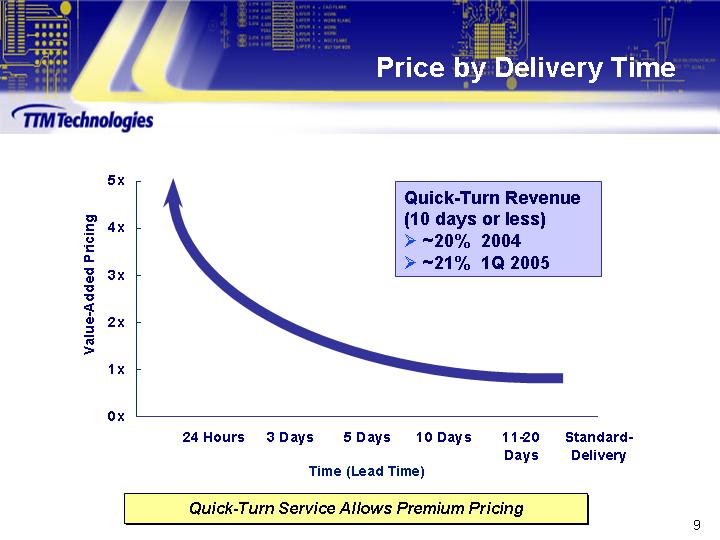
Price by Delivery Time
Quick-Turn Revenue
(10 days or less)
~20% 2004
~21% 1Q 2005
[CHART]
Quick-Turn Service Allows Premium Pricing
9
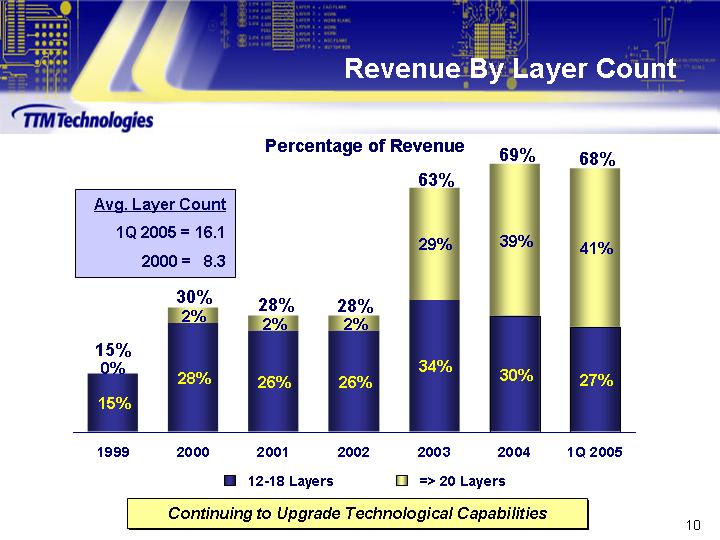
Revenue By Layer Count
Percentage of Revenue
|
Avg. Layer Count |
|
|
|
|
|
1Q 2005 = 16.1 |
|
|
2000 = 8.3 |
|
[CHART]
Continuing to Upgrade Technological Capabilities
10
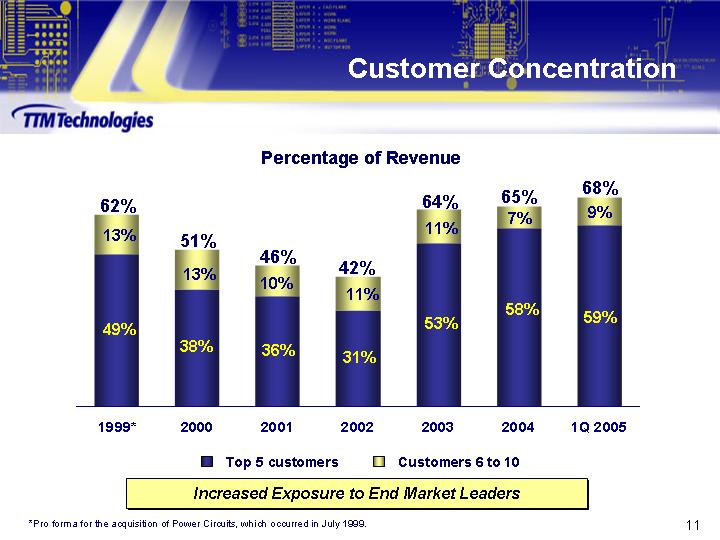
Customer Concentration
Percentage of Revenue
[CHART]
Increased Exposure to End Market Leaders
* Pro forma for the acquisition of Power Circuits, which occurred in July 1999.
11
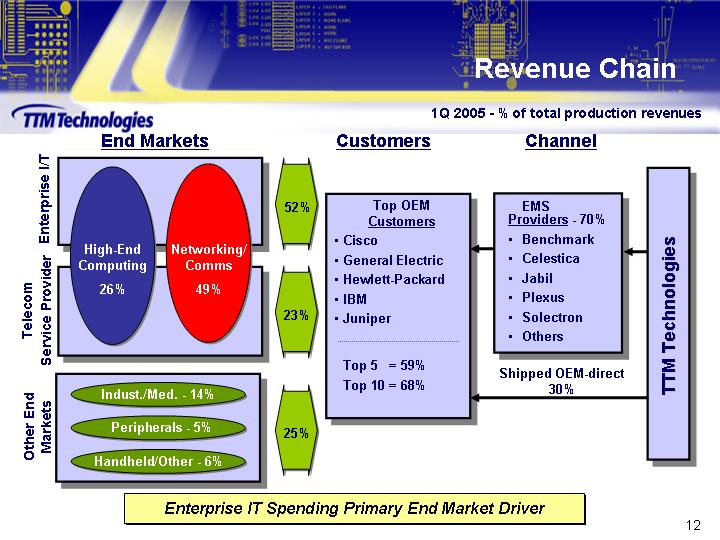
Revenue Chain
1Q 2005 - % of total production revenues
|
|
|
End Markets |
|
|
|
Customers |
|
Channel |
|
TTM Technologies |
||
|
|
|
|
|
|
|
|
|
|
|
|
||
|
|
|
|
|
|
|
|
Top OEM |
|
EMS |
|
|
|
|
Enterprise I/T |
|
|
|
|
52% |
|
Customers |
|
Providers |
- 70% |
|
|
|
|
|
|
|
|
|
|
Cisco |
|
Benchmark |
|
||
|
|
|
High-End |
Networking/ |
|
|
|
General Electric |
|
Celestica |
|
||
|
|
|
Computing |
Comms |
|
|
|
Hewlett-Packard |
|
Jabil |
|
||
|
|
|
26% |
49% |
|
|
|
IBM |
|
Plexus |
|
||
|
Telecom |
|
|
|
|
23% |
|
Juniper |
|
Solectron |
|
||
|
|
|
|
|
|
|
|
Others |
|
||||
|
|
|
|
|
|
|
|
|
|
||||
|
|
|
|
|
|
|
|
Top 5 = 59% |
|
Shipped OEM-direct |
|
||
|
|
|
|
|
|
|
|
Top 10 = 68% |
|
30% |
|
||
|
Other End |
|
Indust./Med. - 14% |
|
25% |
|
|
|
|
|
|||
|
|
|
|
|
|
|
|
|
|
||||
|
|
Peripherals - 5% |
|
|
|
|
|
|
|||||
|
|
|
|
|
|
|
|
|
|
||||
|
|
Handheld/Other - 6% |
|
|
|
|
|
|
|||||
Enterprise IT Spending Primary End Market Driver
12
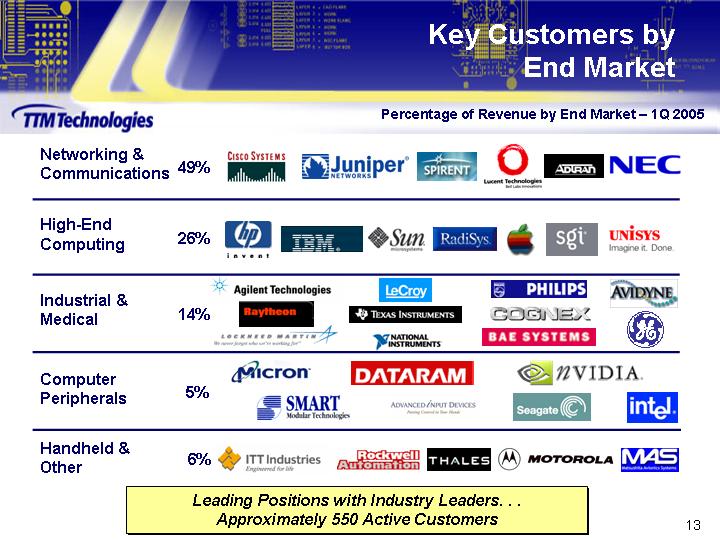
Key Customers by End Market
Percentage of Revenue by End Market 1Q 2005
|
Networking & Communications |
|
49 |
% |
[LOGO] |
|
|
|
|
|
|
|
High-End Computing |
|
26 |
% |
[LOGO] |
|
|
|
|
|
|
|
Industrial & Medical |
|
14 |
% |
[LOGO] |
|
|
|
|
|
|
|
Computer Peripherals |
|
5 |
% |
[LOGO] |
|
|
|
|
|
|
|
Handheld & Other |
|
6 |
% |
[LOGO] |
Leading Positions with Industry Leaders. . .
Approximately 550 Active Customers
13