10-K: Annual report pursuant to Section 13 and 15(d)
Published on March 3, 2023
UNITED STATES
SECURITIES AND EXCHANGE COMMISSION
Washington, D.C. 20549
Form
For the fiscal year ended
Or
For the transition period from _____________ to _____________
Commission file number
(Exact Name of Registrant as Specified in Its Charter)
|
||
|
(State or Other Jurisdiction of Incorporation or Organization) |
|
(I.R.S. Employer Identification No.) |
|
|
|
(Zip Code) |
(Address of Principal Executive Offices) |
|
|
(
(Registrant’s telephone number, including area code)
Securities registered pursuant to Section 12(b) of the Exchange Act:
|
|
|
|
Title of each class |
Trading symbol(s) |
Name of each exchange on which registered |
|
Securities registered pursuant to Section 12(g) of the Exchange Act: None
Indicate by check mark if the registrant is a well-known seasoned issuer, as defined in Rule 405 of the Securities Act.
Indicate by check mark if the registrant is not required to file reports pursuant to Section 13 or 15(d) of the Act. Yes ☐
Indicate by check mark whether the registrant: (1) has filed all reports required to be filed by Section 13 or 15(d) of the Securities Exchange Act of 1934 during the preceding 12 months (or for such shorter period that the registrant was required to file such reports), and (2) has been subject to such filing requirements for the past 90 days.
Indicate by check mark whether the registrant has submitted electronically every Interactive Data File required to be submitted pursuant to Rule 405 of Regulation S-T (§232.405 of this chapter) during the preceding 12 months (or for such shorter period that the registrant was required to submit such files).
Indicate by check mark whether the registrant is a large accelerated filer, an accelerated filer, a non-accelerated filer, a smaller reporting company, or an emerging growth company. See the definitions of “large accelerated filer,” “accelerated filer”, “smaller reporting company” and “emerging growth company” in Rule 12b-2 of the Exchange Act:
☑ |
Accelerated filer |
☐ |
|
Non-accelerated filer |
☐ |
Smaller reporting company |
|
|
|
Emerging growth company |
If an emerging growth company, indicate by check mark if the registrant has elected not to use the extended transition period for complying with any new or revised financial accounting standards provided pursuant to Section 13(a) of the Exchange Act. ☐
Indicate by check mark whether the registrant has filed a report on and attestation to its management’s assessment of the effectiveness of its internal control over financial reporting under Section 404(b) of the Sarbanes-Oxley Act (15 U.S.C. 7262(b)) by the registered public accounting firm that prepared or issued its audit
report.
If securities are registered pursuant to Section 12(b) of the Act, indicate by check mark whether the financial statements of the registrant included in the filing reflect the correction of an error to previously issued financial statements. ☐
Indicate by check mark whether any of those error corrections are restatements that required a recovery analysis of incentive-based compensation received by any of the registrant’s executive officers during the relevant recovery period pursuant to §240.10D-1(b). ☐
Indicate by check mark whether the registrant is a shell company (as defined in Rule 12b-2 of the Act). Yes
The aggregate market value of Common Stock held by non-affiliates of the registrant (based on the closing price of the registrant’s Common Stock as reported on the Nasdaq Global Select Market on July 4, 2022, the last business day of the most recently completed second fiscal quarter), was $
As of February 27, 2023, there were outstanding
DOCUMENTS INCORPORATED BY REFERENCE
Portions of the registrant’s definitive Proxy Statement for its 2023 Annual Meeting of Stockholders are incorporated by reference into Part III of this report. Such Proxy Statement will be filed with the Securities and Exchange Commission within 120 days after the end of the fiscal year to which this report relates.
Auditor Firm Id: |
Auditor Name: |
Auditor Location: |
TTM TECHNOLOGIES, INC.
ANNUAL REPORT ON FORM 10-K
TABLE OF CONTENTS
|
||
ITEM 1. |
3 |
|
ITEM 1A. |
17 |
|
ITEM 1B. |
32 |
|
ITEM 2. |
33 |
|
ITEM 3. |
33 |
|
ITEM 4. |
34 |
|
|
|
|
|
||
ITEM 5. |
35 |
|
ITEM 6. |
36 |
|
ITEM 7. |
MANAGEMENT’S DISCUSSION AND ANALYSIS OF FINANCIAL CONDITION AND RESULTS OF OPERATIONS |
37 |
ITEM 7A. |
45 |
|
ITEM 8. |
47 |
|
ITEM 9. |
CHANGES IN AND DISAGREEMENTS WITH ACCOUNTANTS ON ACCOUNTING AND FINANCIAL DISCLOSURE |
47 |
ITEM 9A. |
47 |
|
ITEM 9B. |
48 |
|
ITEM 9C. |
DISCLOSURE REGARDING FOREIGN JURISDICTIONS THAT PREVENT INSPECTIONS |
48 |
|
|
|
|
||
ITEM 10. |
49 |
|
ITEM 11. |
49 |
|
ITEM 12. |
SECURITY OWNERSHIP OF CERTAIN BENEFICIAL OWNERS AND MANAGEMENT AND RELATED STOCKHOLDER MATTERS |
49 |
ITEM 13. |
CERTAIN RELATIONSHIPS AND RELATED TRANSACTIONS, AND DIRECTOR INDEPENDENCE |
49 |
ITEM 14. |
49 |
|
|
|
|
|
||
ITEM 15. |
50 |
|
ITEM 16. |
53 |
|
54 |
||
55 |
||
2
PART I
Statement Regarding Forward-Looking Statements
This report on Form 10-K contains forward-looking statements regarding future events or our future financial and operational performance. Forward-looking statements include statements regarding markets for our products; trends in net sales, gross profits and estimated expense levels; liquidity and anticipated cash needs and availability; and any statement that contains the words “anticipate,” “believe,” “plan,” “forecast,” “foresee,” “estimate,” “project,” “expect,” “seek,” “target,” “intend,” “goal” and other similar expressions. The forward-looking statements included in this report reflect our current expectations and beliefs, and we do not undertake publicly to update or revise these statements, even if experience or future changes make it clear that any projected results expressed in this annual report or future quarterly reports to stockholders, press releases or company statements will not be realized. In addition, the inclusion of any statement in this report does not constitute an admission by us that the events or circumstances described in such statement are material. Furthermore, we wish to caution and advise readers that these statements are based on assumptions that may not materialize and may involve risks and uncertainties, many of which are beyond our control, that could cause actual events or performance to differ materially from those contained or implied in these forward-looking statements. These risks and uncertainties include the business and economic risks described in “Item 1A — Risk Factors”.
Unless otherwise indicated or unless the context requires otherwise, all references to time periods refer to our fiscal year, and all reference to “TTM,” “our company,” “we,” “us,” “our,” and similar names refer to TTM Technologies, Inc. and its subsidiaries.
ITEM 1. BUSINESS
General
We are a leading global manufacturer of technology solutions, including engineered systems, radio frequency (RF) components and RF microwave/microelectronic assemblies, and printed circuit boards (PCB). According to a November 2022 report by Prismark Partners, we are one of the largest PCB manufacturers in the world based on 2021 revenue. In 2022, we generated approximately $2.5 billion in net sales and ended the year with approximately 17,800 employees worldwide. We currently operate a total of 27 specialized facilities in North America and China. We focus on providing time-to-market and volume production of advanced technology products and offer a one-stop design, engineering and manufacturing solution to our customers. This one-stop design, engineering and manufacturing solution allows us to align technology development with the diverse needs of our customers and to enable them to reduce the time required to develop new products and bring them to market. We serve a diversified customer base consisting of approximately 1,500 customers in various markets throughout the world, including aerospace and defense, data center computing, automotive, medical, industrial and instrumentation, as well as networking and telecommunications. Our customers include original equipment manufacturers (OEMs), electronic manufacturing services (EMS) providers, original design manufacturers (ODMs), distributors and government agencies.
We report our worldwide operations based on two reportable segments: (1) PCB, which consists of eighteen domestic system, sub-system, and PCB plants; six PCB fabrication plants in China; and one in Canada; and (2) RF&S Components, which consists of one domestic RF component plant and one RF component plant in China. Each segment operates predominantly in the same industries with facilities that produce customized products for our customers and use similar means of product distribution.
Additional information on our reportable segments and product information is contained in Note 17 of the Notes to Consolidated Financial Statements.
Industry Overview
TTM provides a variety of hardware technology solutions, including completely designed and engineered systems, RF microwave/microelectronic assemblies, product lines of RF components, and technologically advanced PCBs.
TTM’s engineered systems are mostly sold to the aerospace and defense market, primarily tier one subcontractors but also directly to government agencies. Due, in part, to an increasing global threat environment, according to the United States Department of Defense Fiscal Year 2023 Budget Request Overview Book, U.S. defense spending has been growing steadily in the mid-single digit range with the most recent FY 2023 budget expected to grow in the 10% range. In addition, foreign governments, particularly North Atlantic Treaty Organization (NATO) members, have pledged to increase their defense spending which will likely drive foreign military sales (FMS) for U.S. defense contractors. Finally, due to modernization priorities, an increased proportion of defense budgets is geared towards defense electronics such as radar, communications, and surveillance. These are the key markets for our engineered systems products.
TTM’s RF microwave/microelectronic assemblies are also used in complete defense electronic systems and sold to tier one subcontractors. They benefit from increasing electronics in defense programs as well as increased focused on solid state active electronically scanned array (AESA) radar systems. Based on our internal market intelligence, we expect this market to grow faster than the overall defense market as well.
TTM is also offering several product lines of high-volume commercial RF components. These components are utilized by TTM’s customers to achieve advance signal conditioning in transceiver applications for 5G and other communication systems. Examples of RF components offered are: Hybrid and Directional Couplers, Baluns, Power Dividers, and RF Resistors. All these products are highly
3
engineered to meet the customers' critical high performance and size requirements. The growth of the 5G transceiver market is expected to exceed the overall telecommunications market growth over the next several years.
PCBs are manufactured in panels from sheets of laminated material. Each panel is typically subdivided into multiple PCBs, each consisting of a pattern of electrical circuitry etched from copper to provide an electrical connection between the components mounted to it. PCBs serve as the foundation for virtually all electronic products, including the electronic components integrated into automobiles, high-end commercial electronic equipment (such as medical equipment, data communications routers, switches and servers) and aerospace and defense electronic systems.
Products designed to offer faster data transmission, thinner and more lightweight packaging, and reduced power consumption generally require increasingly complex PCBs to meet these criteria. By using advanced technology PCB product solutions such as High Density Interconnect (HDI) and Substrate-like PCB (SLP) technologies, circuit densities can be increased, thereby providing for smaller products with higher packaging densities. Furthermore, rigid-flex circuits can be found in small and lightweight end products and other space-challenged electronics packaging applications across all end markets. Some PCB manufacturers also manufacture high performance substrates that serve as the interconnect between integrated circuits (ICs) and the PCB in many advanced electronic products serving a wide variety of end markets. Combined with the engineered systems and assemblies described earlier, we collectively refer to all of these technologies as “advanced technologies,” and they generally have growth rates which are higher than conventional technologies. In addition, most of our markets have low volume requirements during the prototype stage that demand a highly flexible manufacturing environment which later transition to a higher volume requirement during product ramp.
According to estimates in a November 2022 report by Prismark Partners, worldwide demand for PCBs was expected to be $83.3 billion for 2022. Of this worldwide demand for production in 2022, Prismark Partners reports that PCB production in the Americas accounted for approximately 4% (approximately $3.3 billion), PCB production in China accounted for approximately 53% (approximately $44.2 billion), and PCB production in the rest of the world accounted for approximately 43% (approximately $35.8 billion). According to the same report by Prismark Partners, worldwide demand for PCBs is forecast to grow at a 4.6% compound annual growth rate (CAGR) from 2021 to 2026 driven largely by strong demand for multilayer board market and growth of HDI technology and substrates. Prismark Partners expects PCB demand to slow considerably until the economic situation recovers by late 2023 and into 2024. The PCB market in 2022 benefitted from, among other things, a strong rebound in GDP due to government stimuli and the on-going re-opening of economies stemming from the coronavirus (COVID-19) pandemic.
Industry Trends
We believe that several trends impacting the advanced hardware technology design and manufacturing industry will benefit us in the future. These trends include:
Increasing complexity of electronic products, which requires technologically complex PCBs that can accommodate higher speeds and component densities, including HDI, flexible, and substrate-like PCBs as well as intricately engineered RF components and subsystems as well as completely designed engineered systems.
Higher demand for reliable product manufactured in the U.S., providing better oversight on sub-tier supply chain materials and controls. In addition, trade tensions between the U.S. and China as well as the conflict between Russia and Ukraine have increased the importance of supply chain partners with strong domestic capabilities and manufacturing footprints.
Increasing use of hardware technology solutions in diverse end markets as advanced electronics enable new capabilities. Many end markets that TTM serves have generally seen or otherwise are seeing a renaissance of growth opportunities due to the implementation of sophisticated electronics. In the defense market, solid-state radar systems referred to as AESA are being adopted in key new defense programs, replacing legacy mechanical systems. Also, the proliferation of sensors, data, data processing, and communications within the operational environment drives significant growth in sophisticated electronic components as well as integrated systems. In the medical end market, remote diagnostic systems and robotics are seeing increasing adoption. In networking, investments in 5G infrastructure and advanced networking are seeing demand for more advanced PCBs, supporting an ever connected world. Finally, in the automotive market, an increasing trend toward sophisticated safety systems, automated driving, electric/hybrid vehicles, connectivity and miniaturization of electronic devices is driving increasing electronic content and higher PCB usage in automobiles, particularly with regard to the increased demand for advanced technologies like HDI, and RF PCBs for radar and sensor applications.
Supply chain consolidation by commercial OEMs. We believe that technology solution providers that can offer one-stop manufacturing capabilities — from prototype to volume production — and integration capabilities have a competitive advantage in the market.
4
Our Strategy
Our vision is to inspire innovation as a global preeminent technology solutions company. Our core strategy includes the following elements:
Provide differentiated capabilities beyond the base PCB by incorporating advanced design-to-specification engineering support, testing, components and specialized assembly into the value-added solution provided to customers. With the acquisition of Anaren in 2018, TTM moved beyond build-to-print manufacturing and assembly capabilities to engage with customers in designing a more complete RF solution to meet their technology needs. As a result of the additional design capabilities that stemmed from the acquisition, TTM provides cost effective, ready for manufacture, enabling technologies to the customer. With the acquisition of Telephonics in June 2022, we continue to build on the Anaren acquisition to expand into integrated systems, and deepen our RF and radar related engagement with key aerospace and defense customers.
Maintain our customer-driven culture and provide superior service to our customers in our core markets of aerospace and defense, automotive, data center computing, medical/industrial/instrumentation, and networking. Our customer-oriented culture is designed to achieve extraordinary service, competitive differentiation, and superior execution. Our customer-oriented strategies include engaging in co-development of new products, capturing new technology products for next generation equipment, and continuing investments to enhance our broad offering of PCB and RF/microwave technologies from components through integrated mission systems. We have invested in and employ a diverse group of design engineers and field application engineers (FAEs) to provide technical expertise to our customers with the goal of designing the best product and service solutions for their needs, and to provide ongoing technical support. We believe our ability to anticipate and meet customers’ needs is critical to retaining existing customers and attracting leading companies as new customers.
Drive operational efficiency and productivity. We are highly focused on improving our operational execution to increase efficiency, productivity and yields. We strongly believe in the benefits of sharing best practices across our extensive manufacturing footprint and rely on stringent goals for throughput, quality and customer satisfaction to measure our effectiveness. The fast-paced nature of our business requires a disciplined approach to manufacturing that is rooted in continuous improvement.
Accelerate customer, end-market, and technology diversification through strategic mergers and acquisitions. We have a history of executing successful acquisitions that have been key to our growth and profitability. Historically, we focused on strategic opportunities that could facilitate our efforts to further diversify into other growing end markets. Now that we have a well-diversified end market mix, our focus is to expand our presence in our existing end markets, particularly aerospace and defense which has long product and program lifetimes. We will also look for strategic opportunities that further strengthen our leading-edge technology capabilities. For example, the acquisition of Anaren in 2018 added critical RF engineering, simulation and integration capabilities, the acquisition of certain assets of i3 Electronics, Inc. (i3) in 2019 allowed us to broaden our technology portfolio for high mix, low volume advanced technology PCBs, and the most recent acquisition of Telephonics in 2022 significantly broadens TTM’s aerospace and defense product offering vertically into highly engineered integrated mission system solutions and horizontally into surveillance and communications markets, while strengthening our position in radar systems.
Accelerate our expansion into growing markets using our advanced technology as a key point of differentiation. With rising requirements for faster data transmission, shrinking features (i.e., lightweight and thin), and lower power consumption, many PCB designs have migrated to more complex HDI PCBs from conventional multi-layer PCB technologies. This trend began with PCBs used in portable devices such as smartphones and other mobile devices but has become an increasing trend in other end markets, such as automotive, networking, medical, and aerospace and defense. As our customers consolidate their supply chains, our objective is to differentiate ourselves as a strategic supplier with the technology breadth to meet most, if not all, of our customers’ PCB and RF related requirements. In the defense industry, there is growing use of electronics, particularly RF/Microwave technologies to develop AESA radars and other integrated mission systems that demonstrate significant performance improvement over traditional systems.
Address customer needs in all stages of the product life cycle. By providing a one-stop solution, we work to service our customers’ needs from the earliest stages of product design and development through volume production. We believe that by servicing our customers early in the development process, we are able to demonstrate our capabilities and establish an incumbent position early in the product development cycle, which translates into additional opportunities as our customers move into volume production. We believe our expertise is enhanced by our ability to deliver highly complex PCBs to customers in significantly compressed lead times. This rapid delivery service enables OEMs to develop sophisticated electronic products more quickly and reduce their time to market. We believe we will be able to continue to increase customer engagement with customized RF solutions from the concept stage through volume production, which typically results in intensified customer engagement. Further, by providing complete engineered systems, we are working more closely with the end customer, providing them with a more complete final product which also enhances our early engagement.
Deliver consistently strong financial performance and execute on our balance sheet strategy. We aspire to deliver industry-leading financial performance. We expect to achieve this by servicing our customers’ needs in higher-growth end markets in a cost-efficient and effective manner. We believe that this strategy will allow us to generate strong cash flows, which will provide us with the financial flexibility for continued investments for growth and return of capital to shareholders.
5
Continuously enhance the elements that make TTM an appealing employer. We aim to attract the right employees to TTM who align with our values and desire growth in their professional careers. We believe our employee engagement model, emphasis on communications and inclusion, commitment to career development and talent, and collaborative culture are the top reasons employees embrace TTM. Our ability to retain valued talent while attracting candidates is paramount to our continued human capital strategy.
Products and Services
We offer a wide range of engineered systems, RF and microwave assemblies, HDI PCBs, flexible PCBs, rigid-flex PCBs, custom assemblies and system integration, IC substrates, passive RF components, advanced ceramic RF components, hi-reliability multi-chip modules, beamforming and switching networks, PCB products, RF components, and backplane/custom assembly solutions, including conventional PCBs. We also offer certain value-added services to support our customers’ needs. These include design-for-manufacturability (DFM), PCB layout design, simulation and testing services, and quick turnaround (QTA) production. For our RF sub-assemblies and components, we provide specialized assembly and RF testing to offer value-added solutions to our customers. By offering this wide range of engineered systems, RF components and sub-systems, PCB products, and complementary value-added services, we are able to provide our customers with a “one-stop” manufacturing solution for their hardware technology and integration requirements. We believe this differentiates us from our competition and enhances our customer relationships. Below we describe our product lines in more detail.
Radar Systems
We provide a wide range of high-performing, lightweight and cost-effective maritime surveillance and weather avoidance radar systems for fixed- and rotary-wing aircraft, Unmanned Aerial Vehicles (UAVs) and shipboard platforms to the U.S. government, tier one OEMs, and numerous international defense agencies. At this time, we are also the sole provider of the US Navy’s AN/APS-153 multi-mode radar on the MH-60R, and the communications suite within the MH-60R/S multi-mission helicopters. Our maritime surveillance radars offer advanced features such as Ground Moving Target Indicator (GMTI), Synthetic Aperture Radar (SAR), Inverse Synthetic Aperture Radar (ISAR), Automatic Identification System (AIS) and weather avoidance. We are developing the next generation multi-mode maritime and over-land surveillance AESA radar known as MOSAIC®.
Surveillance
We are a global leader in Identification Friend or Foe (IFF), Monopulse Secondary Surveillance Radars (MSSR) and Air Traffic Control (ATC) systems enabling military and civilian air traffic controllers to effectively identify aircraft and vehicles as friendly. We provide both equipment and supporting services required to safely and reliably control flight operations. These systems are used by the U.S. Army, U.S. Navy, U.S. Air Force, U.S. Marines, Federal Aviation Administration (FAA), NATO and numerous international defense agencies including those of Japan and South Korea. These systems have been fielded globally in a wide range of ground, air and sea-based applications.
Communications Systems
Our advanced wired and wireless communication systems provide the digital backbone for defense and civil platforms worldwide, including fixed- and rotary-wing aircraft and ground control shelters. These systems are designed to meet stringent customer requirements to support adaptability to special missions and communications protocol requirements. Our vehicle-based intercommunications systems deliver traditional intercom system capabilities while incorporating software-defined features, including an open architecture for integration into vehicle C4 (command, control, communications and computing) systems, networked communications gateways and combat vehicles. Commercial audio products and headsets are utilized worldwide in a wide range of military and civilian applications, including audiometric testing. Our communications systems are fielded within the U.S. Army, U.S. Navy, U.S. Air Force, U.S. Marines and numerous international defense agencies. These systems are also sold to aerospace manufacturers, commercial airlines and audiometric original equipment manufacturers.
RF and Microwave Assemblies
We design, produce, and test specialized circuits and components used in radio-frequency or microwave emission and collection applications. These products are typically used for radar, transmit/receive antennas and similar wireless applications. Markets for these products include defense, avionics, satellite, and commercial applications including telecommunications, networking and automotive. The manufacture of these products requires advanced materials, equipment, and methods that are highly specialized and distinct from conventional printed circuit manufacturing techniques. We also offer specialized radio-frequency assembly and test services. We have developed integrated solutions across our facilities and capabilities to provide sophisticated integrated electronics for numerous platforms, ranging from digital RF memory (DRFM) to frequency up/down converters (UDC) and channelized amplifiers for military and space applications.
Passive RF Components
Our line of products consists of off-the-shelf surface mount microwave components which provide passive microwave signal distribution functions. These products were developed to provide a low-cost high performance signal distribution component, which
6
could be placed on standard printed circuit boards with automated production equipment. The primary applications of these products are currently in equipment for cellular base stations and in WLAN, Bluetooth, and satellite television. In cellular base stations, our surface mount products are utilized in RF power amplifiers, and are also found in low-noise amplifiers, radios, and antennas. 5G advancements and the continued proliferation of wireless technology may create new applications for these products across other end markets.
Advanced Ceramic RF Components
Our ceramic offerings include standard and etched thick-film ceramic substrates. Etched thick-film ceramic circuits compete favorably with thin-film ceramic circuits in cost while providing comparable performance. These products are generally customer designed in close collaboration with our engineering staff to ensure the highest possible performance and manufacturability. These capabilities are aimed at high performance applications in the medical, industrial, and defense markets.
Hi-Reliability Multi-Chip Modules
We offer custom hybrid and multi-chip modules, high-performance radiation-hardened and space-qualified micro-electronics and power management and control electronics.
Beamforming and Switching Networks
Our beamforming technologies are used in military and aerospace applications, offering a variety of active and passive high-performance RF assemblies, including L-band/LEO and L- and S-band/GEO space beamformers, UHF thru Ka-band radar AESA RF networks, Butler matrices, multi-octave, and more.
Custom Designed Application Specific Integrated Circuits (ASICs)
Our Telephonics Large Scale Integration (TLSI) group has designed nearly 400 mixed-signal custom Application Specific Integrated Circuits (ASICs) for customers in the automotive, industrial, defense/avionics and smart energy markets. The TLSI organization works with our customers' technical teams, taking complete responsibility for the ASIC development process, from the initial ASIC specification definition through qualification and volume production, to meet the most stringent customer program requirements. Over 10 million of our ASICs are typically shipped every year.
Conventional PCBs
A conventional PCB is made from a composite laminate that is metalized with a conductive material such as copper. The PCB is the basic platform used to interconnect components in most electronic products including computers, communications equipment, high-end consumer electronics, automotive controls, commercial aerospace and defense systems and medical and industrial equipment. Conventional PCBs can be classified as single-sided, double-sided and multi-layer boards.
We focus on higher layer count conventional PCBs. A multi-layer PCB can accommodate more complex circuitry than a single-sided or double-sided PCB and as such requires more sophisticated production techniques. The number of layers comprising a PCB often increases with the complexity of the end product. For example, a simple consumer device such as a garage door controller may use a single-sided or double-sided PCB, while a high-end network router or computer server may use a PCB with 30 or more layers.
High density interconnect or HDI PCBs
Our facilities in North America and China also produce high density interconnect (HDI) PCBs, which are PCBs with higher interconnect density per unit area requiring more sophisticated technology and manufacturing processes for their production than conventional PCB products. HDI PCBs are boards with high-density characteristics including micro-sized holes, or microvias (diameter at or less than 0.15 mm), and fine line circuitry (circuit line width and spacing at or less than 0.075 mm) and are fabricated with thin high-performance materials, thereby enabling more interconnection functions per unit area. HDI PCBs generally are manufactured using a sequential build-up process in which circuitry is formed in the PCB one layer at a time through successive drilling, plating and lamination cycles. In general, a board’s complexity is a function of interconnect and circuit density, layer count, laminate material type and surface finishes. As electronic devices have become smaller and more portable with higher functionality, demand for advanced HDI PCB products has increased dramatically. We define advanced HDI PCBs as those having more than one layer of microvia interconnection structure.
Substrate-like PCBs or SLPs
Substrate-like PCBs (SLPs) represent the next evolution of high end HDI PCBs. SLPs are PCBs with even higher interconnect density per unit area than the traditional advanced HDI PCBs described above requiring an even more sophisticated manufacturing technology adapted from IC substrate fabrication with enhancements to the subtractive and additive techniques of traditional PCBs. This enables fine line circuitry (circuit line width and spacing at or less than 0.03 mm). Demand for this type of high-density circuit is continuing to penetrate the markets of more traditional PCBs. In addition, we now offer an alternative approach to building SLP technology in the United States for lower volume, higher mix commercial and aerospace and defense applications.
7
Flexible PCBs
Flexible PCBs are printed circuits produced on flexible films, allowing them to be folded or bent to fit the available space or allowing for application movement. We manufacture circuits on flexible substrates that can be installed in three-dimensional applications for electronic packaging systems. Use of flexible circuitry can enable improved reliability and electrical performance, reduced weight and reduced assembly costs when compared with traditional wire harness or ribbon cable packaging. Flexible PCBs can provide for flexible electronic connectivity of an electrical device’s apparatus such as printer heads, cameras, TVs, mobile handsets, and tablets. For some of our flexible PCB customers, we also assemble components onto the flexible PCBs we manufacture.
Rigid-flex PCBs
Rigid-flex circuitry provides a simple means to integrate multiple PCB assemblies and other elements such as display, input or storage devices without wires, cables or connectors, replacing them with thin, light composites that integrate wiring in ultra-thin, flexible ribbons between rigid sections. In rigid-flex packaging, a flexible circuit substrate provides a backbone of wiring with rigid multilayer circuit sections built up as modules where needed.
Since the ribbons can be bent or folded, rigid-flex provides a means to compactly package electronics in three dimensions with dynamic or static bending functions as required, enabling miniaturization and thinness of product design. The simplicity of rigid-flex integration also generally reduces the number of parts and interconnections required, which can improve reliability.
Rigid-flex technology is essential to a broad range of applications including aerospace and defense, industrial and transportation systems requiring high reliability; hand-held and wearable electronics, such as video cameras and music players, where thinness and mechanical articulation are essential; and ultra-miniaturized products such as headsets, medical implants and semiconductor packaging where size and reliability are paramount.
Custom assemblies
Our assembly facilities produce custom electronic assemblies. Custom electronic assemblies refers to a variety of PCB assemblies such as backplane and mid-plane assemblies, flexible and rigid-flex assemblies and RF assemblies. Each of these assemblies involves mounting electronic components to a printed circuit board and then testing the assembly for electrical continuity.
IC substrates
IC substrates provide the mechanical support and electrical interconnect used to package ICs (integrated circuits or semiconductors) either in single chip packages or multi-chip modules. IC substrates, also known as chip carriers, are highly miniaturized circuits manufactured by a process largely similar to that for PCBs but requiring the use of ultra-thin materials and including micron-scale features, because they must bridge the gap between sub-micron IC features and millimeter scale PCBs. Consequently, IC substrates are generally manufactured in a clean room environment to ensure products are free of defects and contamination and employ advanced HDI processes and manufacturing approaches used in SLP technology.
Quick turnaround services
We refer to our rapid delivery services as “quick turnaround” or “QTA”, because we provide custom-fabricated PCBs to our customers within as little as 24 hours to ten days. As a result of our ability to rapidly and reliably respond to the critical time requirements of our customers, we generally receive premium pricing for our QTA services as compared to standard lead time prices.
Thermal management
Increased component density on circuit boards often requires improved thermal dissipation to reduce operating temperatures. We produce printed circuits with heavy copper cores and both embedded and press-fit coins. In addition, we produce PCBs with electrically passive heat sinks laminated externally on a circuit board or between two circuit boards, as well as PCBs with electrically active thermal cores.
Manufacturing Technologies
The market for our products is characterized by rapidly evolving technology. The trend in the electronic products industry continues to be to implement and develop means to increase the speed, complexity, and performance of components while reducing their size. We believe our technological capabilities allow us to address the needs of manufacturers to bring complicated electronic products to market faster.
8
To manufacture PCBs, we generally receive circuit designs directly from our customers in the form of computer data files, which we review to ensure data accuracy and product manufacturability. Processing these data files with computer aided manufacturing (CAM) technology, we generate images of the circuit patterns that we then physically develop on individual layers, using advanced photographic and direct imaging processes. Through a variety of plating and etching processes, we selectively add and remove conductive materials to form horizontal layers of thin circuitry, which are separated by electrical insulating material. A multilayer circuit board is produced by laminating together multiple layers of circuitry, using intense heat and pressure under vacuum. Vertical connections between layers are achieved by drilling and plating through small holes, called vias. Vias are made by highly specialized drilling equipment capable of achieving extremely fine tolerances with high accuracy. We specialize in high layer count PCBs with extremely fine geometries and tolerances. Because of the tolerances involved, we employ clean rooms in certain manufacturing processes where tiny particles might otherwise create defects on the circuit patterns. We also use automated optical inspection systems and electrical testing systems to ensure consistent quality of the circuits we produce.
We believe that our highly specialized equipment and advanced manufacturing processes enable us to reliably produce PCBs with the following characteristics:
9
Our Integrated Electronics Manufacturing organization principally designs and manufactures state-of-the-art microwave-based hardware for use in advanced radar systems, advanced jamming systems, missiles and decoys, electronic surveillance systems and satellite and ground-based communication systems. Several core manufacturing technology areas include:
Customers and Markets
Our customers include end-users, OEMs, EMS providers, ODMs and distributors that primarily serve the aerospace and defense, automotive, data center computing, medical/industrial/instrumentation, and networking end markets of the electronics industry. Included in the end markets that our OEM and EMS customers serve is the U.S. government. As a result, we are a supplier, primarily as a subcontractor, to the U.S. government. In addition, we also sell direct to government agencies, both domestic and foreign.
See table in Item 7, Management’s Discussion and Analysis of Financial Condition and Results of Operations for the percentage of our net sales in each of the principal end markets we serve.
Sales attributed to OEMs include sales made through EMS providers and ODMs. Although our contractual relationships are often with the EMS or ODM companies, we typically negotiate price and volume requirements directly with the OEMs. In addition, we are on the approved vendor lists of several of our EMS providers. This positions us to participate in business that is awarded at the discretion of the EMS provider.
Our sales and marketing strategy focuses on building long-term relationships with our customers’ engineering and new product introduction personnel early in the product development phase, frequently through strategic account management teams. Traditional build-to-print opportunities involve TTM engineering providing design for manufacture reviews and making recommendations for both manufacturability and cost reductions without impacting specifications. Prototype builds to verify design ensue, along with the early stages of production. As the product then matures from the prototype stage to volume production, we shift our focus to the customers’
10
procurement departments in order to capture sales at each point in the product’s life cycle. Our design-to-specification capabilities allow us to engage at the onset in the engineering cycle at critical aerospace and defense, automotive, telecommunications, and networking customers as they begin the process of specifying system requirements. At that stage, we support our customers by designing a solution as well as providing early prototyping and test support for that solution. TTM will then meet the ramp to volume production requirements of our customers. Building upon this strategy and moving further vertically along the customer value chain, we also design and manufacture highly-engineered integrated mission systems for aerospace and defense applications.
Our staff of engineers, sales support personnel, and managers assist our sales representatives in advising customers with respect to manufacturing feasibility, design review, and technological capabilities through direct communication and visits. We combine our sales efforts with customer service personnel at each facility to better serve our customers. Each large customer is typically assigned an account manager to coordinate all of the Company’s services across all of our facilities. Additionally, the largest and most strategic customers are also supported by select program management and engineering teams. Our global sales force is comprised of direct sales personnel, complemented by commission-based independent representatives, and supports customers throughout North America, Europe, Asia and the Middle East.
Our North America footprint includes facilities from our PCB and RF&S Components reportable segments with nineteen PCB fabrication and engineered system plants located in California, Colorado, Connecticut, New Hampshire, New York, North Carolina, Ohio, Oregon, Utah, Virginia, Wisconsin, and Ontario, Canada; and one RF component plant located in New York.
Our China footprint includes facilities from our PCB and RF&S Components reportable segments. We have six PCB fabrication plants located in Hong Kong, Huiyang, Dongguan, Guangzhou, Shanghai and Zhongshan, China; and one RF component plant located in Suzhou, China.
We are opening a new highly automated PCB manufacturing facility in Penang, Malaysia. We expect the facility to be operational in late 2023.
For certain risks attendant to our foreign operations, see Item 1A, Risk Factors.
For information regarding credit to customers, see Note 11 of the Notes to Consolidated Financial Statements.
Suppliers
The supply chain for our different product areas is meaningfully different. For PCBs, primary raw materials are copper-clad laminates and chemicals, while for engineered systems, RF components and subsystems, primary raw materials are components such as circuit card assemblies, PCBs, semiconductors, and connectors.
The primary raw materials we use in PCB manufacturing include copper-clad laminate, chemical solutions such as copper and gold for plating operations, photographic film, carbide drill bits, and plastic for testing fixtures. Although we have preferred suppliers for some raw materials used in the manufacture of PCBs, most of our raw materials are generally readily available in the open market from numerous other potential suppliers.
The primary raw materials we use in engineered systems, RF components, RF subsystems, backplane assemblies and other PCB assemblies are manufactured components such as PCBs, ceramic and ferrite substrates, connectors, capacitors, resistors, diodes and integrated circuits, many of which are custom made and controlled by our customers’ approved vendors. The more complicated RF subsystems may require us to purchase integrated sub-assemblies and super-components such as RF oscillators, frequency converters, power supplies and microprocessors. These components for backplane assemblies and other PCB assemblies in some cases have limited or sole sources of supply. For example, in some instances, our customers will require us to use a specific component from a particular supplier or require us to use a component provided by the customer itself, in which case we may have a single or limited number of suppliers for these specific components. The backplane assemblies, PCB assemblies and precision metal fabricated chassis and enclosures produced by us may be incorporated into a fully integrated and tested system delivered to our customer. These products often incorporate procured power, thermal, interconnect and mechanical components sourced from the customer directed or our selected suppliers.
Radar, Communication and Surveillance systems use highly sophisticated electronic sub-assemblies including Transmitter and Receiver CCA’s/Modules, Travelling Wave Tube Assemblies, Exciters, Wave Form Generators and Frequency Generators. Many of these systems also require the acquisition of RF antenna arrays, illuminated panel subassemblies, inertial navigation/GPS subassemblies from OEM’s or parts specifically designed for certain applications. The material for these systems come from a variety of sources, including OEMs and Contract Manufacturers, and are often defined by the end customer.
We typically use just-in-time procurement practices to maintain our raw materials inventory at low levels and work closely with our suppliers to obtain technologically advanced raw materials. In addition, we periodically seek alternative supply sources to ensure that we are receiving competitive pricing and service. Certain raw materials, particularly semiconductors continue to be in short supply and are limiting production of some of our engineered systems while other raw materials for PCBs and subassemblies are in adequate supply now. Supply for PCB materials can vary over time depending on supply/demand dynamics for key raw materials such as copper clad laminates. See Item 1A, Risk Factors for more details.
11
Competition
For PCBs, competitors are mostly based in China and Taiwan. For engineered products such as RF sub-assemblies and systems, we compete with a different set of competitors largely based in the U.S. and Europe. The PCB industry remains fragmented and characterized by intense competition. There are several competitive factors our customers consider when choosing their supplier including, but not limited to, technical capabilities, pricing, service, support, reliability, quality production and location. Our principal PCB and substrate competitors include AT&S (Austria Technologie & Systemtechnik Aktiengesellschaft), Chin-Poon Industrial Co., Ltd., Gold Circuit Electronics Ltd., ISU Petasys Co., Ltd., Sanmina Corporation, Shennan Circuits Co., Ltd., Suzhou Dongshan Precision Manufacturing Co., Ltd., Tripod Technology Corporation, Unimicron Technology Corporation, WUS Printed Circuit Co., Ltd., and Zhen Ding Technology Holding Ltd. Our competition for RF products and engineered systems include BAE Systems plc, Cobham plc, Crane Aerospace & Electronics, Elta Systems Ltd., Hendsolt AG, Mercury Systems, Inc., RN2 Technologies Co., Selex ES (subsidiary of Leonardo S.p.A.), Smiths Group plc, and Thales Group.
We believe that our key competitive strengths include:
Leading global technology solutions manufacturer. We are one of the largest technology solutions manufacturers in North America, one of the largest suppliers to the aerospace and defense industry and have a global sales and manufacturing presence. Historically, we have focused on manufacturing PCBs, but we have been moving further up our customers’ value chain by designing and manufacturing RF sub-assemblies and engineered systems. We are one of the largest and most diversified PCB manufacturers in the world and enjoy significant economies of scale, with net sales of approximately $2.5 billion for fiscal 2022. This scale has helped us invest both organically and inorganically to provide more technology solutions to our customers. The PCB industry is highly fragmented with the top 40 PCB providers comprising approximately 75% of market share based on 2021 revenue, according to Prismark Partners. As our customers consolidate their supply base, we offer the technology breadth and scale to emerge as a preferred partner.
Breadth of technology and products. We offer a wide range of engineered systems, passive RF components, advanced ceramic RF components, hi-reliability multi-chip modules, beamforming and switching networks, integrated circuit (IC) substrates and PCB and RF products, including HDI PCBs, conventional PCBs, flexible PCBs, rigid-flex PCBs, and custom assemblies. We also offer certain value-added services to support our customers’ needs. These include RF design to specification capability, design for manufacturability (DFM), PCB layout design, simulation and testing services, and QTA services. By providing these value-added services to customers, we are able to provide our customers with a “one-stop” technology solution, which we believe enhances our relationships with our customers.
Diversified business model. Our sales are diversified by a well-balanced portfolio of end markets which we serve and by the customers we sell to within those end markets. We believe this diversity reduces our exposure to, and reliance on, any single end market or customer. We enjoy a large and diverse customer base with over 1,500 customers, as well as long-term relationships in excess of ten years with our ten largest customers. Furthermore, for fiscal 2022, our five largest customers were not concentrated in any single end market, but rather represented three of our end markets.
Focused on attractive end markets with a favorable growth outlook and dependence on sophisticated product capabilities. We believe that our global manufacturing footprint and breadth of capabilities enables us to serve multiple key end markets for our technology solutions. The aerospace & defense industry in particular provides an opportunity for us as we combine our traditional market strength in core PCB technology with the advanced technologies and RF capabilities and engineered systems we offer for growing requirements in both traditional and AESA radar systems for defense applications.
One-stop solution for customers. We are capable of providing a one-stop design, manufacturing and test solution to our customers with design services, engineering support and prototype development through final volume production around the globe. This one-stop solution allows us to better serve our customers, many of whom are based in time-critical high growth markets, enabling our customers to reduce the time required to develop new products and bring them to market. We utilize a facility specialization strategy in which each customer is directed to the facility best suited to the customer’s product type, delivery time, complexity and volume needs. This enables us to reduce the time from order placement to delivery. As our commercial customers ramp to volume, we are positioned to transition them to one of our volume facilities in China.
Leading aerospace and defense supplier. We have passed OEM and government certification processes, and administrative requirements associated with participation in government and commercial aerospace programs. When supplying various departments and agencies of the U.S. government, we are required to maintain facility security clearances under the National Industrial Security Program Operating Manual (NISPOM) and International Traffic in Arms Regulations (ITAR). Along with supply of traditional and RF PCBs, we offer a variety of RF components and sub-assemblies, engineered systems, as well as our engineering services and assembly capabilities which allow us to bring additional value to our customers.
Seasonality
We tend to experience modest seasonal softness in the first and third quarters due to holidays and vacation periods in China and North America, respectively, which limit production leading to stronger revenue levels in the second and fourth quarters.
12
Intellectual Property
Our intellectual property strategy remains deliberate and aimed at protecting the innovations critical to TTM’s business and the success of our customers and partnerships. We now have a total of more than 150 patents, with approximately 30 pending patent applications. Many of these patents stem from our 2018 acquisition of Anaren, 2019 asset and technology acquisition from i3, and 2022 acquisition of Telephonics. Our PCB business depends on the effectiveness of our fabrication techniques, proprietary PCB structures, and our ability to continually improve our manufacturing processes. We rely on the collective experience of our employees in the manufacturing process to ensure that we continuously evaluate and adopt new technologies available within our industry. In addition, we depend on robust training, recruiting, and retention of our employees, who are required to be knowledgeable in the operation of advanced equipment and complicated manufacturing processes. In regards to our RF products, the vast majority are proprietary and protected or covered by approximately fifty-eight patents and thirteen currently pending patent applications directed towards products for both the wireless infrastructure and aerospace and defense markets.
National Security Matters
A portion of our business consists of manufacturing defense and defense-related items for various departments and agencies of the U.S. government, including the U.S. Department of Defense (DoD), which requires that we maintain facility security clearances under the NISPOM. The NISPOM requires that a corporation with significant foreign ownership maintaining a facility security clearance take steps to prevent foreign control or influence, referred to as “FOCI.” In February of 2023, our Board of Directors passed a Special Board Resolution (SBR), replacing the Special Security Agreement (SSA) that we entered into with the Defense Counterintelligence and Security Agency (DCSA) in 2010. The replacement of the SSA with the SBR is a result of the significantly reduced foreign ownership of TTM. The effective date of the SBR is February 2, 2023. The SBR codifies the maintenance of the Government Security Committee of the Board to oversee our compliance and cybersecurity efforts and to put into place best practices in our facilities in the U.S. and overseas to insure that we maintain robust security practices and policies as we serve the interests of our customers in the Aerospace and Defense market. Our Government Security Committee of our Board of Directors, consists of at least 3 Board members that hold a National Security Clearance. The DCSA will continue to review TTM’s compliance with the terms of the SBR annually at each of TTM’s sites which operate under a U.S. DoD security clearance. In addition, all of TTM’s Board is currently comprised of U.S. citizens and per the terms of the SBR, in the future, no foreign citizen will be allowed to sit on TTM’s Board.
Other Governmental Regulations
Our operations, particularly those in North America, are subject to a broad range of regulatory requirements relating to export control, environmental compliance, waste management, and health and safety matters. In particular, we are subject to the following:
The process to manufacture PCBs and our other products requires adherence to city, county, state, federal, and foreign environmental laws and regulations regarding the storage, use, handling, and disposal of chemicals, solid wastes and other hazardous
13
materials, as well as compliance with wastewater and air quality standards. We believe that our facilities in the United States and Canada comply in all material respects with applicable environmental laws and regulations. In China, the government has a history of changing legal requirements with minimal notice. We believe that our facilities in China comply in all material respects with current applicable environmental laws and regulations and have resources in place to maintain compliance to them. The capital expenditure costs expected for environmental improvement initiatives are included in our annual capital expenditure projections.
Human Capital
How we manage and leverage our human capital is essential in executing our strategy. At TTM, we believe a key differentiator is our culture, which has been shaped through considerable thought and energy. Our culture has served us well as we integrate acquired companies and optimize our organizational structures and teams to better serve our customers. The following elements underpin our culture:
Commitment to Values and Ethics. The foundation of TTM’s strategic vision is its corporate culture and its way of doing business with integrity, teamwork, clear communication, and performance excellence. We seek to demonstrate the importance we place on these values through our goal setting and performance management process as well as providing ethics training to employees every year.
Along with the TTM Values and our Leadership Principles, we discuss and act in accordance with, and provide annual training for, our Code of Conduct, which outlines our expectations and provides guidance for our employees. Our Code of Conduct includes topics such as anti-corruption, discrimination, harassment, privacy, appropriate use of company assets, protecting confidential information, and reporting Code of Conduct violations. Our Code of Conduct reinforces the importance of fostering an open, welcoming environment in which all employees have a voice and a confidential outlet to raise concerns regarding potential violations.
Our commitment to our communities is demonstrated through our volunteer efforts, charitable donations, and sponsorships. As an employer, our local sites choose the organizations to affiliate with that best reflect our values.
In 2021, the TTM Board of Directors established the TTM Chair for Community Service Award to recognize one outstanding team for their contributions to the local community during the year. We host the winning external organization along with the TTM employees and executive leaders in an annual awards ceremony. In 2021, we honored the Dana Farber Cancer Fund and in 2022, we selected Long Island Cares – The Harry Chapin Food Bank and made sizable donations to both that coincided with the United Nations Volunteer Day.
Talent Development & Acquisition. Talent development is a collective and continuous effort of all of our people managers. We engage in regular talent reviews to calibrate on performance, potential, development gaps and progress, and to evaluate the depth and strength of our integrated succession plans. Our approach to learning is a continuous one, regardless of experience level or tenure. We extend leadership development programs with individually tailored development plans anchored in dedicated coaching and separate internal mentors. To ensure focus on individual development for growth and readiness for career opportunities, we track the completion of development plans of our employees in the management, technical, and professional career tracks, with over 75% documented plans in 2021. Additionally, we extend competency-based training, sponsor job rotations, and form project teams comprised of emerging talent. We provide tuition reimbursement assistance, as well as a monthly stipend to engineers to pay down student debt. Our global learning management system houses extensive internal content as well as select external materials for all to access. Our annual summer technical internship program in North America and now Asia continues to be a success in evaluating technical talent for full time positions. In 2022, we hosted over 100 interns in our factories around the globe and have extended offers of employment to most. We are designing our third Hi Potential leadership development program for 2023 which is an interactive, immersive program customized for TTM by the Center for Creative Leadership. To develop and ready our operations leaders for General Manager positions, we designed and run an internal Operations Leadership Program.
Diversity, Equity and Inclusion (DEI). Recognizing and respecting our global presence, we strive to maintain a diverse and inclusive workforce that reflects the communities that we serve. Our US workforce is approximately 41% ethnically diverse and comprised of nearly 36% females. In addition, 45% of our US new hires in 2022 identified as underrepresented minorities. As part of our efforts, TTM’s Inclusion Council works collaboratively across the organization to drive our DEI strategy and support key initiatives. The Council’s 30 members have formed four committees: Diversity Candidate Pipelines, Employee Experience, Training & Career
14
Development, and Branding & Communications. The diversity pipeline team will serve as an advisory body to our Manager of Talent Acquisition Programs who is responsible for diversity, military and university hiring. Our sites actively participate in campus hiring and job fairs throughout the year, supporting various events within each region and driving recruitment campaigns that leverage our social media platforms; this is in addition to specific campaigns dedicated to diversity and veteran hiring. We have also expanded and continue to develop our existing policies and training to address harassment, bullying and the elimination of bias in the workplace. In 2021, we partnered with Morgan State University (A Minority Serving Institution) to extend four TTM scholarships to minority engineering students. We have plans to extend partnerships to additional schools in 2023. We delivered valuable DEI learning sessions to our North America leadership teams in addition to publishing internal magazines that feature employees and their personal stories. Building on our early sessions, we are delivering content on building inclusive teams to all people leaders across the globe.
Employee Engagement & Turnover. We periodically survey our employees and benefit from favorable participation rates to identify and act on specific opportunities to enhance our work environment, improve communications, and strengthen the connection between supervisors and employees. In 2022, we deployed a full-scale engagement survey on 14 engagement drivers with 94% participation rate globally. TTM’s overall engagement survey results indicated High Performing (compared to benchmark) in all 14 drivers, with Culture and Inclusion registering the highest scores. The voice of our employees provide valuable insights on how we invest in people and prioritize specific actions and programs to attract and retain talent. We have shared the results with our employees and gathered additional insights as we develop action plans to address specific areas in 2023.
To further gauge talent attraction and the onboarding experience, we deployed a new hire survey to gather insight into our employee’s experience from the moment they first interact with TTM as a candidate to settling into their first couple of months in their new role.
Our two regional change agent networks (Asia and North America) exist to improve communications from the factory and office floor up to the senior management team. We select several employees within each site who are respected, influential and representative of the employee base to serve as change agents. This network discusses and then communicates the key initiatives within the sites in addition to raising employee concerns. Additionally, these teams prioritize site initiatives around community activities, site improvement projects, recognition programs, and new communication methods.
We review employee turnover rates paying particular attention to supervisor and technical retention. We believe the emphasis we place on selecting, training and coaching supervisors positively impacts their ability to lead people. Our leadership principles of communications, collaboration and career development are designed to improve the employee experience and strengthen working relationships. Through internal surveys, it is clear our employees value their relationships with their supervisors, career opportunities and the corporate culture.
Compensation and Benefits. We continually review our compensation and benefits programs to attempt to ensure we are in line with market conditions. In 2022, we completed a global job alignment and compensation review for all employees. We made significant investment in our employees’ total cash compensation for competitive reasons while outlining career tracks and levels. Our people leaders spoke with each employee to explain the career framework, their compensation, and potential for future jobs. The adjustments we made to base salaries and incentive compensation, coupled with the conversations on career opportunities from managers, have been very well received. Impacts of this project:
We still conducted our annual performance review cycle and subsequent salary increases separate from the aforementioned market adjustments. In addition to competitive wages, all employees participate in one of our variable incentive programs, which rewards for performance.
We also offer comprehensive benefit plans for eligible employees including mental health, employee assistance program (EAP), telemedicine offerings, several medical and dental plans with qualifying employer-funded health savings accounts, life insurance, specialty programs for diabetes and weight loss, wellness challenges, and an on-site health and physical therapy center at our largest U.S. facility.
Employee Data
As of January 2, 2023, we had approximately 17,800 employees. Of our employees, approximately 16,100 were involved in manufacturing and engineering, approximately 500 worked in sales and marketing, approximately 300 worked in research and development, and approximately 900 worked in accounting, information systems and other support capacities. Of our 6,100 U.S. employees, 55 are represented by unions. In China, approximately 10,700 employees are members of the All-China Federation of Trade
15
Unions and accordingly are considered to be represented by a labor union. We believe that our relations with both our union and non-union employees are satisfactory.
Availability of Reports Filed with the Securities and Exchange Commission
We are a Delaware corporation founded in 1998, with our principal executive offices located at 200 East Sandpointe, Suite 400, Santa Ana, CA 92707. Our telephone number is (714) 327-3000. Our website address is www.ttm.com. Information included on our website is not incorporated into this report. Our annual reports on Form 10-K, quarterly reports on Form 10-Q, current reports on Form 8-K and amendments to those reports are available without charge on our website at https://investors.ttm.com/, as soon as reasonably practicable after they are filed with or furnished electronically to the Securities and Exchange Commission (SEC). Our SEC filings are also available to the public at www.sec.gov. Copies are also available without charge by (i) telephonic request by calling our Investor Relations Department at (714) 327-3000, (ii) e-mail request to investor@ttmtech.com, or (iii) a written request to TTM Technologies, Inc., Attention: Investor Relations, 200 East Sandpointe, Suite 400, Santa Ana, CA 92707.
16
ITEM 1A. RISK FACTORS
An investment in our common stock involves a high degree of risk. You should carefully consider the factors described below, in addition to those discussed elsewhere in this report, in analyzing an investment in our common stock. If any of the events described below occurs, our business, financial condition, and results of operations would likely suffer, the trading price of our common stock could fall, and you could lose all or part of the money you paid for our common stock. The risk factors described below are not the only ones we face. Risks and uncertainties not known to us currently, or that may appear immaterial, also may have a material adverse effect on our business, financial condition, and results of operations.
In addition, the following risk factors and uncertainties could cause our actual results to differ materially from those projected in our forward-looking statements, whether made in this report or the other documents we file with the SEC, or our annual or quarterly reports to stockholders, future press releases, or orally, whether in presentations, responses to questions, or otherwise.
Risks Related to our Business
Global economic and market uncertainty may adversely impact our business and operating results.
Uncertain global economic conditions have in the past and may in the future adversely impact our business. The current uncertainty in the worldwide economic environment together with other unfavorable changes in economic conditions, such as higher than normal inflation and interest rate increases currently being experienced or implemented by most developed economies, as well as any recession, may negatively impact consumer confidence and spending, ultimately causing our customers to postpone purchases and may ultimately impact our profitability. Inflation and rapid fluctuations in inflation rates have had in the past, and may in the future have, negative effects on economies and financial markets. We could experience period-to-period fluctuations in operating results due to general industry or economic conditions and volatile or uncertain economic conditions can adversely impact our sales and profitability and make it difficult for us to accurately forecast and plan our future business activities. Furthermore, inflationary pressure and increases in interest rates may negatively impact revenue, earnings and demand for our products. During challenging economic times, our current or potential future customers may experience cash flow problems and as a result may modify, delay or cancel plans to purchase our products. Additionally, if our customers are not successful in generating sufficient revenue or are unable to secure financing, they may not be able to pay, or may delay payment of, accounts receivable that they owe us. Any inability of our current or potential future customers to pay us for our products may adversely affect our earnings and cash flow. Moreover, our key suppliers may reduce their output or become insolvent, thereby adversely impacting our ability to manufacture our products.
We serve customers and have manufacturing facilities throughout the world and are subject to risks caused by local and global pandemics and other similar risks, including without limitation, the on-going COVID-19 pandemic, which could materially adversely affect our business, financial condition, and results of operations.
Local and global pandemics or other disasters or public health concerns in regions of the world where we have operations or source material or sell products could result in the disruption of our business. Specifically, these pandemics, disasters and health concerns can result in increased travel restrictions and extended shutdowns of certain businesses in the regions in which we operate, as well as social, economic, or labor instability. Disruptions in our product shipments or impacts on our manufacturing in affected regions over a prolonged period could have a material adverse impact on our business and our financial results.
On March 11, 2020, the World Health Organization announced that COVID-19 infections had become a pandemic, and on March 13, 2020, the U.S. President announced a National Emergency relating to the disease. Federal, state, and local government responses to COVID-19 and our responses to the outbreak have all, at times, disrupted and will likely continue to disrupt our business. Even as efforts to contain the pandemic have made progress and many restrictions have relaxed, new variants of the virus have arisen globally. At times, variants of COVID-19 have caused a surge in COVID-19 cases, both regionally, such as outbreaks in Mainland China that from time to time in 2020 and continuing through most of the year in 2022 have forced temporary lockdown orders in several cities in which we operate, and globally. The ultimate impact of new variants that have emerged from time to time, cannot be predicted at this time, and could depend on numerous factors, including the availability of vaccines in different parts of the world, vaccination rates among the population, the effectiveness of COVID-19 vaccines, and the responses by governmental bodies to impose or reinstate restrictive measures from time to time.
In particular, multiple facets of our business may be negatively impacted by the fear of exposure to or actual effects of COVID-19 and other disease outbreaks, epidemics, pandemics and similar widespread public health concerns. These impacts include but are not limited to:
17
Any of the foregoing factors, or other cascading effects that are not currently foreseeable, could materially increase our costs, negatively impact our sales, or damage the Company’s financial condition, results of operations, cash flows and its liquidity position, possibly to a significant degree. The duration of any such impacts cannot be predicted because of the sweeping, on-going and uncertain nature of the circumstances involving the COVID-19 pandemic and the differing effects and responses to the pandemic by various governmental entities in the regions and countries in which we operate.
We have pursued and intend to continue to pursue potential divestitures of assets and acquisitions of other businesses and may encounter risks associated with these activities, which could harm our business and operating results. If we are unable to manage our growth effectively, our business, financial condition, and results of operations could be materially adversely affected.
As part of our business strategy, we expect that we will continue to implement and align our strategy by pursuing potential divestitures of assets and acquisitions of businesses, technologies, assets, or product lines that complement or expand our business, such as our acquisition of Gritel Holding Co., Inc. (Gritel) and ISC Farmingdale Corp. in June 2022. Telephonics Corporation is now a wholly-owned subsidiary of TTM by way of our acquisition of Gritel, the Telephonics direct parent company. Risks related to such activities and transactions may include:
Acquisitions may cause us to:
Acquisitions of high technology companies and assets are inherently risky, and no assurance can be given that our prior or future acquisitions will be successful. Failure to manage and successfully integrate acquisitions we make could have a material adverse effect on our business, financial condition, and results of operations. Even when an acquired company has already developed and marketed products, product enhancements may not be made in a timely fashion. In addition, unforeseen issues might arise with respect to such products after any such acquisition.
18
As we continue to experience growth in the scope and complexity of our operations, we may be required to implement additional operating and financial controls and hire and train additional personnel. There can be no assurance that we will be able to do so in the future, and failure to do so could jeopardize our expansion plans and seriously harm our operations. In addition, growth in our capacity could result in reduced capacity utilization and a corresponding decrease in gross margins.
Uncertainty, volatility and adverse changes in the global economy and financial markets, including those resulting from the conflict between Russia and Ukraine, could have an adverse impact on our business and operating results.
Uncertainty, volatility or adverse changes in the economy could lead to a significant decline in demand for the end products manufactured by our customers, which, in turn, could result in a decline in the demand for our products and increase pressure to reduce our prices. Any decrease in demand for our products could have an adverse impact on our financial condition, operating results, and cash flows. Uncertainty and adverse changes in the economy could also increase the cost and decrease the availability of potential sources of financing and increase our exposure to losses from bad debts, either of which could have a material adverse effect on our financial condition, operating results, and cash flows.
In February 2022, Russia commenced military hostilities against Ukraine, which has contributed to volatility in the global economy and markets and on-going geopolitical instability and is likely to have further global economic consequences, including on-going disruptions of the global supply chain and energy markets. The effects of the conflict have contributed to significant volatility in credit and capital markets, spikes in energy prices, changes in laws and regulations that may affect our business, sanctions or counter-sanctions and increased cybersecurity threats and concerns. As a result, there is a risk that supplies of our products may be significantly delayed by or may become unavailable as a result of the conflict between Russia and Ukraine affecting us or our suppliers. The conflict may, at times, reduce demand for our products because of reduced global or national economic activity, disruptions and extreme volatility in global financial markets, increased rates of default and bankruptcy, and reduced levels of business and consumer spending. The effects of the conflict between Russia and Ukraine could heighten or exacerbate many of the risk factors described in this Item 1A, Risk Factors, and may adversely affect our business, financial condition, and results of operation.
We have manufacturing facilities and serve customers outside the United States and are subject to the risks characteristic of international operations, including tariffs.
We have significant manufacturing operations in Asia and Canada and sales offices located in Asia and Europe. We continue to consider additional opportunities to make foreign investments and construct new foreign facilities.
In addition, for the year ended January 2, 2023, we generated approximately 54% of our net sales from non-U.S. operations, and a significant portion of our manufacturing material was provided by international suppliers during this period. The United States’ trade policies and those of foreign countries are subject to change which could adversely affect our ability to purchase and sell goods and materials without significant tariffs, taxes or duties that may be imposed on the materials we purchase or the goods we sell, thereby increasing the cost of such materials and potentially decreasing our margins. Further, our revenues could be impacted if our customers’ ability to sell their goods is reduced by such tariffs, taxes or duties. Both the U.S. and Chinese governments have included PCBs among items subjected to tariffs imposed on imports from such countries, which may negatively impact our revenue and profitability. In addition, we are subject to risks relating to significant international operations, including but not limited to:
19
Further, the conflict between Russia and Ukraine described in the previous risk factor, and the effects thereof, may adversely affect our manufacturing facilities and our customers.
Rising labor costs and labor shortages, including due to pandemics and other disasters, employee strikes and other labor-related disruptions may materially adversely affect our business, financial condition, and results of operations.
Our business is labor intensive, utilizing large numbers of engineering and manufacturing personnel. There is uncertainty with respect to rising labor costs and on-going labor shortages. Furthermore, labor disputes and strikes based partly on wages have in the past slowed or stopped production by certain manufacturers in China. In some cases, employers have responded by significantly increasing the wages of workers at such plants. Any increase in labor costs due to minimum wage laws or customer requirements about scheduling and overtime that we are unable to recover in our pricing to our customers could materially adversely affect our business, financial condition, and results of operations. In addition, general labor shortages (which occurred during 2021 and that continued in 2022), a high turnover rate and our difficulty in recruiting and retaining qualified employees at any level of our organization could result in a potential for defects in our products, production disruptions or delays, or the inability to ramp production to meet increased customer orders, resulting in order cancellation or imposition of customer penalties if we are unable to deliver products in a timely manner.
To respond to competitive pressures and customer requirements, we may further expand internationally in lower-cost locations. If we pursue such expansions, we may be required to make additional capital expenditures. For instance, in March 2022 we announced our plans to construct a new plant in Penang, Malaysia, which we project will require approximately $130.0 million in capital expenditures over a three-year period. In addition, the cost structure in certain countries that are now considered to be favorable may increase as economies develop or as such countries join multinational economic communities or organizations, causing local wages to rise. As a result, we may need to continue to seek new locations with lower costs and the employee and infrastructure base to support PCB manufacturing and we may lose business in our existing facilities as a result of such potential shifts in the global market. We cannot assure investors that we will realize the anticipated strategic benefits of our international operations, including our new plant, or that our international operations will contribute positively to our operating results.
In North America, we are experiencing wage inflation pressures, as a result of labor shortages, and certain pressures which are also mandated by local and state governments. Further, we are experiencing rising health care costs. While we strive to manage these challenges, there can be no assurance that our efforts will succeed which would result in higher costs and lower profits. The competition for talent and labor in North America and in general is currently extremely high. In this competitive environment, our business could be adversely impacted by increases in labor costs, which could include increases in wages and benefits necessary to attract and retain high quality employees with the right skill sets, increases triggered by regulatory actions regarding wages, scheduling, and benefits; increases in health care and workers’ compensation insurance costs; and increases in benefits and costs related to the COVID-19 pandemic and its resurgence from time to time. In light of the current challenging labor market conditions, due in part to the on-going effects from COVID-19 pandemic, our wages and benefits programs and any steps we take to increase our wages and benefits, may be insufficient to attract and retain talent at all levels of our organization. Existing labor shortages, and our inability to attract employees to maintain a qualified workforce, could adversely affect our production and our overall business and financial performance.
Strikes or labor disputes with our unionized employees, primarily in China, may adversely affect our ability to conduct our business. If we are unable to reach agreement with any of our unionized work groups on future negotiations regarding the terms of their collective bargaining agreements, we may be subject to work interruptions or stoppages. Any of these events could be disruptive to our operations and could result in negative publicity, loss of contracts, and a decrease in revenues. We may also become subject to additional collective bargaining agreements in the future if more employees or segments of our workforce become unionized, including any of our employees in the United States.
We may be unable to hire and retain sufficient qualified personnel at all levels of our organization, and the loss of any of our key executive officers, or the inability to maintain a sufficient workforce to satisfy production demands, could materially adversely affect our business, financial condition, and results of operations.
We believe that our future success will depend in large part on our ability to attract and retain highly skilled, knowledgeable, sophisticated, and qualified managerial and professional personnel. Furthermore, we have limited patent or trade secret protection for our manufacturing processes and rely on the collective experience of our employees involved in our manufacturing processes to ensure that we continuously evaluate and adopt new technologies in our industry. We may not be able to retain our executive officers and key personnel or attract additional qualified management in the future. We can make no assurances that future changes in executive management will not have a material adverse effect on our business, financial condition, or results of operations. Our business also depends on our continuing ability to recruit, train, and retain highly qualified employees, particularly engineering and sales and marketing personnel. The competition for these employees is intense, and the loss of these employees could harm our business.
20
In addition, our industry continues to experience, a shortage of workers. Although we believe this shortage is due, in part, to on-going repercussions of the COVID-19 pandemic, the shortage may prove to be systemic. We rely on maintaining a sufficient workforce at all levels of our organization to design, manufacture and distribute our products. If the labor markets remain tight and we are unable to adequately staff our facilities due to a shortage of qualified workers, our operations and financial performance would likely be adversely affected.
We rely on suppliers and equipment manufacturers for the timely delivery of raw materials, components, equipment, and spare parts used in manufacturing our PCBs. If a raw material supplier or equipment manufacturer goes bankrupt, liquidates, consolidates out of existence, experiences excess demands or other disruptions to their supply chain or operations, or otherwise fails to satisfy our product quality standards, or if the prices or availability of raw materials change, it could harm our ability to purchase new manufacturing equipment, service the equipment we have, or timely produce our products, thereby affecting our customer relationships.
To manufacture PCBs, we use raw materials such as laminated layers of fiberglass, copper foil, chemical solutions, gold, copper, and other commodity products, which we order from our suppliers. For Hybrid Microelectronics and RF components, we use various high-performance materials such as Rad Hard & Space active components, Silicon transistors, IGBTs, FETs, Signal & Zener diodes, magnets, inductors, coils, BeO and SiN substrates, as well as ceramics and printed circuit board materials. In the case of backplane assemblies, components include connectors, sheet metal, capacitors, resistors, and diodes, many of which are custom made and controlled by our customers’ approved vendors. For our Radar, Communication and Surveillance systems, we use highly sophisticated electronic assemblies including Transmitter and Receiver CCA’s/Modules, Travelling Wave Tube Assemblies, Exciters, Wave Form Generators and Frequency Generators which are specifically designed for their application.
Our success is due in part to our ability to deliver products timely to our customers, which requires successful planning and logistics infrastructure, including, ordering, transportation and receipt processing, and the ability of suppliers to meet our materials requirements.
Consolidations and restructuring in our supplier base and equipment fabricators related to our raw materials purchases or the manufacturing equipment we use to fabricate our products may result in adverse changes in pricing of materials due to reduction in competition among our raw material suppliers or an elimination or shortage of equipment and spare parts from our manufacturing equipment supply base. Suppliers and equipment manufacturers may be impacted by other events outside our control including macro-economic events, financial instability, environmental occurrences, or supplier interruptions due to fire, natural catastrophes, public health crises or otherwise. Several of these factors, including the on-going COVID-19 pandemic, have contributed to supply chain constraints we continue to experience. As a result, suppliers and equipment manufacturers have extended lead times, limited supplies, and/or increased prices due to capacity constraints and other factors. These have impacted our ability to deliver our products on a timely basis, our inventory levels and cash flow, and could negatively impact our financial results. The severity of the constraints in the supply chain is continuously changing, which creates substantial uncertainties in our business. In addition, in extreme circumstances, the suppliers we purchase from could cease production altogether due to a fire, natural disaster, consolidation or liquidation of their businesses. The supply chain constraints and other factors discussed above may continue to impact our ability to deliver our products on a timely basis, harm our customer relationships and negatively impact our financial results.
In particular, the on-going macroeconomic conditions, including the inflationary environment, have increased the cost of our raw materials and components. If raw material and component prices remain elevated and the cost of the metals that we use to produce our product, especially if the prices of copper, gold, tin, palladium, and other precious metals we use to manufacture our products remain elevated or otherwise continue to increase, it may reduce our gross margins. Should the supply of materials used in the above manufacturing processes become limited, our ability to obtain the quantities necessary to meet our customers’ demand may be impacted which could cause us to encounter reduced revenue levels or price increases which would impact our profit margins. If either of these situations occurs, our financial condition and results of operations could be negatively impacted.
We are subject to risks of currency fluctuations.
A portion of our cash, other current assets and current liabilities is held in currencies other than the U.S. dollar. Changes in exchange rates among other currencies and the U.S. dollar will affect the value of these assets or liabilities as re-measured to U.S. dollars on our balance sheet. To the extent that we ultimately decide to repatriate some portion of these funds to the United States, the actual value transferred could be impacted by movements in exchange rates. Any such type of movement could negatively impact the amount of cash available to fund operations or to repay debt. Additionally, we have revenues and costs denominated in currencies other than the U.S. dollar (primarily the Renminbi (RMB)). Fluctuations in the exchange rates between the U.S. dollar and the RMB could result in increases or decreases in our costs or revenues which could negatively impact our business, financial condition, and results of operations. Significant inflation or disproportionate changes in foreign exchange rates could occur as a result of general economic conditions, acts of war or terrorism, changes in governmental monetary or tax policy, or changes in local interest rates Further, China’s government imposes controls over the convertibility of RMB into foreign currencies, which subjects us to further currency exchange risk.
The worldwide electronics industry is intensely competitive and volatile.
A majority of our revenue is generated from the electronics industry, which is characterized by intense competition, relatively short product life cycles, and significant fluctuations in product demand. The industry is subject to economic cycles and recessionary periods. Due to the uncertainty in the end markets served by most of our customers, we have a low level of visibility with respect to
21
future financial results. Consequently, our past operating results, earnings, and cash flows may not be indicative of our future operating results, earnings, and cash flows.
If we are unable to maintain satisfactory capacity utilization rates, our business, financial condition, and results of operations would be materially adversely affected.
Given the high fixed costs of our operations, decreases in capacity utilization rates can have a significant effect on our business. Accordingly, our ability to maintain or enhance gross margins will continue to depend, in part, on maintaining satisfactory capacity utilization rates. In turn, our ability to maintain satisfactory capacity utilization will depend on the demand for our products, the volume of orders we receive, our ability to maintain a sufficient workforce at our facilities, and our ability to offer products that meet our customers’ requirements at competitive prices. If current or future production capacity fails to match current or future customer demands, our facilities would be underutilized, our sales may not fully cover our fixed overhead expenses, and we would be less likely to achieve expected gross margins. If forecasts and assumptions used to support the realizability of our long-lived assets change in the future, significant impairment charges could result that would materially adversely affect our business, financial condition, and results of operations.
In addition, we generally schedule our quick turnaround production facilities at less than full capacity to retain our ability to respond to unexpected additional quick-turn orders. However, if these orders are not received, we may forego some production and could experience continued excess capacity. If we conclude we have significant, long-term excess capacity, we may decide to permanently close one or more of our facilities and lay off some of our employees, such as our decision announced in February 2023 to close certain facilities in Hong Kong and California. Closures or lay-offs could result in our recording restructuring charges such as severance, other exit costs, and asset impairments, as well as potentially causing disruptions in our ability to supply customers. In regards to our recent announcement of the consolidation of our manufacturing footprint and the closure of three manufacturing facilities, if we do not achieve the transfer of the products from the facilities we are closing into other existing facilities or if economic conditions deteriorate, we may not achieve the expected increase in overall profitability as a result of the consolidation.
We have a significant amount of goodwill and other intangible assets on our consolidated balance sheet. If our goodwill or other intangible assets become impaired in the future, we would be required to record a non-cash charge to earnings, which may be material and would also reduce our stockholders’ equity.
As of January 2, 2023, our consolidated balance sheet included $1,048.5 million of goodwill and definite-lived intangible assets. We periodically evaluate whether events and circumstances have occurred, such that the potential for reduced expectations for future cash flows coupled with further decline in the market price of our stock and market capitalization may indicate that the remaining balance of goodwill and definite-lived intangible assets may not be recoverable. If factors indicate that assets are impaired, we would be required to reduce the carrying value of our goodwill and definite-lived intangible assets, which could harm our results during the periods in which such a reduction is recognized.
Our results of operations are often subject to demand fluctuations and seasonality. With a high level of fixed operating costs, even small revenue shortfalls would decrease our gross margins.
Our results of operations fluctuate for a variety of reasons, including:
A significant portion of our operating expenses are relatively fixed in nature, and planned expenditures are based in part on anticipated orders. Accordingly, unexpected revenue shortfalls may decrease our gross margins. In addition, we have experienced sales fluctuations due to seasonal patterns in the capital budgeting and purchasing cycles, as well as inventory management practices of our customers and the end markets we serve. These seasonal trends have caused fluctuations in our operating results in the past and may continue to do so in the future. Results of operations in any period should not be considered indicative of the results that may be expected for any future period. In addition, our future quarterly operating results may fluctuate and may not meet the expectations of securities analysts or investors.
We participate in competitive industries, including the automotive industry, which requires strict quality control standards. Failure to meet these standards may adversely affect our business, financial condition, and results of operations.
Our customer base demands the highest customer service, on time delivery and quality standards in a competitive market. Failure to meet these ever-increasing standards may result in a loss of market share for our products and services to our competitors, which may result in a decline in our overall revenue.
In addition, a significant portion of our sales are to customers within the automotive industry. The automotive industry has historically experienced multi-year cycles of growth and decline. If sales of automobiles should decline or go into a cyclical downturn,
22
our sales could decline, and this could have a materially adverse impact on our business, financial condition, and result of operations. For safety reasons, automotive customers have strict quality standards that generally exceed the quality requirements of other customers. If such products do not meet these quality standards, our business, financial condition, and results of operations may be materially adversely affected. These automotive customers may require long periods of time to evaluate whether our manufacturing processes and facilities meet their quality standards. If we were to lose automotive customers due to quality control issues, we might not be able to regain those customers or gain new automotive customers for long periods of time, which could have a material adverse effect on our business, financial condition, and results of operations. Moreover, we may be required under our contracts with automotive industry customers to indemnify them for the cost of warranties and recalls relating to our products.
The prominence of EMS companies as our customers could reduce our gross margins, potential sales, and customers.
Sales to EMS companies represented approximately 37%, 38% and 37% of our net sales for the years ended January 2, 2023, January 3, 2022 and December 28, 2020, respectively. Sales to EMS providers include sales directed by OEMs as well as orders placed with us at the EMS providers’ discretion. EMS providers source on a global basis to a greater extent than OEMs. The growth of EMS providers increases the purchasing power of such providers and has in the past, and could in the future, result in increased price competition or the loss of existing OEM customers. In addition, some EMS providers, including some of our customers, have the ability to directly manufacture PCBs and create backplane assemblies. If a significant number of our other EMS customers were to acquire these abilities, our customer base might shrink, and our sales might decline substantially. Moreover, if any of our OEM customers outsource the production of PCBs and creation of backplane assemblies to these EMS providers, our business, financial condition, and results of operations may be materially adversely affected.
We depend upon a relatively small number of OEM customers for a large portion of our sales, and a decline in sales to major customers would materially adversely affect our business, financial condition, and results of operations.
A small number of customers are responsible for a significant portion of our sales. Our five largest OEM customers collectively accounted for approximately 33%, 30% and 29% of our net sales for the years ended January 2, 2023, January 3, 2022 and December 28, 2020, respectively, and one customer represented 10% of our net sales for the year ended January 2, 2023. Furthermore, our business has benefited from OEMs deciding to outsource their PCB manufacturing and backplane assembly needs to us, and our future revenue growth partially depends on new outsourcing opportunities from OEMs. Sales attributed to OEMs include both direct sales as well as sales that the OEMs place through EMS providers. Our customer concentration could fluctuate, depending on future customer requirements, which will depend in large part on market conditions in the electronics industry segments in which our customers participate. The loss of one or more significant customers or a decline in sales to our significant customers would materially adversely affect our business, financial condition, and results of operations. In addition, we generate significant accounts receivable in connection with providing manufacturing services to our customers. If one or more of our significant customers were to become insolvent or were otherwise unable to pay for the manufacturing services provided by us, our business, financial condition, and results of operations would be materially adversely affected.
In addition, during industry downturns, we may need to reduce prices to limit the level of order losses, and we may be unable to collect payments from our customers. There can be no assurance that key customers would not cancel orders, that they would continue to place orders with us in the future at the same levels as experienced by us in prior periods, that they would be able to meet their payment obligations, or that the end-products that use our products would be successful. This concentration of customer base may materially adversely affect our business, financial condition, and results of operations due to the loss or cancellation of business from any of these key customers, significant changes in scheduled deliveries to any of these customers, or decreases in the prices of the products sold to any of these customers.
We depend on the U.S. government for a significant portion of our business, which involves unique risks. Changes in government defense spending or regulations could have a material adverse effect on our business, financial condition, and results of operations.
A significant portion of our revenues is derived from products and services that are ultimately sold to the U.S. government by our OEM and EMS customers and is therefore affected by, among other things, the federal government budget process. We supply to defense prime companies, the U.S. government and its agencies, as well as foreign governments and agencies. The contracts between our direct customers and the government end user are subject to political and budgetary constraints and processes, changes in short-range and long-range strategic plans, the timing of contract awards, the congressional budget authorization and appropriation processes, the government’s ability to terminate contracts for convenience or for default, as well as other risks, such as contractor suspension or debarment in the event of certain violations of legal and regulatory requirements.
For the year ended January 2, 2023, aerospace and defense sales accounted for approximately 35% of our total net sales. The substantial majority of aerospace and defense sales are related to both U.S. and foreign military and defense programs. Consequently, our sales are affected by changes in the defense budgets of the U.S. and foreign governments and may be affected by federal budget sequestration measures.
The domestic and international threat of terrorist activity, emerging nuclear states, and conventional military threats have generally led to an increase in demand for defense products and services and homeland security solutions in the recent past. The termination or
23
failure to fund one or more significant defense programs or contracts by the U.S. government could have a material adverse effect on our business, financial condition, and results of operations.
Future changes to the U.S. Munitions List could reduce or eliminate restrictions that currently apply to some of the products we produce. If these regulations or others are changed in a manner that reduces restrictions on products being manufactured overseas, we would likely face an increase in the number of competitors and increased price competition from overseas manufacturers, who are restricted by the current export laws from manufacturing products for U.S. defense systems.
We are exposed to the credit risk of our customers and to credit exposures in weakened markets.
Most of our sales are on an “open credit” basis, with standard industry payment terms. We monitor individual customer payment capability in granting such open credit arrangements, seek to limit such open credit to amounts we believe the customers can pay, and maintain reserves we believe are adequate to cover exposure for doubtful accounts. During periods of economic downturn in the electronics industry and the global economy, our exposure to credit risks from our customers increases. Although we have programs in place to monitor and mitigate the associated risks, such programs may not be effective in reducing our credit risks.
Additionally, our OEM customers often direct a significant portion of their purchases through a relatively limited number of EMS companies. Sales to EMS companies represented approximately 37%, 38% and 37% of our net sales for the years ended January 2, 2023, January 3, 2022 and December 28, 2020, respectively. Our contractual relationship is often with the EMS companies, who are obligated to pay us for our products. Because we expect our OEM customers to continue to direct our sales to EMS companies, we expect to continue to be subject to this credit risk with a limited number of EMS customers. If one or more of our significant customers were to become insolvent or were otherwise unable to pay us, our business, financial condition, and results of operations would be materially adversely affected.
Our business, financial condition, and results of operations could be materially adversely affected by climate change initiatives.
Our manufacturing processes require that we purchase significant quantities of energy from third parties, which results in the generation of greenhouse gases, either directly on-site or indirectly at electric utilities. Both domestic and international legislation to address climate change by reducing greenhouse gas emissions could create increases in energy costs and price volatility. Considerable international attention is now focused on development of an international policy framework to guide international action to address climate change. We are subject to the reporting requirements of the Exchange Act, which require, among other things, that we report our climate related costs and activities and our customers and suppliers. Such regulations could cause us to incur significant costs to monitor and report, which would have negative impact on our profitability. Proposed and existing legislative efforts to control or limit greenhouse gas emissions could affect our energy sources and supply choices, as well as increase the cost of energy and raw materials that are derived from sources that generate greenhouse gas emissions.
Competition in the PCB market is intense, and we could lose market share, or our profit margins may decrease, if we are unable to maintain our current competitive position in end markets using our quick-turn, high technology, and high-mix manufacturing services.
The PCB industry is intensely competitive, highly fragmented, and rapidly changing. We expect competition to continue, which could result in price reductions, reduced gross margins, and loss of market share. In addition, we increasingly compete on an international basis, and new and emerging technologies may result in new competitors entering our markets.
Some of our competitors and potential competitors have advantages over us, including:
In addition, these competitors may respond more quickly to new or emerging technologies or adapt more quickly to changes in customer requirements than we do. We must continually develop improved manufacturing processes to meet our customers’ needs for complex products, and our manufacturing process technology is generally not subject to significant proprietary protection. During recessionary periods in the electronics industry, our strategy of providing quick-turn services, an integrated manufacturing solution, and responsive customer service may take on reduced importance to our customers. As a result, we may need to compete more on the basis of price, which would cause our gross margins to decline.
We and some of our competitors have reduced average selling prices in the past. In addition, competitors may reduce their average selling prices faster than our ability to reduce costs, which can also accelerate the rate of decline of our selling prices. When prices decline, we may also be required to write down the value of our inventory. In addition, if we price our products aggressively in response
24
to market conditions, we may not be able to produce products as efficiently as we had planned and could therefore yield lower or no profit from the sale of our products.
If we are unable to adapt our design and production processes in response to rapid technological change and process development, we may not be able to compete effectively.
The markets for our products and manufacturing services are characterized by rapidly changing technology and continual implementation of new designs and production processes. The future success of our business will depend in large part upon our ability to maintain and enhance our technological capabilities, to design and manufacture products that meet changing customer needs, and to successfully anticipate or respond to technological changes on a cost-effective and timely basis. We expect that the investment necessary to maintain our technological position will increase as customers make demands for products and services requiring more advanced technology on a quicker turnaround basis. For example, in 2023 in our PCB segment, we expect to continue to make capital expenditures to expand our HDI, RF technology, and other advanced manufacturing capabilities while in our RF&S Components segment, we are designing products that we hope our customers adopt and incorporate into their products. We may not be able to obtain access to additional sources of funds in order to respond to technological changes as quickly as our competitors. In addition, our failure to adopt and implement technological improvements quickly may cause inefficiencies in our production process as our product yields or quality may decrease, resulting in increased costs, and may lead to customers not adopting our product designs.
We also could encounter competition from new or revised manufacturing, production and design technologies that render existing manufacturing, production, and design technology less competitive or obsolete. We may not respond effectively to the technological requirements of the changing market. If we need new technologies and equipment or if we are not able to design new products acceptable to customers to remain competitive, the development, acquisition, and implementation of those designs, technologies and equipment may require us to make significant capital investments.
Products we manufacture may contain design or manufacturing defects, which could result in reduced revenue from the sale of our products or services and may result in liability claims against us.
We manufacture products to our customers’ specifications, which are highly complex and may contain design or manufacturing errors or failures, despite our quality control and quality assurance efforts. Defects in the products we manufacture, whether caused by a design, manufacturing, or materials failure or error, may result in delayed shipments, customer dissatisfaction, a reduction or cancellation of purchase orders, or liability claims against us. If these defects occur either in large quantities or too frequently, our business reputation may be impaired, and our customers may decrease the orders for products or services that they purchase from us, thereby decreasing our overall revenue. Since our products are used in products that are integral to our customers’ businesses, errors, defects, or other performance problems could result in financial or other damages to our customers beyond the cost of the PCB, for which we may be liable. Although our invoices and sales arrangements generally contain provisions designed to limit our exposure to product liability and related claims, existing or future laws or unfavorable judicial decisions could negate these limitation of liability provisions. In addition, we manufacture products for a range of automotive customers. If any of our products are or are alleged to be defective, we may be required to participate in a recall of such products. As suppliers become more integral to the vehicle design process and assume more of the vehicle assembly functions, vehicle manufacturers are increasingly looking to their suppliers for contributions when faced with product liability claims or recalls. In addition, vehicle manufacturers, which have traditionally borne the costs associated with warranty programs offered on their vehicles, are increasingly requiring suppliers to guarantee or warrant their products and may seek to hold us responsible for some or all of the costs related to the repair and replacement of parts supplied by us to the vehicle manufacturer.
Infringement of our intellectual property rights could negatively affect us, and we may be exposed to intellectual property infringement claims from third parties that could be costly to defend, could divert management’s attention and resources, and if successful, could result in liability.
We rely on a combination of copyright, patent, trademark, trade secret laws, confidentiality procedures, contractual provisions, and other measures to establish and protect our proprietary and confidential information. All of these measures afford only limited protection. These measures may be invalidated, circumvented, breached, or challenged, and others may develop intellectual property, technologies or processes that are similar, or superior to, our intellectual property or technology. We may not have adequate controls and procedures in place to protect our proprietary and confidential information. Despite our efforts to protect our intellectual property and proprietary rights, unauthorized parties may attempt to copy and succeed in copying our products or may obtain or use information that we regard as proprietary or confidential. If it becomes necessary for us to resort to litigation to protect our intellectual property rights, any proceedings could be burdensome, costly, and distracting to management, and we may not prevail. Further, adequate remedies may not be available in the event of an unauthorized use or disclosure of our proprietary or confidential information. Failure to successfully establish or enforce our intellectual property rights could materially and adversely affect our business, financial condition, and results of operations. Furthermore, there is a risk that we may infringe on the intellectual property rights of others. As is the case with many other companies in the PCB industry, we from time to time receive communications from third parties asserting patent rights over our products and enter into discussions with such third parties. Irrespective of the validity or the successful assertion of such claims, we could incur costs in either defending or settling any intellectual property disputes alleging infringement. If any claims, regardless of whether they have merit, are brought against our customers for such infringement, we could be required to expend significant resources
25
in defending such claims, developing non-infringing alternatives, or obtaining licenses. We may not be successful in developing such alternatives or in obtaining such licenses on reasonable terms, or at all, and may be required to modify or cease marketing our products or services, which could disrupt the production processes, damage our reputation, and materially and adversely affect our business, financial condition, and results of operations.
Foreign laws may not afford us sufficient protections for our intellectual property, and we may not be able to obtain patent protection outside of the United States.
Certain nations that we operate in may not grant us certain intellectual property rights that are customarily granted in more developed legal systems. Patent law reform in the United States and other countries may also weaken our ability to enforce our patent rights or make such enforcement financially unattractive. For example, despite continuing international pressure on the Chinese government, intellectual property rights protection continues to present significant challenges to foreign investors and, increasingly, Chinese companies. Chinese commercial law is considered by some to be relatively undeveloped compared to the commercial law in our other major markets and only limited protection of intellectual property is available in China as a practical matter. Although we have taken precautions in the operations of our Chinese subsidiaries and in our joint venture agreement to protect our intellectual property, any local design or manufacture of products that we undertake in China could subject us to an increased risk that unauthorized parties will be able to copy or otherwise obtain or use our intellectual property, which could harm our business. We may also have limited legal recourse in the event we encounter patent or trademark infringement. Uncertainties with respect to the Chinese legal system may adversely affect the operations of our Chinese subsidiaries. China has put in place a comprehensive system of intellectual property laws; however, incidents of infringement are relatively common, and enforcement of rights can, in practice, be difficult. If we are unable to manage our intellectual property rights, our business and operating results may be seriously harmed.
Damage to any of our manufacturing facilities due to fire, natural disaster, or other events could materially adversely affect our business, financial condition, and results of operations.
The destruction or closure of any of our facilities for a significant period of time as a result of fire, explosion, blizzard, act of war or terrorism, flood, tornado, earthquake, lightning, other natural disasters, required maintenance, or other events could harm us financially, increasing our costs of doing business and limiting our ability to deliver our manufacturing services on a timely basis.
Our insurance coverage with respect to damages to our facilities or our customers’ products caused by natural disasters is limited and is subject to deductibles and coverage limits. Such coverage may not be adequate or continue to be available at commercially reasonable rates and terms.
In the event one or more of our facilities is closed on a temporary or permanent basis as a result of a natural disaster, required maintenance or other event, our operations could be significantly disrupted. Such events could delay or prevent product manufacturing and shipment for the time required to transfer production or repair, rebuild, or replace the affected manufacturing facilities. This time frame could be lengthy and result in significant expenses for repair and related costs. While we have disaster recovery plans in place, there can be no assurance that such plans will be sufficient to allow our operations to continue in the event of every natural or man-made disaster, required repair or other extraordinary event. Any extended inability to continue our operations at unaffected facilities following such an event would reduce our revenue and potentially damage our reputation as a reliable supplier.
Risks Related to our Indebtedness
We have substantial outstanding indebtedness, and our outstanding indebtedness could adversely impact our liquidity and flexibility in obtaining additional financing, our ability to fulfill our debt obligations and our financial condition and results of operations.
We have substantial debt and, as a result, we have significant debt service obligations. As of January 2, 2023, we maintain $405.9 million outstanding in a Term Loan Facility due 2024 (Term Loan Facility) at a floating rate of LIBOR plus 2.5%, $500.0 million of Senior Notes due 2029 (Senior Notes due 2029) at an interest rate of 4.0%, and $30.0 million outstanding under a $150.0 million Asia Asset-Based Lending Credit Agreement (Asia ABL). Subsequent to January 2, 2023, we made an optional debt principal prepayment of $50.0 million for our Term Loan Facility. We and a number of our direct and indirect subsidiaries also have various credit facilities and letters of credit. Such agreements also contain certain financial covenants which require us to maintain, under the occurrence of certain events, a consolidated fixed charge coverage ratio.
Subject to the limits contained in the credit agreements governing the Term Loan Facility, the U.S. Asset-Based Lending Credit Agreement (U.S. ABL), the Asia ABL, the indenture governing the Senior Notes due 2029, and our other debt instruments, we may be able to incur substantial additional debt from time to time to finance working capital, capital expenditures, investments, or acquisitions, or for other purposes. If we do so, the risks related to our high level of debt could intensify. Specifically, our high level of debt could have important consequences to us and our shareholders. For example, it could:
26
In addition, the indenture governing the Senior Notes due 2029 and the credit agreements governing the Term Loan Facility, the U.S. ABL and the Asia ABL contain restrictive covenants that limit our ability to engage in activities that may be in our long-term best interest. Our failure to comply with those covenants could result in an event of default which, if not cured or waived, could result in the acceleration of all our debt.
Furthermore, we and our subsidiaries may decide to incur significant additional indebtedness in the future. Although the indenture governing the Senior Notes due 2029, and the credit agreements governing the Term Loan Facility, the U.S. ABL and the Asia ABL will contain restrictions on the incurrence of additional indebtedness, these restrictions are subject to a number of qualifications and exceptions, and the additional indebtedness incurred in compliance with these restrictions could be substantial. These restrictions also will not prevent us from incurring obligations that do not constitute indebtedness.
Our variable rate indebtedness subjects us to interest rate risk, which could cause our debt service obligations to increase significantly.
Our Term Loan Facility and our Asia ABL are subject to interest at a floating rate of LIBOR plus a margin, and as a result, we have exposure to interest rate risk. Certain central banks, such as the U.S. Federal Reserve, effected multiple interest rate increases in 2022 and have signaled that further rate increases are likely to be implemented in 2023. Increases in interest rates increase our cost of borrowing and/or potentially make it more difficult to refinance our existing indebtedness, if necessary. At times, we have sought to reduce our exposure to interest rate fluctuations by entering into interest rate hedging arrangements. Our four-year pay-fixed, receive floating (1-month LIBOR) interest rate swap arrangement ended on June 1, 2022, and we do not currently expect to enter into a new interest rate swap arrangement. As a result, as interest rates increase we will likely need to dedicate more of our cash flow from operations to service our debt obligations. See Quantitative and Qualitative Disclosures About Market Risk and Interest Rate Risks appearing in Part II, Item 7a of this Annual Report on Form 10-K for further information.
Servicing our debt requires a significant amount of cash and we may not be able to generate sufficient cash to service all of our debt and may be forced to take other actions to satisfy our obligations under our debt, which may not be successful.
Based on certain parameters defined in the Term Loan Facility, including a First Lien Leverage Ratio, we may be required to make an additional principal payment on an annual basis if our First Lien Leverage Ratio is greater than 2.0.
Our ability to make scheduled payments on or to refinance our debt obligations and to fund planned capital expenditures and expansion efforts depends on our ability to generate cash in the future and our financial condition and operating performance, which are subject to prevailing economic and competitive conditions and to certain regulatory, competitive, financial, business, and other factors beyond our control. Given that our Asia ABL and our Term Loan Facility matures on June 2024 and September 2024, respectively, we cannot assure you that we will maintain a level of cash flows from operating activities sufficient to permit us to pay the principal, premium, if any, and interest on our debt.
If our cash flows and capital resources are insufficient to fund our debt service obligations, we could face substantial liquidity problems and could be forced to reduce or delay investments and capital expenditures or to dispose of material assets or operations, seek additional capital (which could include obtaining additional equity capital on terms that may be onerous or highly dilutive) or restructure or refinance our indebtedness. We may not be able to effect any such alternative measures, if necessary, on commercially reasonable terms or at all and, even if successful, those alternative actions may not allow us to meet our scheduled debt service obligations. The credit agreements governing the Term Loan Facility, the U.S. ABL and the Asia ABL and the indenture governing the Senior Notes due 2029 restrict our ability to dispose of assets and use the proceeds from those dispositions and may also restrict our ability to raise debt or equity capital to be used to repay other indebtedness when it becomes due. We may not be able to consummate those dispositions or to obtain proceeds in an amount sufficient to meet any debt service obligations then due.
In addition, we conduct certain of our operations through our subsidiaries. Accordingly, repayment of our indebtedness may be dependent on the generation of cash flow by our subsidiaries and their ability to make such cash available to us, by dividend, debt repayment or otherwise. Unless they are guarantors of the Senior Notes due 2029 or our other indebtedness, our subsidiaries do not have any obligation to pay amounts due on our indebtedness or to make funds available for that purpose. Our subsidiaries may not be able to, or may not be permitted to, make distributions to enable us to make payments in respect of our indebtedness. Each subsidiary is a distinct
27
legal entity, and under certain circumstances, legal and contractual restrictions may limit our ability to obtain cash from our subsidiaries. While the indenture governing the Senior Notes due 2029 and the credit agreements governing the Term Loan Facility, the U.S. ABL and the Asia ABL limit the ability of our subsidiaries to incur consensual restrictions on their ability to pay dividends or make other intercompany payments to us, these limitations are subject to qualifications and exceptions. In the event that we do not receive distributions from our subsidiaries, we may be unable to make required principal and interest payments on our indebtedness.
Our inability to generate sufficient cash flows to satisfy our debt obligations, or to refinance our indebtedness on commercially reasonable terms or at all, would materially and adversely affect our financial position and results of operations and our ability to satisfy our obligations under our indebtedness.
If we cannot make scheduled payments on our debt, we will be in default and holders of the Senior Notes due 2029 could declare all outstanding principal and interest to be due and payable, the lenders under the Term Loan Facility, the U.S. ABL and the Asia ABL could terminate their commitments to loan money, the lenders could foreclose against the assets securing their borrowings and we could be forced into bankruptcy or liquidation.
Regulatory Risks
Because of periodic power shortages in China, we may have to temporarily close our China operations, which would adversely impact our ability to manufacture our products, meet customer orders, and result in reduced revenues.
China is facing a generally persistent and growing power supply shortage. Instability in electrical supply can cause sporadic outages among residential and commercial consumers. As a result, the Chinese government from time to time has implemented power restrictions to ease the energy shortage. If we are required to make temporary closures of our facilities in China at any time, we may be unable to manufacture our products, and would then be unable to meet customer orders except from inventory on hand. As a result, we could lose sales, adversely impacting our revenues, and our relationships with our customers could suffer, impacting our ability to generate future sales.
We are subject to the requirements of the National Industrial Security Program Operating Manual (NISPOM) for our facility security clearance, which is a prerequisite to our ability to perform on classified contracts for the U.S. government.
A facility security clearance is required in order to be awarded and perform on classified contracts for the Department of Defense and certain other agencies of the U.S. government. As a cleared entity, we must comply with the requirements of the NISPOM, and any other applicable U.S. government industrial security regulations. Further, our Board has adopted a Special Board Resolution (SBR) that has been approved by the Defense Counterintelligence and Security Agency (DCSA) that provides for the Company to adopt certain corporate constructs, policies and procedures.
If we were to violate the terms and requirements of the SBR, the NISPOM, or any other applicable U.S. government industrial security regulations (which may apply to us under the terms of classified contracts), we could lose our security clearance. We cannot be certain that we will be able to maintain our security clearance. If for some reason our security clearance is invalidated or terminated, we may not be able to continue to perform on classified contracts and would not be able to enter into new classified contracts, which could materially adversely affect our business, financial condition, and results of operations.
Our operations in China and Hong Kong subject us to risks and uncertainties relating to the laws and regulations of China and Hong Kong and adverse effects of political tensions that arise from time to time with China.
The government of China is adopting evolving policies regarding foreign and domestic trade. No assurance can be given that the government of China will continue to pursue policies that allow for open trade with foreign countries, that such policies will be successful if pursued, or that such policies will not be significantly altered from time to time, particularly in light of the trade and travel restrictions that the United States and China have implemented in recent months. Despite progress in developing its legal system, China does not have a comprehensive and highly developed system of laws, particularly with respect to foreign investment activities and foreign trade. Enforcement of existing and future laws and contracts is uncertain, and implementation and interpretation thereof may be inconsistent. As the Chinese legal system develops, the promulgation of new laws, changes to existing laws, and the preemption of local regulations by national laws may adversely affect foreign investors. Further, any litigation in China may be protracted and may result in substantial costs and diversion of resources and management’s attention. Also, the evolving landscape of the interrelation between China and Hong Kong may have an adverse impact on our operations in Hong Kong and may impact our ability to attract and maintain necessary talent in that area. In addition, though changes in government policies and rules are timely published or communicated, there is usually no indication of the duration of any grace period before which full implementation and compliance will be required. As a result, it is possible that we might operate our business in violation of new rules and policies before full compliance can be achieved. These uncertainties could limit the legal protections available to us and adversely impact our results of operations.
Our failure to comply with the requirements of environmental laws could result in litigation, fines, revocation of permits necessary to our manufacturing processes, or debarment from our participation in federal government contracts.
Our operations are regulated under a number of domestic and foreign environmental and safety laws and regulations that govern, among other things, the discharge of hazardous materials into the air and water, as well as the handling, storage, recycling, and disposal of such materials. These laws and regulations include the Clean Air Act, the Clean Water Act, the Resource Conservation and Recovery
28
Act, the Superfund Amendment and Reauthorization Act, the Comprehensive Environmental Response, Compensation and Liability Act, the Toxic Substances Control Act, and the Federal Motor Carrier Safety Improvement Act, as well as analogous state, local, and foreign laws. Compliance with these environmental laws is a major consideration for us because our manufacturing processes use and generate materials classified as hazardous. Because we use hazardous materials and generate hazardous wastes in our manufacturing processes, we may be subject to potential financial liability for costs associated with the investigation and remediation of our own sites, or sites at which we have arranged for the disposal of hazardous wastes, if such sites become contaminated. Even if we fully comply with applicable environmental laws and are not directly at fault for the contamination, we may still be liable. The wastes we generate include spent ammoniacal and cupric etching solutions, metal stripping solutions, waste acid solutions, waste alkaline cleaners, waste oil, and waste waters that contain heavy metals such as copper, tin, lead, nickel, gold, silver, cyanide, and fluoride, and both filter cake and spent ion exchange resins from equipment used for on-site waste treatment.
Environmental law violations, including the failure to maintain required environmental permits, could subject us to fines, penalties, and other sanctions, including the revocation of our effluent discharge permits. This could require us to cease or limit production at one or more of our facilities and could have a material adverse effect on our business, financial condition, and results of operations. Even if we ultimately prevail, environmental lawsuits against us would be time consuming and costly to defend.
Environmental laws have generally become more stringent, and we expect this trend to continue over time, especially in developing countries, imposing greater compliance costs, and increasing risks and penalties associated with violation. We operate in environmentally sensitive locations, and we are subject to potentially conflicting and changing regulatory agendas of political, business, and environmental groups. Changes or restrictions on discharge limits, emissions levels, material storage, handling, or disposal might require a high level of unplanned capital investment or relocation to another global location where prohibitive regulations do not exist. It is possible that environmental compliance costs and penalties from new or existing regulations may materially adversely affect our business, financial condition, and results of operations.
We are increasingly required to certify compliance with various material content restrictions in our products based on laws of various jurisdictions or territories such as the Restriction of Hazardous Substances (RoHS) and Registration, Evaluation, Authorization and Restriction of Chemicals, or REACH directives in the European Union and China’s RoHS legislation. Similar laws have been adopted in other jurisdictions and may become increasingly prevalent. In addition, we must also certify as to the non-applicability of the EU’s Waste Electrical and Electronic Equipment directive for certain products that we manufacture. The REACH directive requires the identification of Substances of Very High Concern, or SVHCs periodically. We must survey our supply chain and certify to the non-presence or presence of SVHCs to our customers. As with other types of product certifications that we routinely provide, we may incur liability and pay damages if our products do not conform to our certifications.
We are also subject to an increasing variety of environmental laws and regulations in China, which impose limitations on the discharge of pollutants into the air and water and establish standards for the treatment, storage, and disposal of solid and hazardous wastes for us and our vendors that assist us in managing the waste generated by our manufacturing processes. The manufacturing of our products generates gaseous chemical wastes, liquid wastes, wastewater, and other industrial wastes from various stages of the manufacturing process. Production sites, waste collectors, and vendors in China are subject to increasing regulation and periodic monitoring by the relevant environmental protection authorities. Environmental claims or the failure to comply with current or future regulations could result in the assessment of damages or imposition of fines against us, suspension of production, or cessation of operations.
The process to manufacture PCBs and our other products requires adherence to city, county, state, federal, and foreign environmental laws and regulations regarding the storage, use, handling, and disposal of chemicals, solid wastes, and other hazardous materials, as well as compliance with wastewater and air quality standards. We rely on our vendors for the transportation and disposal of our solid and hazardous wastes generated by our manufacturing processes. If we are not able to find such services, our ability to conduct our business and our results of operations may be adversely impacted. In China, the government has a history of changing legal requirements with no or minimal notice. We believe that our facilities in China comply in all material respects with current applicable environmental laws and regulations and have resources in place to maintain compliance to them. The capital expenditure costs expected for environmental improvement initiatives are included in our annual capital expenditure projections.
29
Our international sales are subject to laws and regulations relating to corrupt practices, trade, and export controls and economic sanctions. Any non-compliance could have a material adverse effect on our business, financial condition, and results of operations.
We operate on a global basis and are subject to anti-corruption, anti-bribery, and anti-kickback laws and regulations, including restrictions imposed by the Foreign Corrupt Practices Act (FCPA). The FCPA and similar anti-corruption, anti-bribery, and anti-kickback laws in other jurisdictions generally prohibit companies and their intermediaries and agents from making improper payments to government officials or any other persons for the purpose of obtaining or retaining business. We operate and sell our products in many parts of the world that have experienced governmental corruption to some degree and, in certain circumstances, strict compliance with anti-corruption, anti-bribery, and anti-kickback laws may conflict with local customs and practices. We also, from time to time, undertake business ventures with state-owned companies or enterprises.
Our global business operations must also comply with all applicable domestic and foreign export control laws, including International Traffic In Arms Regulations (ITAR) and Export Administration Regulations (EAR). Some items we manufacture are controlled for export by the U.S. Department of Commerce’s Bureau of Industry and Security under EAR.
We train our employees concerning anti-corruption, anti-bribery, and anti-kickback laws and compliance with international regulations regarding trades and exports, and we have policies in place that prohibit employees from making improper payments. We cannot provide assurances that our internal controls and procedures will guarantee compliance by our employees or third parties with whom we work. If we are found to be liable for violations of the FCPA or similar anti-corruption, anti-bribery, or anti-kickback laws in international jurisdictions or for violations of ITAR, EAR, or other similar regulations regarding trades and exports, either due to our own acts or out of inadvertence, or due to the inadvertence of others, we could suffer criminal or civil fines or penalties or other repercussions, including reputational harm, which could have a material adverse effect on our business, financial condition, and results of operations.
Our global business operations also must be conducted in compliance with applicable economic sanction laws and regulations, such as laws administered by the U.S. Department of the Treasury’s Office of Foreign Asset Control, the U.S. State Department, and the U.S. Department of Commerce. We must comply with all applicable economic sanction laws and regulations of the United States and other countries. Imposition of economic sanction laws and regulations on a company or country could impact our revenue levels. Violations of these laws or regulations could result in significant additional sanctions including criminal or civil fines or penalties, more onerous compliance requirements, more extensive debarments from export privileges, or loss of authorizations needed to conduct aspects of our international business.
In certain countries, we may engage third-party agents or intermediaries, such as customs agents, to act on our behalf, and if these third-party agents or intermediaries violate applicable laws, their actions may result in criminal or civil fines or penalties or other sanctions being assessed against us. We take specific measures designed to ensure our compliance with U.S. export and economic sanctions laws, anti-corruption laws and regulations, and export control laws. However, it is possible that some of our products were sold or will be sold to distributors or other parties, without our knowledge or consent, in violation of applicable law. There can be no assurances that we will be in compliance in the future. Any such violation could result in significant criminal or civil fines, penalties, or other sanctions and repercussions, including reputational harm, which could have a material adverse effect on our business, financial condition, and results of operations.
We incur significant costs as a result of operating as a public company, and our management is required to devote substantial time to current and evolving compliance initiatives and corporate governance practices.
As a public company we incur significant legal, accounting and other expenses that we likely would not incur as a private company. We are subject to the reporting requirements of the Exchange Act, which require, among other things, that we file with the SEC annual, quarterly and current reports with respect to our business and financial condition. In addition, the Sarbanes-Oxley Act of 2002 and rules subsequently implemented by the SEC and Nasdaq have imposed various requirements on public companies, including establishment and maintenance of effective disclosure and financial controls and corporate governance practices. Our management and other personnel devote a substantial amount of time to these compliance initiatives. Further, in July 2010, the Dodd-Frank Wall Street Reform and Consumer Protection Act, or the Dodd-Frank Act, was enacted. There are significant corporate governance and executive compensation related provisions in the Dodd-Frank Act that require the SEC, from time to time, to adopt additional rules and regulations in these areas, such as “say on pay” and proxy access. Stockholder activism, the current political environment and the current high level of government intervention and regulatory reform may lead to further substantial new regulations and disclosure obligations, which may lead to additional compliance costs and impact the manner in which we operate our business in ways we cannot currently anticipate. The rules and regulations applicable to public companies substantially increase our legal and financial compliance costs and make some activities more time-consuming and costly. When these requirements divert the attention of our management and personnel from other business concerns, they could have a material adverse effect on our business, financial condition and results of operations. The increased costs may decrease our net income (or increase our net loss) and may require us to reduce costs in other areas of our business or increase the prices of our products or services. We cannot predict or estimate the amount or timing of additional costs we may incur to respond to these requirements.
30
Other Risks
We may need additional capital in the future to fund investments in our operations, refinance our indebtedness, and to maintain and grow our business, and such capital may not be available on a timely basis, on acceptable terms, or at all.
Our business is capital-intensive, and our ability to increase revenue, profit, and cash flow depends upon continued capital spending. To the extent that the funds generated by our on-going operations are insufficient to cover our liquidity requirements, we may need to raise additional funds through financings. If we are unable to fund our operations and make capital expenditures as currently planned or if we do not have sufficient liquidity to service the interest and principal payments on our debt, it would have a material adverse effect on our business, financial condition, and results of operations. If we do not achieve our expected operating results, we would need to reallocate our sources and uses of operating cash flows. This may include borrowing additional funds to service debt payments, which may impair our ability to make investments in our business. Looking ahead at long-term needs, we may need to raise additional funds for a number of purposes, including the following:
Should we need to raise funds through incurring additional debt, we may become subject to covenants even more restrictive than those contained in our current debt instruments. There can be no assurance that additional capital, including any future equity or debt financing, would be available on a timely basis, on favorable terms, or at all. If such funds are not available to us when required or on acceptable terms, our business, financial condition, and results of operations could be materially adversely affected.
Outages, computer viruses, cyber-attacks, and similar events could disrupt our operations, and breaches of our security systems may cause us to incur significant legal and financial exposure.
We rely on information technology networks and systems, some of which are owned and operated by third parties, to collect, process, transmit, and store electronic information. In particular, we depend on our information technology infrastructure for a variety of functions, including worldwide financial reporting, inventory management, procurement, invoicing, and email communications. Any of these systems may be susceptible to outages due to fire, floods, power loss, telecommunications failures, hacking, terrorist attacks, and similar events. In addition, in the ordinary course of our business, we collect and store sensitive data in our data centers and on our networks, including intellectual property, our proprietary and confidential business information and that of our customers, suppliers and business partners, and personally identifiable information of our employees. The secure collection, processing, storage, maintenance and transmission of this information is critical to our operations. Despite the implementation of network security measures, our systems and those of third parties on which we rely may also be vulnerable to computer viruses, break-ins, cyber-attacks, attacks by hackers or breaches due to employee or third party (including suppliers and business partners) error, malfeasance, or other disruptions. If we or our vendors are unable to prevent such outages and breaches, our operations could be disrupted. If unauthorized parties gain access to our information systems or such information is used in an unauthorized manner, misdirected, altered, lost, or stolen during transmission, any theft or misuse of such information could result in, among other things, unfavorable publicity, governmental inquiry and oversight, difficulty in marketing our services, allegations by our customers that we have not performed our contractual obligations, loss of customers, litigation by affected parties, and possible financial obligations for damages related to the theft or misuse of such information, any of which could have a material adverse effect on our business, financial condition, and results of operations.
Issues arising during the upgrade of our enterprise resource planning system could affect our operating results and ability to manage our business effectively.
We are continuing the process of upgrading our enterprise resource planning, or ERP, management system to enhance operating efficiencies and provide more effective management of our business operations. We are investing significant financial and personnel resources into this project. However, there is no assurance that the system upgrade will meet our current or future business needs or that it will operate as designed. The transition to the new ERP system will affect numerous systems necessary for our operation. If we fail to correctly implement one or more components of the ERP system, we could experience significant disruption to our operations. Such disruptions could include, among other things, temporary loss of data, inability to process certain orders, failure of systems to communicate with each other and the inability to track or reconcile key data. We are heavily dependent on automated management systems, and any significant failure or delay in the system upgrade could cause a substantial interruption to our business and additional expense, which could result in an adverse impact on our operating results, cash flows or financial condition.
31
Our ability to use net operating loss carryforwards to offset future taxable income for U.S. federal, state and foreign income tax purposes is subject to limitations, and future transfers of shares of our common stock could cause us to experience an “ownership change” that could further limit our ability to utilize our net operating losses.
Under U.S. federal income tax law, a corporation’s ability to utilize its net operating losses (NOLs) to offset future taxable income may be significantly limited if it experiences an “ownership change” as defined in Section 382 of the Internal Revenue Code of 1986, as amended. In general, an ownership change will occur if there is a cumulative change in a corporation’s ownership by “5-percent shareholders” that exceeds 50 percentage points over a rolling three-year period.
A corporation that experiences an ownership change will generally be subject to an annual limitation on its pre-ownership change NOLs equal to the value of the corporation immediately before the ownership change, multiplied by the long-term tax-exempt rate (subject to certain adjustments). The annual limitation for a taxable year is generally increased by the amount of any “recognized built-in gains” for such year and the amount of any unused annual limitation in a prior year. As a result of our acquisition of Viasystems, the NOLs acquired were subject to this limitation. Future transfers or sales of our common stock during a rolling three-year period by any of our “5-percent shareholders” could cause us to experience an ownership change under Section 382, which could further limit our use of NOL.
If our net earnings do not remain at or above recent levels, or we are not able to predict with a reasonable degree of probability that they will continue, we may have to record a valuation allowance against our net deferred income tax assets.
Our U.S. entities and certain of our foreign subsidiaries have deferred income tax assets. Based on our forecast for future earnings and analysis, we believe we may not utilize our deferred income tax assets in future periods in the U.S. and certain subsidiaries in foreign jurisdictions and have established a valuation allowance against those deferred tax assets. If our estimates of future earnings and analysis changes, we may change our decisions to have a valuation allowance against our deferred income tax assets, which will result in an increase or decrease to our income tax provision that can impact our results of operations.
Unanticipated changes in our tax rates or in our assessment of the realizability of our deferred income tax assets or exposure to additional income tax liabilities could affect our business, financial condition, and results of operations.
We are subject to income taxes in the United States and various foreign jurisdictions. Significant judgment is required in determining our provision for income taxes and, in the ordinary course of business, there are many transactions and calculations in which the ultimate tax determination is uncertain. Our effective tax rates could be materially adversely affected by changes in the mix of earnings in countries and states with differing statutory tax rates, changes in the valuation of deferred income tax assets and liabilities, changes in tax laws or regulations such as those proposed by the Organization for Economic Co-operation and Development (OECD), as well as other factors. Our tax determinations are regularly subject to audit by tax authorities, and developments in those audits could adversely affect our income tax provision. Although we believe that our tax estimates are reasonable, the final determination of tax audits or tax disputes may be different from what is reflected in our historical income tax provisions, which could materially adversely affect our business, financial condition, and results of operations.
ITEM 1B. UNRESOLVED STAFF COMMENTS
None.
32
ITEM 2. PROPERTIES
The following table describes our headquarters and our principal manufacturing facilities.
U.S. Locations |
|
Operating |
|
Leased |
|
|
Owned |
|
|
Total |
|
|||
Anaheim, CA |
|
PCB |
|
|
— |
|
|
|
96,000 |
|
|
|
96,000 |
|
Chippewa Falls, WI |
|
PCB |
|
|
— |
|
|
|
281,000 |
|
|
|
281,000 |
|
Elizabeth City, NC |
|
PCB |
|
|
— |
|
|
|
47,784 |
|
|
|
47,784 |
|
Farmingdale, NY |
|
PCB |
|
|
— |
|
|
|
171,600 |
|
|
|
171,600 |
|
Forest Grove, OR |
|
PCB |
|
|
12,774 |
|
|
|
217,950 |
|
|
|
230,724 |
|
Huntington, NY |
|
PCB |
|
|
82,440 |
|
|
|
— |
|
|
|
82,440 |
|
Littleton, CO |
|
PCB |
|
|
54,590 |
|
|
|
63,210 |
|
|
|
117,800 |
|
Logan, UT |
|
PCB |
|
|
12,000 |
|
|
|
118,448 |
|
|
|
130,448 |
|
North Jackson, OH |
|
PCB |
|
|
8,800 |
|
|
|
85,000 |
|
|
|
93,800 |
|
Salem, NH |
|
PCB |
|
|
43,700 |
|
|
|
— |
|
|
|
43,700 |
|
San Diego, CA |
|
PCB |
|
|
43,336 |
|
|
|
— |
|
|
|
43,336 |
|
San Jose, CA |
|
PCB |
|
|
42,434 |
|
|
|
— |
|
|
|
42,434 |
|
Santa Ana, CA (1) |
|
Headquarters |
|
|
14,472 |
|
|
|
— |
|
|
|
14,472 |
|
Santa Ana, CA |
|
PCB |
|
|
9,416 |
|
|
|
82,550 |
|
|
|
91,966 |
|
Santa Clara, CA |
|
PCB |
|
|
21,966 |
|
|
|
45,685 |
|
|
|
67,651 |
|
Stafford, CT |
|
PCB |
|
|
— |
|
|
|
126,924 |
|
|
|
126,924 |
|
Stafford Springs, CT |
|
PCB |
|
|
— |
|
|
|
99,579 |
|
|
|
99,579 |
|
Sterling, VA (2) |
|
PCB |
|
|
100,896 |
|
|
|
— |
|
|
|
100,896 |
|
Syracuse, NY (3) |
|
PCB and |
|
|
37,639 |
|
|
|
160,000 |
|
|
|
197,639 |
|
Total |
|
|
|
|
484,463 |
|
|
|
1,595,730 |
|
|
|
2,080,193 |
|
Foreign Locations |
|
Operating |
|
Leased |
|
|
Owned |
|
|
Total |
|
|||
Canada |
|
|
|
|
|
|
|
|
|
|
|
|||
Toronto |
|
PCB |
|
|
15,500 |
|
|
|
99,960 |
|
|
|
115,460 |
|
China |
|
|
|
|
|
|
|
|
|
|
|
|||
Dongguan |
|
PCB |
|
|
— |
|
|
|
1,069,129 |
|
|
|
1,069,129 |
|
Guangzhou |
|
PCB |
|
|
— |
|
|
|
1,872,800 |
|
|
|
1,872,800 |
|
Hong Kong (1) |
|
Asia Headquarters |
|
|
— |
|
|
|
24,640 |
|
|
|
24,640 |
|
Hong Kong |
|
PCB |
|
|
— |
|
|
|
128,432 |
|
|
|
128,432 |
|
Huiyang |
|
PCB |
|
|
— |
|
|
|
435,485 |
|
|
|
435,485 |
|
Shanghai |
|
PCB |
|
|
85,745 |
|
|
|
— |
|
|
|
85,745 |
|
Suzhou |
|
RF&S Components |
|
|
68,030 |
|
|
|
— |
|
|
|
68,030 |
|
Zhongshan |
|
PCB |
|
|
— |
|
|
|
1,132,760 |
|
|
|
1,132,760 |
|
Total |
|
|
|
|
169,275 |
|
|
|
4,763,206 |
|
|
|
4,932,481 |
|
We maintain our properties in good operating condition. We believe that our properties are suitable and adequate for us to operate at present levels, and the productive capacity and extent of utilization of the facilities are appropriate for our existing manufacturing requirements.
ITEM 3. LEGAL PROCEEDINGS
From time to time, we may become a party to various legal proceedings arising in the ordinary course of our business. There can be no assurance that we will prevail in any such litigation. We believe that the amount of any reasonably possible or probable loss for known matters would not be material to our financial statements; however, the outcome of these actions is inherently difficult to predict. In the event of an adverse outcome, the ultimate potential loss could have a material adverse effect on our financial condition, results of operations, or cash flows in a particular period.
33
ITEM 4. MINE SAFETY DISCLOSURES
Not applicable.
34
PART II
ITEM 5. MARKET FOR REGISTRANT’S COMMON EQUITY, RELATED STOCKHOLDER MATTERS AND ISSUER PURCHASES OF EQUITY SECURITIES
Market Information
Our common stock has been listed on the Nasdaq Global Select Market under the symbol “TTMI” since September 21, 2000.
As of February 27, 2023, there were approximately 268 holders of record of our common stock. The closing sale price of our common stock on the Nasdaq Global Select Market on February 27, 2023 was $13.42.
STOCK PRICE PERFORMANCE GRAPH
The performance graph below compares, for the period from January 1, 2018 to January 2, 2023, the cumulative total stockholder return on our common stock against the cumulative total return of:
The graph assumes $100 was invested in our common stock on January 1, 2018, and an investment in Nasdaq Composite Index and the Dow Jones US Electrical Components & Equipment Index. The stock performance shown on the graph below represents historical stock performance and is not necessarily indicative of future stock performance.
COMPARISON OF 5 YEAR CUMULATIVE TOTAL RETURN*
Among TTM Technologies, Inc., the Nasdaq Composite Index
and the Dow Jones US Electrical Components & Equipment Index
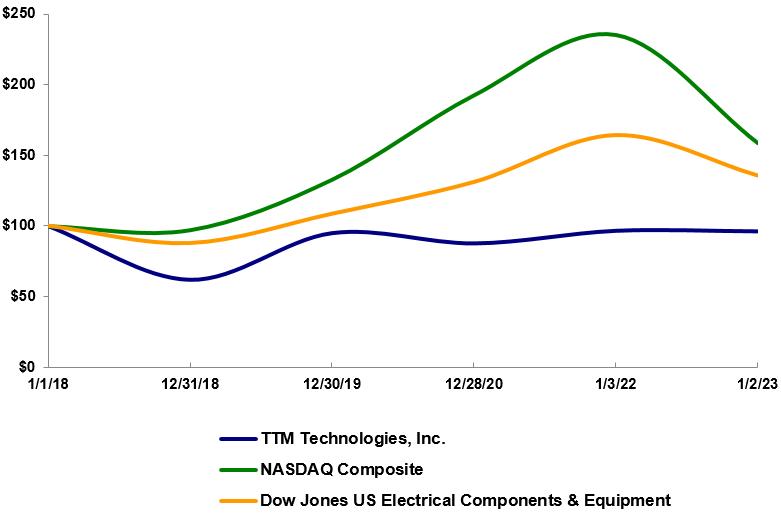
* $100 invested on January 1, 2018 in stock or index, including reinvestment of dividends.
|
1/1/2018 |
|
|
12/31/2018 |
|
|
12/30/2019 |
|
|
12/28/2020 |
|
|
1/3/2022 |
|
|
1/2/2023 |
|
||||||
TTM Technologies, Inc. |
$ |
100.00 |
|
|
$ |
62.09 |
|
|
$ |
94.96 |
|
|
$ |
87.75 |
|
|
$ |
96.62 |
|
|
$ |
96.23 |
|
Nasdaq Composite |
|
100.00 |
|
|
|
97.16 |
|
|
|
132.81 |
|
|
|
192.47 |
|
|
|
235.15 |
|
|
|
158.65 |
|
Dow Jones US Electrical Components & |
|
100.00 |
|
|
|
87.73 |
|
|
|
108.51 |
|
|
|
131.02 |
|
|
|
164.23 |
|
|
|
135.50 |
|
The performance graph above shall not be deemed “filed” for purposes of Section 18 of the Exchange Act, or otherwise subject to the liability of that section. The performance graph above will not be deemed incorporated by reference into any filing of our company under the Securities Act of 1933, as amended, or the Exchange Act.
35
Dividends
We have never declared or paid cash dividends on our common stock. We currently expect to retain future earnings for capital expenditures, acquisitions, to fund working capital requirements, repay existing debt, and potentially for share repurchases and do not anticipate paying cash dividends in the foreseeable future. Additionally, our ability to pay dividends is limited pursuant to covenants contained in our various debt agreements.
ITEM 6. RESERVED
Not applicable.
36
ITEM 7. MANAGEMENT’S DISCUSSION AND ANALYSIS OF FINANCIAL CONDITION AND RESULTS OF OPERATIONS
This financial review presents our operating results for each of our three most recent fiscal years and our financial condition as of January 2, 2023. Except for historical information contained herein, the following discussion contains forward-looking statements which are subject to known and unknown risks, uncertainties and other factors that may cause our actual results to differ materially from those expressed or implied by such forward-looking statements. We discuss such risks, uncertainties and other factors throughout this report and specifically under Item 1A of Part I of this report, Risk Factors. In addition, the following discussion should be read in connection with the information presented in our consolidated financial statements and the related notes to our consolidated financial statements.
COMPANY OVERVIEW
We are a leading global manufacturer of technology solutions, including engineered systems, radio frequency (RF) components and RF microwave/microelectronic assemblies, and printed circuit boards (PCB). We focus on providing time-to-market and volume production of advanced technology products and offer a one-stop design, engineering and manufacturing solution to our customers. This one-stop design, engineering and manufacturing solution allows us to align technology development with the diverse needs of our customers and to enable them to reduce the time required to develop new products and bring them to market. We serve a diversified customer base consisting of approximately 1,500 customers in various markets throughout the world, including aerospace and defense, data center computing, automotive, medical, industrial and instrumentation, as well as networking and telecommunications. Our customers include original equipment manufacturers (OEMs), electronic manufacturing services (EMS) providers, original design manufacturers (ODMs), distributors and government agencies.
RECENT DEVELOPMENTS
On February 8, 2023, we announced that we intend to close PCB manufacturing operations in Anaheim and Santa Clara, California, and Hong Kong and to consolidate the business from these impacted sites into our remaining facilities. The plant closures are expected to improve both facility and talent utilization across our footprint resulting in improved profitability. We expect to record between $22.0 million and $28.0 million in separation, asset impairment and disposal costs related to this restructuring, primarily between now and the end of 2023. Approximately 80% of these costs are expected to be in the form of cash expenditures and the rest in the form of non-cash charges.
On December 22, 2022, our land, building, and relevant ancillary assets related to our former Shanghai E-MS (SH E-MS) manufacturing facility was expropriated by the Chinese government for a compensation fee of Renminbi (RMB) 477.6 million ($69.2 million as of January 2, 2023) generating a gain on the sale of $51.8 million. We will receive the proceeds as follows: 50% before March 30, 2023, 40% before June 30, 2023, and 10% before December 30, 2023.
On June 27, 2022, we completed our acquisition of all of the issued and outstanding common stock of Gritel Holding Co., Inc. (Gritel) and ISC Farmingdale Corp. for a total consideration of $298.3 million in cash. At the time of the acquisition, Telephonics Corporation was wholly-owned by Gritel, and as a result of the acquisition, became an indirect, wholly-owned subsidiary of the Company (collectively with ISC Farmingdale Corp., Telephonics). Telephonics is recognized globally as a leading provider of highly sophisticated military intelligence, surveillance and communications solutions that are deployed across a wide range of land, sea, and air applications.
On March 1, 2022, we announced that we are planning to open a new highly automated PCB manufacturing facility in Penang, Malaysia, with operations to commence in late fiscal 2023. During fiscal year 2022, we completed the pilings required for the building and laid the majority of the foundation. We have also received multiple deposits from customers with whom we have signed long-term agreements which we expect can eventually provide a business base for over 70% of the planned capacity in the new building. We expect our total capital expenditures for the facility to be approximately $130.0 million through 2025.
The coronavirus (COVID-19) pandemic initially caused disruption to our operations in China in January 2020. By March 2020, the situation escalated as the scope of the COVID-19 pandemic worsened outside of the Asia-Pacific region, with Europe and North America being affected by the pandemic. We expect continued impacts on our production, as well as on-going significant uncertainty relating to the actual and potential impacts of the COVID-19 pandemic, and we cannot reasonably estimate its duration or severity. For example, during the first quarter of the 2022 fiscal year, an outbreak in Mainland China forced temporary lockdown orders in several cities in which we operate, and, at other times throughout 2022 the Chinese government imposed lockdowns and other restrictions as part of its “zero-COVID” policy. Further, in North America, there was a surge in cases resulting from the Omicron variant from December 2021 through January 2022 which resulted in production inefficiencies caused by a combination of quarantine impacts and direct labor shortages on our overall production. The COVID-19 pandemic along with the conflict between Russia and Ukraine has created and continues to contribute to various global macroeconomic, customer demand, operational and supply chain risks and has contributed to high inflation, labor shortages in North America, and a potential recession, each of which could have a material and adverse impact on our business going forward. See Item 1A, Risk Factors, of Part I above for further information related to the COVID-19 pandemic, conflict between Russia and Ukraine, and macro-economic risks resulting, in part, from the pandemic.
We are monitoring the impacts the COVID-19 pandemic has had, and continues to have, on our supply chain, and our operations in China, and are collaborating with our third-party partners with the goal of mitigating, to the extent reasonably practicable, significant delays in delivery of our products. We continue to experience supply chain constraints and inflationary pressures. We have been actively taking measures intended to manage both supply chain constraints and higher raw materials costs, including, without limitation, through such measures as supplier diversification, on-going operational efficiency efforts and quotation adjustments to mitigate the impact on our business.
37
We also continue to see challenges in attracting and retaining labor in North America. We actively seek to demonstrate employees’ value to our business through a combination of financial and non-financial methods. However, a number of factors may continue to adversely affect the labor force available to us, including high employment levels, government regulations, and wage inflation. An overall labor shortage, lack of skilled labor, increased turnover or labor inflation could have a material adverse impact on our business.
FINANCIAL OVERVIEW
Results related to our Mobility business unit are reported as discontinued operations for 2020. See Note 9 of the Notes to Consolidated Financial Statements for further information. Unless otherwise noted, amounts and disclosures throughout our Management’s Discussion and Analysis of Financial Condition and Results of Operations relate to our continuing operations.
We use a 52/53 week fiscal calendar with the fourth quarter ending on the Monday nearest December 31. Fiscal year 2022 and 2020 were 52 weeks ended on January 2, 2023 and December 28, 2020, respectively. Fiscal year 2021 consisted of 53 weeks ended on January 3, 2022, with the additional week included in the fourth quarter. We estimate the additional week contributed approximately $42.2 million of additional revenue and approximately $2.5 million of additional operating income for the year ended January 3, 2022.
While our customers include both OEMs and EMS providers, we measure customers based on OEM companies, as they are the ultimate end customers. Sales to our five largest customers accounted for 33%, 30% and 29% of our net sales in fiscal years 2022, 2021 and 2020, respectively. We sell to OEMs both directly and indirectly through EMS providers.
The following table shows the percentage of our net sales attributable to each of the principal end markets we serve for the periods indicated:
|
|
For the Year Ended |
|
|
|||||||||||
End Markets (1) |
|
January 2, 2023 |
|
|
|
January 3, 2022 |
|
|
|
December 28, 2020 |
|
|
|||
Aerospace and Defense |
|
|
35 |
|
% |
|
|
33 |
|
% |
|
|
36 |
|
% |
Automotive |
|
|
17 |
|
|
|
|
18 |
|
|
|
|
15 |
|
|
Data Center Computing (2) |
|
|
15 |
|
|
|
|
14 |
|
|
|
|
12 |
|
|
Medical/Industrial/Instrumentation |
|
|
20 |
|
|
|
|
19 |
|
|
|
|
18 |
|
|
Networking |
|
|
13 |
|
|
|
|
15 |
|
|
|
|
18 |
|
|
Other (3) |
|
|
— |
|
|
|
|
1 |
|
|
|
|
1 |
|
|
Total |
|
|
100 |
|
% |
|
|
100 |
|
% |
|
|
100 |
|
% |
We derive revenues primarily from the sale of PCBs, engineered systems using customer-supplied engineering and design plans as well as our long-term contracts related to the design and manufacture of highly sophisticated intelligence, surveillance and communications solutions, RF and microwave/microelectronics components, assemblies, and subsystems. Orders for products generally correspond to the production schedules of our customers and are supported with firm purchase orders. Our customers have continuous control of the work in progress and finished goods throughout the PCB and engineered systems manufacturing process, as these are built to customer specifications with no alternative use, and there is an enforceable right of payment for work performed to date. As a result, we recognize revenue progressively over time based on the extent of progress towards completion of the performance obligation. We recognize revenue based on a cost method as it best depicts the transfer of control to the customer which takes place as we incur costs. Revenues are recorded proportionally as costs are incurred.
We also manufacture certain components, assemblies, subsystems, and completed systems which service our RF and Specialty Components (RF&S Components) customers and certain aerospace and defense customers. We recognize revenue at a point in time upon transfer of control of the products to our customer. Point in time recognition was determined as our customers do not simultaneously receive or consume the benefits provided by our performance and the asset being manufactured has alternative uses to us.
Net sales consist of gross sales less an allowance for returns, which typically have been approximately 2% of gross sales. We provide our customers a limited right of return for defective PCBs including components, subsystems, and assemblies. We record an estimate for sales returns and allowances at the time of sale based on historical results and anticipated returns.
Cost of goods sold consists of materials, labor, outside services, and overhead expenses incurred in the manufacture and testing of our products. Shipping and handling fees and related freight costs and supplies associated with shipping products are also included as a component of cost of goods sold. Many factors affect our gross margin, including capacity utilization, product mix, production volume, supply chain issues, and yield.
Selling and marketing expenses consist primarily of salaries, labor related benefits, and commissions paid to our internal sales force, independent sales representatives, and our sales support staff, as well as costs associated with marketing materials and trade shows.
38
General and administrative costs primarily include the salaries for executive, finance, accounting, information technology, and human resources personnel, as well as expenses for accounting and legal assistance, incentive compensation expense, and gains or losses on the sale or disposal of property, plant and equipment.
Research and development expenses consist primarily of salaries and labor related benefits paid to our research and development staff, as well as material costs.
CRITICAL ACCOUNTING POLICIES AND ESTIMATES
Our consolidated financial statements included in this report have been prepared in accordance with accounting principles generally accepted in the United States of America (U.S. GAAP). The preparation of these financial statements requires management to make estimates and assumptions that affect the reported amounts of assets, liabilities, net sales and expenses, and related disclosure of contingent assets and liabilities.
A critical accounting policy is defined as one that is both material to the presentation of our consolidated financial statements and requires us to make judgments that could have a material effect on our financial condition or results of operations. These policies require us to make assumptions about matters that are highly uncertain at the time of the estimate. Critical accounting estimates refers to those estimates made in accordance with U.S. GAAP that have had or are reasonably likely to have a material impact on the amounts reported in the consolidated financial statements and the related notes due to the significant level of uncertainty involved in developing the estimate. Different estimates we could reasonably have used, or changes in the estimates that are reasonably likely to occur, could have a material effect on our financial condition or results of operations.
We base our estimates on historical experience and on various other assumptions that we believe to be reasonable under the circumstances, the results of which form the basis for making judgments about the carrying values of assets and liabilities that are not readily apparent from other sources. Management has discussed the development, selection and disclosure of these estimates with the audit committee of our board of directors. Actual results may differ from these estimates under different assumptions or conditions.
We believe the following critical accounting policies and estimates reflect the more significant judgments and estimates used by us in preparing our consolidated financial statements:
Revenue Recognition
Revenue is recognized when control of the promised goods or services is transferred to customers, in an amount that reflects the consideration to which we expect to be entitled in exchange for those goods or services. We apply a five-step approach in determining the amount and timing of revenue to be recognized: (1) identifying the contract with a customer; (2) identifying the performance obligations in the contract; (3) determining the transaction price; (4) allocating the transaction price to the performance obligations in the contract; and (5) recognizing revenue when the corresponding performance obligation is satisfied.
For PCBs and engineered systems, including pursuant to long-term contracts related to the manufacture of highly sophisticated intelligence, surveillance and communications solutions, components, assemblies and subsystems, orders for products generally correspond to the production schedules of customers and are supported with firm purchase orders. Customers have continuous control of the work in progress and finished goods throughout the PCB and engineered systems manufacturing process, as these are built to customer specifications with no alternative use, and there is an enforceable right to payment for work performed to date. As a result, we recognize revenue progressively over time based on the extent of progress towards completion of the performance obligation. Revenue recognized is based on a cost method as it best depicts the transfer of control to the customer which takes place as we incur costs. Revenues are recorded proportionally as costs are incurred.
For revenue recorded on an over time basis, we apply a gross margin estimate to inventory in process of being manufactured for customers to determine how much of a contract asset or contract liability should be recorded at period end. Contract assets totaled $335.8 million and $324.9 million for the years ended January 2, 2023 and January 3, 2022, respectively. $25.0 million of that increase in contract assets is due to the inclusion of Telephonics’ operations commencing on June 27, 2022 and the rest of the increase is primarily due to timing of progress on customer work orders at year-end. In addition, as a result of Telephonics’ operations in the period commencing on June 27, 2022, $7.1 million of contract assets are expected to be collected after one year and included as a component of deposits and other non-current assets on the consolidated balance sheets as of January 2, 2023. We use historical information to estimate the gross margin associated with performance obligations that are satisfied over time. We reevaluate our estimate of gross margins on a quarterly basis. Based on the review of gross margins, we update our estimate to the model as necessary. If our estimates of gross margins are inaccurate, we may recognize too much or too little revenue in a period. While experience has shown that trends in gross margins are not volatile, changes in pricing or cost efficiencies could create significant fluctuations. An increase or decrease of 200 basis points in gross margin estimates would have increased or decreased our contract assets by $3.7 million and $2.7 million, respectively, and decreased or increased our contract liabilities by $4.1 million and $4.8 million, respectively.
In addition, we manufacture components, assemblies, subsystems, and completed systems which service our RF&S Components and certain aerospace and defense customers. We recognize revenue at a point in time upon transfer of control of the products to the customer. Point in time recognition was determined as our customer does not simultaneously receive or consume the benefits provided by our performance and the asset being manufactured has alternative uses to us.
39
Goodwill and Intangible Assets
We have significant goodwill and definite-lived intangibles. We review these assets for impairment whenever events or changes in circumstances indicate that the carrying amount of such assets may not be recoverable. In addition, we perform an impairment test related to goodwill at least annually. As necessary, we make judgments regarding future cash flow forecasts in the assessment of impairment.
Goodwill is allocated to our reporting units, which are our operating segments or one level below our operating segments (the component level). Reporting units are determined by the discrete financial information available for the component and whether it is regularly reviewed by segment management. Components are aggregated into a single reporting unit if they share similar economic characteristics. The Company evaluates its goodwill on an annual basis in the fourth quarter or more frequently if it believes indicators of impairment exist. We assess qualitative factors to determine whether it is more likely than not that the fair value of a reporting unit is less than its carrying amount or perform a quantitative impairment test. When tested quantitatively, we compare the fair value of the applicable reporting unit with its carrying value. We estimate the fair values of our reporting units using a combination of the discounted cash flow (DCF) and market approach. If the carrying amount of a reporting unit exceeds the reporting unit’s fair value, the amount by which the carrying value exceeds the fair value is recognized as an impairment loss.
We have two reportable segments: PCB and RF&S Components. Goodwill is attributable to both of our PCB and RF&S Components reportable segments.
In the fourth quarter of 2022, we performed our annual impairment test quantitatively and concluded that goodwill was not impaired. In performing the impairment test, we determined the fair value of our reporting units by using discounted cash flow (DCF) and market analyses. Determining fair value requires us to make judgments about appropriate discount rates, terminal value growth rates and the amount and timing of expected future cash flows. The cash flows employed in the DCF analysis for each reporting unit are based on the reporting unit's budget, long-term business plan, and recent operating performance. Discount rate assumptions are based on an assessment of the risk inherent in the future cash flows of the respective reporting unit and market conditions. Under the market approach, we use revenue and earnings multiples based on comparable industry multiples to estimate the fair value of the reporting units. For the annual impairment test, the fair value of our PCB and RF&S Components reportable segments exceeded their respective carrying values by 21% and 29%, respectively. Significant assumptions used in the DCF included terminal value growth rates and discount rates that ranged from 3% to 12%. An increase in the discount rate and decrease in the long-term growth rates of 0.5% would result in the fair value of the reporting units exceeding their respective carrying values by 17% to 24%. Given the inherent uncertainty in determining the assumptions underlying a DCF and market analysis, actual results may differ from those used in our valuations. In assessing the reasonableness of the determined fair values, we also reconciled the aggregate determined fair value of the Company to the Company's market capitalization, which, at the date of our annual impairment test, implied a 31% control premium on a normalized basis.
Management will continue to monitor the reporting units for changes in the business environment that could impact recoverability. The recoverability of goodwill is dependent upon the continued growth of cash flows from our business activities. If the economy or business environment falter and we are unable to achieve our assumed revenue growth rates or profit margin percentages, our projections used would need to be re-measured, which could impact the carrying value of our goodwill in one or more of our reporting units.
We also assess definite-lived intangibles for potential impairment given similar impairment indicators. When indicators of impairment exist related to our definite-lived intangible assets, we use an estimate of the undiscounted cash flows in measuring whether the carrying amount of the assets is recoverable. If the sum of the undiscounted cash flows is less than the carrying amount of the net assets, impairment is measured based on the difference between the net asset’s carrying value and estimated fair value. Fair value is determined through various valuation techniques, including cost-based, market and income approaches as considered necessary, which involve judgments related to future cash flows and the application of the appropriate valuation model.
Business Combinations
The application of acquisition accounting to a business acquisition requires that we identify the individual assets acquired and liabilities assumed and estimate the fair value of each. The fair value of assets acquired and liabilities assumed in a business acquisition are recognized at the acquisition date, with the purchase price exceeding the fair values being recognized as goodwill. Determining fair value of identifiable assets, particularly intangibles, liabilities acquired and contingent obligations assumed requires management to make estimates. In certain circumstances, the allocations of the purchase price are based upon preliminary estimates and assumptions and subject to revision when we receive final information, including appraisals and other analysis. Accordingly, the measurement period for such purchase price allocations will end when the information, or the facts and circumstances, becomes available, but will not exceed twelve months. We will recognize measurement-period adjustments during the period of resolution, including the effect on earnings of any amounts that would have been recorded in previous periods if the accounting had been completed at the acquisition date.
Goodwill and intangible assets often represent a significant portion of the assets acquired in a business combination. We recognize the fair value of an acquired intangible apart from goodwill whenever the intangible arises from contractual or other legal rights, or when it can be separated or divided from the acquired entity and sold, transferred, licensed, rented or exchanged, either individually or in combination with a related contract, asset or liability. Intangible assets consist primarily of customer relationships and trade names acquired in business combinations. As of January 2, 2023, we have not finalized the determination of fair values allocated to identifiable
40
intangible assets. We used publicly available benchmarking information, as well as a variety of other assumptions, including market participant assumptions to determine the preliminary values assigned to intangible assets.
RESULTS OF OPERATIONS
We operate on a 52 or 53 week year ending on the Monday nearest December 31. Fiscal year 2022 and 2020 were 52 weeks ended on January 2, 2023 and December 28, 2020, respectively. Fiscal year 2021 consisted of 53 weeks ended on January 3, 2022, with the additional week included in the fourth quarter. We estimate the additional week contributed approximately $42.2 million of additional revenue and approximately $2.5 million of additional operating income for the year ended January 3, 2022.
The following table sets forth the relationship of various items to net sales in our consolidated statements of operations:
|
|
For the Year Ended |
|
|
|||||||||||
|
|
January 2, 2023 |
|
|
|
January 3, 2022 |
|
|
|
December 28, 2020 |
|
|
|||
Net sales |
|
|
100.0 |
|
% |
|
|
100.0 |
|
% |
|
|
100.0 |
|
% |
Cost of goods sold |
|
|
81.6 |
|
|
|
|
83.5 |
|
|
|
|
83.0 |
|
|
Gross profit |
|
|
18.4 |
|
|
|
|
16.5 |
|
|
|
|
17.0 |
|
|
Operating expenses: |
|
|
|
|
|
|
|
|
|
|
|
|
|||
Selling and marketing |
|
|
3.0 |
|
|
|
|
2.8 |
|
|
|
|
3.0 |
|
|
General and administrative |
|
|
6.4 |
|
|
|
|
5.5 |
|
|
|
|
5.8 |
|
|
Research and development |
|
|
1.0 |
|
|
|
|
0.8 |
|
|
|
|
1.0 |
|
|
Amortization of definite-lived intangibles |
|
|
1.5 |
|
|
|
|
1.6 |
|
|
|
|
1.8 |
|
|
Gain on sale of SH E-MS property |
|
|
(2.1 |
) |
|
|
|
— |
|
|
|
|
— |
|
|
Restructuring charges |
|
|
0.2 |
|
|
|
|
0.2 |
|
|
|
|
0.8 |
|
|
Impairment of goodwill |
|
|
— |
|
|
|
|
— |
|
|
|
|
3.3 |
|
|
Total operating expenses |
|
|
10.0 |
|
|
|
|
10.9 |
|
|
|
|
15.7 |
|
|
Operating income |
|
|
8.4 |
|
|
|
|
5.6 |
|
|
|
|
1.3 |
|
|
Other (expense) income: |
|
|
|
|
|
|
|
|
|
|
|
|
|||
Interest expense |
|
|
(1.8 |
) |
|
|
|
(2.0 |
) |
|
|
|
(3.5 |
) |
|
Loss on extinguishment of debt |
|
|
— |
|
|
|
|
(0.7 |
) |
|
|
|
— |
|
|
Other, net |
|
|
0.7 |
|
|
|
|
0.2 |
|
|
|
|
— |
|
|
Total other expense, net |
|
|
(1.1 |
) |
|
|
|
(2.5 |
) |
|
|
|
(3.5 |
) |
|
Income (loss) from continuing operations before income taxes |
|
|
7.3 |
|
|
|
|
3.1 |
|
|
|
|
(2.2 |
) |
|
Income tax (provision) benefit |
|
|
(3.5 |
) |
|
|
|
(0.7 |
) |
|
|
|
1.4 |
|
|
Net income (loss) from continuing operations |
|
|
3.8 |
|
% |
|
|
2.4 |
|
% |
|
|
(0.8 |
) |
% |
The Telephonics acquisition occurred on June 27, 2022. Accordingly, our fiscal year 2022 only includes Telephonics’ 2022 results of operations since the acquisition date. As of the fourth quarter of 2022, we completed our integration of Telephonics and reassessed our reportable segments, which resulted in the inclusion of Telephonics into our PCB reportable segment.
Net Sales
Total net sales increased $246.3 million, or 11.0%, to $2,495.0 million for the year ended January 2, 2023 from $2,248.7 million for the year ended January 3, 2022. Net sales for the PCB reportable segment increased $251.0 million, or 11.5%, to $2,437.9 million for the year ended January 2, 2023 from $2,186.9 million for the year ended January 3, 2022. This increase in PCB net sales was primarily due to the acquisition of Telephonics in June 2022, which accounted for $125.9 million in net sales for the year ended January 2, 2023 since the date of acquisition, as well as increased demand in our Medical/Industrial/Instrumentation, Data Center Computing, and Automotive end markets. The increase in PCB net sales also benefited from a 15.4% increase in the average price per square foot driven mainly by better product mix, higher pricing and premium revenue, partially offset by a 5.6% decrease in the volume of PCB shipments as compared to the year ended January 3, 2022. Net sales for the RF&S Components reportable segment decreased $1.5 million, or 2.5%, to $57.1 million for the year end January 2, 2023 from $58.6 million for the year ended January 3, 2022. The decrease in RF&S Components net sales was primarily due to lower demand.
Total net sales increased $143.4 million, or 6.8%, to $2,248.7 million for the year ended January 3, 2022 from $2,105.3 million for the year ended December 28, 2020. This increase primarily resulted from an increase in net sales for the PCB reportable segment of $206.0 million, or 10.4%, to $2,186.9 million for the year ended January 3, 2022 from $1,980.9 million for the year ended December 28, 2020. The increase in PCB net sales was primarily due to increased demand in our Automotive, Data Center Computing, and Medical/Industrial/Instrumentation end markets, partially offset by lower demand in our Aerospace and Defense and Networking end markets. Also driving the increase in PCB net sales was an increase in the volume of PCB shipments of 24.3% as compared to the year ended December 28, 2020. The benefit of this volume increase, however, was partially offset by an 11.9% decrease in the average price per square foot. Also contributing to the increase in total net sales was an increase in net sales for the RF&S Components reportable
41
segment of $13.9 million, or 31.2%, to $58.6 million for the year ended January 3, 2022 from $44.7 million for the year ended December 28, 2020. The increase in RF&S Components net sales was primarily due to increased demand in our Networking end market. Partially offsetting the PCB and RF&S Components increases was a $76.5 million reduction in net sales due to the closure of the two plants from our E-M Solutions segment.
For information regarding net sales by country, see Note 17 of the Notes to Consolidated Financial Statements.
Gross Margin
Overall gross margin increased to 18.4% for the year ended January 2, 2023 from 16.5% for the year ended January 3, 2022. The increase in overall gross margin was due to the increase in gross margin for the PCB reportable segment to 18.2% for the year ended January 2, 2023, from 16.3% for the year ended January 3, 2022. This increase was primarily due to better product mix, higher pricing and premium revenue, partially offset by higher labor costs, particularly in North America as we raised wages in the first quarter of 2022 to be more competitive. Gross margin for the RF&S Components reportable segment increased to 62.3% for the year ended January 2, 2023, from 52.6% for the year ended January 3, 2022, primarily due to favorable product mix.
Overall gross margin decreased to 16.5% for the year ended January 3, 2022 from 17.0% for the year ended December 28, 2020. The decrease in overall gross margin was due to the decrease in gross margin for the PCB reportable segment to 16.3% for the year ended January 3, 2022, from 18.1% for the year ended December 28, 2020, primarily due to higher raw material costs resulting primarily from increased commodity prices, principally copper, unfavorable foreign exchange rates which increased our cost of operations, and production and labor inefficiencies. We were able to mitigate most of these cost increases through higher revenue and production and spending efficiencies including savings realized from the closure of two of our E-M Solutions factories at the end of 2020. Gross margin for the RF&S Components reportable segment increased to 52.6% for the year ended January 3, 2022, from 45.9% for the year ended December 28, 2020, primarily due to higher sales.
Capacity utilization is a key driver for us, which is measured by the actual production as a percentage of maximum capacity. This measure is particularly important in our high-volume PCB facilities in Asia, as a significant portion of our operating costs are fixed in nature. Capacity utilization for the year ended January 2, 2023 in our Asia and North America PCB facilities was 81% and 43%, respectively, compared to 86% and 51%, respectively, for the year ended January 3, 2022. The decrease in capacity utilization in our Asia PCB facilities was caused by a decline in production volumes while the decrease in our North America PCB facilities was due to the additional plating capacity added in the fiscal year ended January 2, 2023, and direct labor shortages throughout the year in certain regions.
Selling and Marketing Expenses
Selling and marketing expenses increased $12.2 million to $75.2 million for the year ended January 2, 2023 from $63.0 million for the year ended January 3, 2022. As a percentage of net sales, selling and marketing expenses were 3.0% for the year ended January 2, 2023 as compared to 2.8% for the year ended January 3, 2022. The increase in selling and marketing expense was primarily due to $4.8 million of selling and marketing expenses incurred by Telephonics post acquisition and increases in labor costs and commission expense company wide.
Selling and marketing expenses decreased $0.9 million to $63.0 million for the year ended January 3, 2022 from $63.9 million for the year ended December 28, 2020. As a percentage of net sales, selling and marketing expenses were 2.8% for the year ended January 3, 2022 as compared to 3.0% for the year ended December 28, 2020. The decrease in selling and marketing expenses in 2021 was primarily due to a decrease in commission expense.
General and Administrative Expenses
General and administrative expenses increased $33.3 million to $158.2 million, or 6.4% of net sales, for the year ended January 2, 2023 from $124.9 million, or 5.5% of net sales, for the year ended January 3, 2022. The increase in expense was primarily due to $11.5 million of one-time costs incurred in connection with the acquisition of Telephonics on June 27, 2022 and $6.6 million of general and administrative expenses incurred by Telephonics post acquisition. In addition, there were increases in incentive compensation, labor costs, and bad debt. These increases were partially offset by gains on the sale of assets.
General and administrative expenses increased $2.4 million to $124.9 million, or 5.5% of net sales, for the year ended January 3, 2022 from $122.5 million, or 5.8% of net sales, for the year ended December 28, 2020. This increase was primarily due to an increase in labor costs and other general and administrative spending, including increased consulting and legal costs.
Gain on sale of SH E-MS Property
On December 22, 2022, land, building, and relevant ancillary assets related to our former SH E-MS manufacturing facility was expropriated by the Chinese government for a compensation fee of RMB 477.6 million ($69.2 million as of January 2, 2023) and we recorded a gain on the sale of $51.8 million. We will receive the proceeds as follows: 50% before March 30, 2023, 40% before June 30, 2023, and 10% before December 30, 2023.
42
Impairment of Goodwill
For the year ended December 28, 2020, we recorded a goodwill impairment charge of $69.2 million. See Note 5 of the Notes to Consolidated Financial Statements for further information.
Other Expense
Other expense, net decreased $28.4 million to $27.5 million for the year ended January 2, 2023 from $55.9 million for the year ended January 3, 2022. The decrease in other expense, net was primarily due to:
• an increase in other income of $17.8 million related to the weakening of the Chinese RMB, which we utilize at our China facilities for employee-related expenses, RMB denominated purchases, and other costs of running our operations in China,
• the absence of $15.2 million of loss on extinguishment of debt,
• partially offset by the decrease in other income of $4.1 million related to the change in fair value of warrant liabilities.
Other expense, net decreased $18.4 million to $55.9 million for the year ended January 3, 2022 from $74.4 million for the year ended December 28, 2020. The decrease in other expense, net was primarily due to:
• a decrease in interest expense of $27.7 million due to overall lower levels of debt outstanding,
• an increase in other income of $4.2 million for the year ended January 3, 2022 related to the change in fair value of warrant liabilities,
• partially offset by $15.2 million of loss on extinguishment of debt.
Income Taxes
Income tax expense increased $72.7 million to $88.3 million for the year ended January 2, 2023 from $15.6 million for the year ended January 3, 2022. The change in income tax from fiscal year 2021 to fiscal year 2022 was primarily due to an increase in the valuation allowance set up against U.S. deferred tax assets, an increase in pre-tax book income, and a gain on the sale of certain assets of our Shanghai E-MS subsidiary.
Our effective tax rate is primarily impacted by tax rates in China and Hong Kong, the US federal income tax rate, apportioned state income tax rates, the generation of credits and deductions available to us, as well as changes in valuation allowances, certain non-deductible items, global intangible low taxed income, and the establishment of a deferred tax liability related to unremitted foreign earnings.
The provision for income taxes increased $45.5 million to an income tax expense of $15.6 million for the year ended January 3, 2022 from an income tax benefit of $29.9 million for the year ended December 28, 2020. The change in income tax from a benefit to an expense in 2021 was primarily due to an increase in pre-tax book income, the absence of beneficial tax examination settlement in 2020, and an increase in the valuation allowance set up against certain state tax credits. The increase in tax expense was partially offset by a tax benefit related to the retroactive approval of the Company’s renewal application for High and New Tax Enterprise status for two of the Company’s manufacturing subsidiaries in China (including the impact on the respective subsidiaries’ deferred tax amounts).
Liquidity and Capital Resources
Our principal sources of liquidity have been cash provided by operations, the issuance of debt, and borrowings under our revolving credit facility. Our principal uses of cash have been to finance capital expenditures, finance acquisitions, fund working capital requirements, to repay debt obligations, and to repurchase common stock. We anticipate that financing capital expenditures, financing acquisitions, funding working capital requirements, servicing debt, and repurchasing common stock will be the principal demands on our cash in the future.
Cash flow provided by operating activities from continuing operations during the year ended January 2, 2023 was $272.9 million as compared to $176.6 million in the same period in fiscal year 2021. The increase in cash flow was primarily due to an increase in net income of $40.2 million from continuing operations and an overall decreased investment in working capital.
Net cash used in investing activities for continuing operations was approximately $395.5 million for the year ended January 2, 2023, primarily reflecting $298.3 million to fund the acquisition of Telephonics, $102.9 million for purchases of property, plant and equipment and other assets, less $6.0 million for proceeds from sale of property, plant and equipment and other assets. Net cash used in investing activities for continuing operations was approximately $84.1 million for the year ended January 3, 2022, primarily reflecting $82.0 million for purchases of property, plant and equipment and other assets, $3.2 million investment in an unconsolidated joint venture, less $1.4 million for proceeds from sale of property, plant and equipment and other assets.
Net cash used in financing activities for continuing operations during the year ended January 2, 2023 was $11.3 million, primarily reflecting repurchases of common stock of $35.4 million, cash used to settle warrants of $0.9 million, less customer deposits of $25.0 million. Net cash used in financing activities for continuing operations during the year ended January 3, 2022 was $7.2 million, primarily reflecting repayment of long-term debt of $425.8 million, repurchases of common stock of $64.7 million, capital equipment financing
43
of $7.5 million, payment of debt issuance costs of $6.0 million, and cash used to settle warrants of $3.2 million, less the proceeds from long-term debt borrowing of $500.0 million.
We received pre-tax proceeds from the sale of the Mobility business unit, net of cash disposed, of $507.5 million during the year ended December 28, 2020, which have been presented in the consolidated statements of cash flows within net cash provided by investing activities from discontinued operations.
As of January 2, 2023, we had cash and cash equivalents of approximately $402.7 million, of which approximately $161.7 million was held by our foreign subsidiaries, primarily in China. Should we choose to remit cash to the United States from our foreign locations, we may incur tax obligations which would reduce the amount of cash ultimately available to the United States. However, we believe there would be no material tax consequences not previously accrued for the repatriation of this cash.
Our 2023 capital expenditure plan is expected to be in the range of $140.0 million to $160.0 million.
Share Repurchases
On February 3, 2021, our board of directors authorized a share repurchase program allowing us to repurchase up to $100.0 million of our common stock. During 2022, we repurchased a total of 2.7 million shares of our common stock for $35.4 million (including commissions). As of January 2, 2023, there are no remaining amounts authorized for repurchase. From its commencement, we repurchased a total of 7.5 million shares of our common stock for $100.0 million under the share repurchase program.
Long-term Debt and Letters of Credit
As of January 2, 2023, we had $929.4 million of outstanding debt, net of discount and debt issuance costs, composed of $495.2 million of Senior Notes due March 2029, $404.2 million of a Term Loan due September 2024, and $30.0 million under the Asia Asset-Based Lending Credit Agreement (Asia ABL). Subsequent to January 2, 2023, we made an optional debt principal prepayment of $50.0 million on our Term Loan Facility.
Pursuant to the terms of the Term Loan Facility and Senior Notes due 2029, we are subject to certain affirmative and negative covenants, including limitations on indebtedness, corporate transactions, investments, dispositions, and share payments. Under the occurrence of certain events, under the U.S. Asset-Based Lending Credit Agreement (U.S. ABL) and Asia ABL (collectively, the ABL Revolving Loans), we are also subject to various financial covenants, including leverage and fixed charge coverage ratios. As of January 2, 2023, we were in compliance with the covenants under the Term Loan Facility, Senior Notes due 2029 and ABL Revolving Loans.
Based on our current level of operations, we believe that cash generated from operations, cash on hand and cash from the issuance of term and revolving debt will be adequate to meet our currently anticipated capital expenditure, debt service, and working capital needs for the next twelve months. Additional information regarding our indebtedness, including information about the credit available under our debt facilities, interest rates and other key terms of our outstanding indebtedness, is included in Note 7 of the Notes to Consolidated Financial Statements included in this Annual Report on Form 10-K.
Contractual Obligations and Commitments
As part of our ongoing operations, we enter into contractual arrangements that obligate us to make future cash payments. These obligations impact our liquidity and capital resource needs. Our estimated future obligations consist of long-term debt obligations, interest on debt obligations, derivative liabilities, purchase obligations, and leases as of January 2, 2023.
A summary of our long-term debt obligations as of January 2, 2023 is included in Note 7 of the Notes to Consolidated Financial Statements included in this Annual Report on Form 10-K.
Our aggregate interest on debt obligations as of January 2, 2023 amounted to $174.1 million, which are expected to be settled as follows: $46.6 million within 1 year, $59.1 million within 1-3 years, $40.0 million within 4-5 years, and $28.4 million after 5 years. For debt obligations based on variable rates, interest rates used are as of January 2, 2023.
Our derivative liabilities of $1.6 million as of January 2, 2023 are expected to be settled within one year.
We also have outstanding firm purchase orders with certain suppliers for the purchase of material and inventory. Orders for standard, or catalog, items can typically be canceled with little or no financial penalty. Our policy regarding non-standard or customized items dictates that such items are only ordered specifically for customers who have contractually assumed liability for the inventory, although exceptions are made to this policy in certain situations. In addition, a substantial portion of catalog items covered by our purchase orders are procured for specific customers based on their purchase orders or a forecast under which the customer has contractually assumed liability for such material. Accordingly, our liability from purchase obligations under these purchase orders is not expected to be significant.
A summary of our lease obligations as of January 2, 2023 is included in Note 2 of the Notes to Consolidated Financial Statements included in this Annual Report on Form 10-K.
44
Offset Agreements
Following the acquisition of Telephonics on June 27, 2022, we have and may continue to enter into industrial cooperation agreements, sometimes referred to as offset agreements, as a condition to obtaining orders for our products and services from customers in foreign countries. These agreements are intended to promote investment in the applicable country, and our obligations under these agreements may be satisfied through activities that do not require us to use cash, including transferring technology or providing manufacturing and other consulting support. The obligations under these agreements may also be satisfied through the use of cash for such activities as purchasing supplies from in-country vendors, setting up support centers, research and development investments, acquisitions, and building or leasing facilities for in-country operations, if applicable. The amount of the offset requirement is determined by contract value awarded and negotiated percentages with customers. As of January 2, 2023, we had outstanding offset agreements of approximately $20.2 million, some of which extend through 2028. Offset programs usually extend over several years and in some cases provide for penalties in the event we fail to perform in accordance with contract requirements. Historically, we have not paid any such penalties, and as of January 2, 2023, no such penalties have been paid.
Seasonality
We tend to experience modest seasonal softness in the first and third quarters due to holidays and vacation periods in China and North America, respectively, which limit production leading to stronger revenue levels in the second and fourth quarters.
Recently Issued Accounting Standards
For a description of recently adopted and issued accounting standards, including the respective dates of adoption and expected effects on our results of operations and financial condition, see Note 1 of the Notes to Consolidated Financial Statements.
ITEM 7A. QUANTITATIVE AND QUALITATIVE DISCLOSURES ABOUT MARKET RISK
In the normal course of business operations, we are exposed to risks associated with fluctuations in interest rates, foreign currency exchange rates, and commodity prices. We address these risks through controlled risk management that includes the use of derivative financial instruments to economically hedge or reduce these exposures. We do not enter into derivative financial instruments for trading or speculative purposes.
We have not experienced any losses to date on any derivative financial instruments due to counterparty credit risk.
To ensure the adequacy and effectiveness of our foreign exchange and commodity price hedge positions, we continually monitor our foreign exchange forward positions and commodity hedge price positions, both on a stand-alone basis and in conjunction with their underlying foreign currency and commodity price exposures, from an accounting and economic perspective. However, given the inherent limitations of forecasting and the anticipatory nature of the exposures intended to be hedged, we cannot be assured that such programs will offset more than a portion of the adverse financial impact resulting from unfavorable movements in either foreign exchange rates or commodity prices. In addition, the timing of the accounting for recognition of gains and losses related to mark-to-market instruments for any given period may not coincide with the timing of gains and losses related to the underlying economic exposures and, therefore, may adversely affect our consolidated operating results and financial position.
Interest Rate Risks
Our business is exposed to risk resulting from fluctuations in interest rates. Our interest expense is more sensitive to fluctuations in the general level of LIBOR interest rates than to changes in rates in other markets. Increases in interest rates would increase interest expense relating to our outstanding variable rate borrowings and increase the cost of debt. Fluctuations in interest rates can also lead to significant fluctuations in the fair value of our debt obligations.
On May 15, 2018, we entered into a four-year pay-fixed, receive floating (1-month LIBOR), interest rate swap arrangement with a notional amount of $400.0 million for the period beginning June 1, 2018 and ended on June 1, 2022. During the term of the interest rate swap, we paid a fixed rate of 2.84% against the first interest payments of a portion of our LIBOR-based debt and received floating 1-month LIBOR during the swap period. At inception, we designated the interest rate swap as a cash flow hedge and the fair value of the interest rate swap was zero. No ineffectiveness was recognized for the year ended January 2, 2023. During the year ended January 2, 2023, the interest rate swap increased interest expense by $4.1 million. Since June 1, 2022, our $400.0 million LIBOR-based variable debt has been more sensitive to fluctuations in interest rates due to the expiration of the interest rate swap arrangement. We currently do not expect to enter into a new interest rate swap arrangement.
See Liquidity and Capital Resources in Item 7, Management’s Discussion and Analysis of Financial Condition and Results of Operations and Note 7 of the Notes to Consolidated Financial Statements included in this Annual Report on Form 10-K for further discussion of our financing facilities and capital structure. As of January 2, 2023, approximately 53.4% of our debt was based on fixed rates. Based on our borrowings as of January 2, 2023, an assumed 100 basis point change in variable rates would cause our annual interest cost to change by $4.4 million.
On July 27, 2017, the Financial Conduct Authority (FCA) announced the desire to phase out the use of LIBOR by the end of 2021. More recently, on March 5, 2021, the FCA announced that all LIBOR settings will either cease to be provided by any administrator or
45
no longer be representative. Specifically, this occurred immediately after December 31, 2021, in the case of all Sterling, Euro (EUR), Swiss franc and Japanese yen settings, and the 1-week, and 2-month U.S. dollar settings; and immediately after June 30, 2023, in the case of the remaining U.S. dollar settings. However, U.S. banking regulators have made it clear that U.S.-dollar LIBOR originations should end by no later than December 31, 2021, and that new LIBOR originations prior to that date must provide for an alternative reference rate in existing contracts. On July 29, 2021, the Alternative Reference Rates Committee (ARRC) announced that it is now formally recommending CME Group’s forward-looking Secured Overnight Financing Rate term rates (SOFR Term Rates). In accordance with recommendations from ARRC, U.S.-dollar LIBOR is expected to be replaced with the Secured Overnight Financing Rate (SOFR) and SOFR Term Rates, a new index calculated by reference to short-term repurchase agreements for U.S. Treasury securities. Further, the International Swaps and Derivatives Association, Inc. recently announced fallback language for LIBOR-referencing derivatives contracts that also provides for SOFR as the primary replacement rate in the event of a LIBOR cessation.
The market transition from LIBOR to SOFR is expected to be complicated, including the development of term SOFR rates and credit adjustments to accommodate differences between LIBOR and SOFR. During the transition period, LIBOR may exhibit increased volatility or become less representative, and the overnight Treasury repurchase market underlying SOFR may also experience disruptions from time to time, which may result in unexpected fluctuations in SOFR.
Foreign Currency Rate Risks
In the normal course of business, we are exposed to risks associated with fluctuations in foreign currency exchange rates related to transactions that are denominated in currencies other than our functional currencies, as well as the effects of translating amounts denominated in a foreign currency to the U.S. Dollar as a normal part of our financial reporting process. Most of our foreign operations have the U.S. Dollar as their functional currency, however, one of our China facilities utilize the Renminbi (RMB), which results in recognition of translation adjustments included as a component of other comprehensive income (loss). Our foreign exchange exposure results primarily from employee-related and other costs of running our operations in foreign countries, foreign currency denominated purchases and translation of balance sheet accounts denominated in foreign currencies. We do not engage in hedging to manage this foreign currency risk, except for certain equipment purchases. However, we may consider the use of derivatives in the future. Our primary foreign exchange exposure is to the RMB. In general, our Chinese customers pay us in RMB, which partially mitigates this foreign currency exchange risk.
Our foreign subsidiaries may at times enter into forward exchange contracts to manage foreign currency risks in relation to certain purchases of machinery denominated in foreign currencies other than our functional currencies. As of January 2, 2023, the notional amount of the foreign exchange contracts was approximately $1.6 million (EUR 1.4 million). There were no foreign exchange contracts as of January 3, 2022. We designated certain of these foreign exchange contracts as cash flow hedges.
Commodity Price Risks
We are exposed to certain commodity risks associated with prices for various raw materials. In particular, we have been experiencing volatility in prices and increasing lead times of copper clad laminates (CCLs), a key raw material for the manufacture of PCBs. This may negatively affect our profitability. CCLs are made from epoxy resin, glass cloth and copper foil, all of which are seeing limited supply and volatility in prices. We only buy a small amount of copper directly. However, copper is a major driver of laminate cost. We are hedging copper as a proxy for hedging laminate. As of January 2, 2023, we had commodity contracts with a notional quantity of 700 metric tonnes each for the periods: (i) beginning October 4, 2022 and ending on January 3, 2023, (ii) beginning January 1, 2023 and ending on March 31, 2023, (iii) beginning April 1, 2023 and ending on June 30, 2023, (iv) beginning July 1, 2023 and ending on September 30, 2023, and (v) beginning October 1, 2023 and ending on December 31, 2023. As of January 2, 2023, the fair value of the commodity contracts was recorded as a liability in the amount of $1.5 million and included as a component of other current liabilities. We will continue to evaluate our commodity risks and may utilize commodity forward purchase contracts more frequently in the future.
Debt Instruments
The table below presents the fiscal calendar maturities of our debt instruments through 2027 and thereafter as of January 2, 2023:
|
As of January 2, 2023 |
|||||||||||||||||||||||||||||||||
|
|
2023 |
|
|
2024 |
|
|
2025 |
|
|
2026 |
|
|
2027 |
|
|
Thereafter |
|
|
Total |
|
|
Fair |
|
|
Weighted |
||||||||
|
|
(In thousands) |
|
|
|
|||||||||||||||||||||||||||||
US$ Variable Rate |
|
$ |
50,000 |
|
|
$ |
385,879 |
|
|
$ |
— |
|
|
$ |
— |
|
|
$ |
— |
|
|
$ |
— |
|
|
$ |
435,879 |
|
|
$ |
435,628 |
|
|
6.82% |
US$ Fixed Rate |
|
|
— |
|
|
|
— |
|
|
|
— |
|
|
|
— |
|
|
|
— |
|
|
|
500,000 |
|
|
|
500,000 |
|
|
|
430,165 |
|
|
4.00% |
Total |
|
$ |
50,000 |
|
|
$ |
385,879 |
|
|
$ |
— |
|
|
$ |
— |
|
|
$ |
— |
|
|
$ |
500,000 |
|
|
$ |
935,879 |
|
|
$ |
865,793 |
|
|
|
46
Interest Rate Swap Contracts
Our interest rate swap arrangement ended on June 1, 2022. The table below presents information regarding our interest rate swap for the year ended January 2, 2023:
|
|
For the Year Ended |
|
|
|
|
|
(In thousands, except interest rates) |
|
|
|
Average interest payout rate |
|
|
2.84 |
% |
|
Interest payout amount |
|
$ |
(4,669 |
) |
|
Average interest received rate |
|
|
0.34 |
% |
|
Interest received amount |
|
$ |
564 |
|
|
ITEM 8. FINANCIAL STATEMENTS AND SUPPLEMENTARY DATA
Reference is made to our consolidated financial statements, the notes thereto, and the report thereon, commencing on page 54 of this report, which consolidated financial statements, notes and report are incorporated herein by reference.
ITEM 9. CHANGES IN AND DISAGREEMENTS WITH ACCOUNTANTS ON ACCOUNTING AND FINANCIAL DISCLOSURE
Not applicable.
ITEM 9A. CONTROLS AND PROCEDURES
Evaluation of Disclosure Controls and Procedures
Our management, under the supervision and with the participation of our Chief Executive Officer (CEO) and Chief Financial Officer (CFO), has evaluated the effectiveness of the design and operation of our disclosure controls and procedures (as defined in Exchange Act Rules 13a-15(e) and 15d-15(e)) as of the end of the period covered by this Report. Based on this evaluation, our CEO and CFO have concluded that, as of January 2, 2023 such disclosure controls and procedures were effective to provide reasonable assurance that information we are required to disclose in reports that we file or submit under the Exchange Act is (i) recorded, processed, summarized and reported within the time periods specified in the SEC’s rules and forms and (ii) accumulated and communicated to our management, including our CEO and CFO, as appropriate to allow timely decisions regarding required disclosures.
Management’s Report on Internal Control over Financial Reporting
Our management is responsible for establishing and maintaining adequate internal control over financial reporting, (as defined in Exchange Act Rules 13a-15(f) and 15d-15(f)) to provide reasonable assurance regarding the reliability of our financial reporting and the preparation of financial statements for external purposes in accordance with accounting principles generally accepted in the United States of America (U.S. GAAP). Under the supervision of and with the participation of our CEO and CFO, management conducted an assessment of the effectiveness of our internal control over financial reporting as of January 2, 2023 based on the criteria established in Internal Control — Integrated Framework (2013) issued by the Committee of Sponsoring Organizations of the Treadway Commission (COSO). Based on this assessment, management concluded that our internal control over financial reporting was effective as of January 2, 2023.
We acquired Gritel Holding Co., Inc. (Gritel) and ISC Farmingdale Corp. on June 27, 2022. At the time of the acquisition, Telephonics Corporation was wholly-owned by Gritel, and as a result of the acquisition, became an indirect, wholly-owned subsidiary of the Company (collectively with ISC Farmingdale Corp., Telephonics). Management excluded from its evaluation of the effectiveness of our internal control over financial reporting as of January 2, 2023 the acquired entity’s internal control over financial reporting associated with 5.8% of total assets and 5.0% of total net sales included in our consolidated financial statements as of and for the year ended January 2, 2023.
The effectiveness of our internal control over financial reporting as of January 2, 2023 has been audited by KPMG LLP, an independent registered public accounting firm, as stated in their report, which appears under the heading “Report of Independent Registered Public Accounting Firm” on page 55 of this Report.
Inherent Limitations on Effectiveness of Controls
A control system, no matter how well designed and operated, can provide only reasonable, not absolute, assurance that the control system’s objectives will be met. The design of a control system must reflect the fact that there are resource constraints, and the benefits of controls must be considered relative to their costs. Further, because of the inherent limitations in all control systems, no evaluation of controls can provide absolute assurance that misstatements due to error or fraud will not occur or that all control issues and instances of fraud, if any, have been detected. In addition, the design of any system of controls is based in part on certain assumptions about the likelihood of future events.
47
Changes in Internal Control over Financial Reporting
We continue to expand our implementation of an enterprise resource planning (ERP) system on a worldwide basis, which is expected to improve the efficiency of the financial reporting and related transaction processes. We have completed the implementation with respect to the next phase and as a result, we made changes to our processes and procedures which, in turn, resulted in changes to our internal control over financial reporting. We continue to roll out the ERP system to our remaining locations.
There have been no other changes in our internal control over financial reporting (as defined in Rules 13a-15(f) and 15d-15(f) under the Exchange Act) during the quarter ended January 2, 2023 that have materially affected, or are reasonably likely to materially affect, our internal control over financial reporting.
ITEM 9B. OTHER INFORMATION
Not applicable.
ITEM 9C. DISCLOSURE REGARDING FOREIGN JURISDICTIONS THAT PREVENT INSPECTIONS
Not applicable.
48
PART III
ITEM 10. DIRECTORS, EXECUTIVE OFFICERS AND CORPORATE GOVERNANCE
The information required by this Item is incorporated herein by reference to the definitive Proxy Statement to be filed pursuant to Regulation 14A of the Exchange Act for our 2023 Annual Meeting of Stockholders.
ITEM 11. EXECUTIVE COMPENSATION
The information required by this Item is incorporated herein by reference to the definitive Proxy Statement to be filed pursuant to Regulation 14A of the Exchange Act for our 2023 Annual Meeting of Stockholders.
ITEM 12. SECURITY OWNERSHIP OF CERTAIN BENEFICIAL OWNERS AND MANAGEMENT AND RELATED STOCKHOLDER MATTERS
The information required by this Item is incorporated herein by reference to the definitive Proxy Statement to be filed pursuant to Regulation 14A of the Exchange Act for our 2023 Annual Meeting of Stockholders.
The information required by this Item is incorporated herein by reference to the definitive Proxy Statement to be filed pursuant to Regulation 14A of the Exchange Act for our 2023 Annual Meeting of Stockholders.
ITEM 14. PRINCIPAL ACCOUNTING FEES AND SERVICES
The information required by this Item is incorporated herein by reference to the definitive Proxy Statement to be filed pursuant to Regulation 14A of the Exchange Act for our 2023 Annual Meeting of Stockholders.
49
PART IV
ITEM 15. EXHIBITS, FINANCIAL STATEMENT SCHEDULES
(a) Financial Statements
Financial Statements are listed in the Index to Consolidated Financial Statements on page 54 of this Report.
(b) Exhibits
|
|
|
Exhibit Number |
Exhibits |
|
|
2.1 |
|
|
|
2.2 |
|
|
|
2.4 |
|
|
|
3.1(a) |
Registrant’s Certificate of Incorporation, as amended June 3, 2011(1(a)) |
|
|
3.1(b) |
Registrant’s Certificate of Amendment of Certificate of Incorporation, dated May 12, 2016(1(b)) |
|
|
3.2 |
Registrant’s Fifth Amended and Restated Bylaws, as amended August 3, 2021(2) |
|
|
4.1 |
|
|
|
4.3 |
|
|
|
4.8 |
|
|
|
4.10 |
|
|
|
4.11 |
|
|
|
4.12 |
|
|
|
4.13 |
|
|
|
10.13‡ |
|
|
|
10.15 |
Form of Director and Officer Indemnification Agreement, dated December 10, 2014(8) |
|
|
10.20 |
|
|
|
10.22‡ |
|
|
|
10.24 |
|
|
|
10.25 |
|
|
|
10.26 |
|
|
|
10.27 |
|
|
|
10.28 |
|
|
|
10.29 |
|
|
|
50
|
|
10.30 |
|
|
|
10.31 |
|
|
|
10.32 |
|
|
|
10.33 |
|
|
|
10.34 |
|
|
|
10.35 |
|
|
|
10.40 |
|
|
|
10.41 |
|
|
|
10.42 |
|
|
|
10.43 |
Form of Executive Change in Control Severance Agreement and schedule of agreements(13) |
|
|
10.44 |
|
|
|
10.45 |
|
|
|
10.46 |
|
|
|
10.47 |
|
|
|
10.48 |
Amendment to TTM Technologies, Inc. 2014 Incentive Compensation Plan(16) |
|
|
10.49 |
|
|
|
10.50 |
Commitment Letter from Barclays Bank PLC dated December 1, 2017(20) |
|
|
10.51 |
|
|
|
10.52 |
|
|
|
51
|
|
10.53 |
TTM Technologies, Inc. Executive Compensation Recoupment Policy(23) |
|
|
10.54 |
|
|
|
10.55 |
|
|
|
10.56 |
|
|
|
10.57 |
|
|
|
10.58 |
|
|
|
21.1* |
|
|
|
23.1* |
Consent of KPMG LLP, independent registered public accounting firm |
|
|
31.1* |
CEO Certification Pursuant to Section 302 of the Sarbanes-Oxley Act of 2002 |
|
|
31.2* |
CFO Certification Pursuant to Section 302 of the Sarbanes-Oxley Act of 2002 |
|
|
32.1* |
CEO Certification Pursuant to Section 906 of the Sarbanes-Oxley Act of 2002 |
|
|
32.2* |
CFO Certification Pursuant to Section 906 of the Sarbanes-Oxley Act of 2002 |
|
|
101.INS |
Inline XBRL Instance Document – the instance document does not appear in the Interactive Data File because its XBRL tags are embedded within the inline XBRL document. |
|
|
101.SCH |
Inline XBRL Taxonomy Extension Schema Document |
|
|
101.CAL |
Inline XBRL Taxonomy Extension Calculation Linkbase Documents |
|
|
101.DEF |
Inline XBRL Taxonomy Extension Definition Linkbase Documents |
|
|
101.LAB |
Inline XBRL Taxonomy Extension Label Linkbase Documents |
|
|
101.PRE |
Inline XBRL Taxonomy Extension Presentation Linkbase Documents |
|
|
104 |
Cover Page Interactive Data File (formatted as inline XBRL and contained in Exhibit 101) |
52
‡ Management contract or Compensation Plan
* Filed herewith
(c) Financial Statement Schedules
None.
ITEM 16. FORM 10-K SUMMARY
None.
53
SIGNATURES
Pursuant to the requirements of Section 13 or 15(d) of the Securities Exchange Act of 1934, the registrant has duly caused this Report to be signed on its behalf by the undersigned, thereunto duly authorized.
TTM TECHNOLOGIES, INC. |
||
|
|
|
By: |
|
/s/ Thomas T. Edman |
|
|
Thomas T. Edman President and Chief Executive Officer |
Date: March 3, 2023
Pursuant to the requirements of the Securities Exchange Act of 1934, this Report has been signed below by the following persons on behalf of the registrant and in the capacities and on the dates indicated.
|
|
|
|
|
Name |
|
Title |
|
Date |
|
|
|
|
|
|
/s/ Thomas T. Edman
Thomas T. Edman |
|
President, Chief Executive Officer and Director (Principal Executive Officer) |
|
March 3, 2023 |
|
|
|
|
|
|
/s/ Todd B. Schull
Todd B. Schull |
|
Executive Vice President and |
|
March 3, 2023 |
|
|
|
|
|
|
/s/ Rex D. Geveden
Rex D. Geveden |
|
Chairman of the Board |
|
March 3, 2023 |
|
|
|
|
|
|
/s/ Kenton K. Alder
Kenton K. Alder |
|
Director |
|
March 3, 2023 |
|
|
|
|
|
|
/s/ Julie S. England
Julie S. England |
|
Director |
|
March 3, 2023 |
|
|
|
|
|
|
/s/ Philip G. Franklin
Philip G. Franklin |
|
Director |
|
March 3, 2023 |
|
|
|
|
|
|
/s/ Pamela B. Jackson
Pamela B. Jackson |
|
Director |
|
March 3, 2023 |
|
|
|
|
|
|
/s/ Chantel E. Lenard
Chantel E. Lenard |
|
Director |
|
March 3, 2023 |
|
|
|
|
|
|
/s/ John G. Mayer
John G. Mayer |
|
Director |
|
March 3, 2023 |
|
|
|
|
|
|
/s/ Dov S. Zakheim
Dov S. Zakheim |
|
Director |
|
March 3, 2023 |
54
TTM TECHNOLOGIES, INC.
Index to Consolidated Financial Statements
56 |
|
Consolidated Balance Sheets as of January 2, 2023 and January 3, 2022 |
58 |
59 |
|
60 |
|
61 |
|
62 |
|
63 |
55
Report of Independent Registered Public Accounting Firm
To the Stockholders and Board of Directors
TTM Technologies, Inc.:
Opinions on the Consolidated Financial Statements and Internal Control Over Financial Reporting
We have audited the accompanying consolidated balance sheets of TTM Technologies, Inc. and subsidiaries (the Company) as of January 2, 2023 and January 3, 2022, the related consolidated statements of operations, comprehensive income, stockholders’ equity, and cash flows for each of the years in the three-year period ended January 2, 2023, and the related notes (collectively, the consolidated financial statements). We also have audited the Company’s internal control over financial reporting as of January 2, 2023, based on criteria established in Internal Control – Integrated Framework (2013) issued by the Committee of Sponsoring Organizations of the Treadway Commission.
In our opinion, the consolidated financial statements referred to above present fairly, in all material respects, the financial position of the Company as of January 2, 2023 and January 3, 2022, and the results of its operations and its cash flows for each of the years in the three-year period ended January 2, 2023, in conformity with U.S. generally accepted accounting principles. Also in our opinion, the Company maintained, in all material respects, effective internal control over financial reporting as of January 2, 2023 based on criteria established in Internal Control – Integrated Framework (2013) issued by the Committee of Sponsoring Organizations of the Treadway Commission.
The Company acquired Gritel Holding Co., Inc. and ISC Farmingdale Corp. during 2022, and management excluded from its assessment of the effectiveness of the Company’s internal control over financial reporting as of January 2, 2023, Gritel Holding Co., Inc. and ISC Farmingdale Corp.’s internal control over financial reporting associated with total assets of 5.8% and total net sales of 5.0% included in the consolidated financial statements of the Company as of and for the year ended January 2, 2023. Our audit of internal control over financial reporting of the Company also excluded an evaluation of the internal control over financial reporting of Gritel Holding Co., Inc. and ISC Farmingdale Corp.
Basis for Opinions
The Company’s management is responsible for these consolidated financial statements, for maintaining effective internal control over financial reporting, and for its assessment of the effectiveness of internal control over financial reporting, included in the accompanying Management’s Report on Internal Control over Financial Reporting. Our responsibility is to express an opinion on the Company’s consolidated financial statements and an opinion on the Company’s internal control over financial reporting based on our audits. We are a public accounting firm registered with the Public Company Accounting Oversight Board (United States) (PCAOB) and are required to be independent with respect to the Company in accordance with the U.S. federal securities laws and the applicable rules and regulations of the Securities and Exchange Commission and the PCAOB.
We conducted our audits in accordance with the standards of the PCAOB. Those standards require that we plan and perform the audits to obtain reasonable assurance about whether the consolidated financial statements are free of material misstatement, whether due to error or fraud, and whether effective internal control over financial reporting was maintained in all material respects.
Our audits of the consolidated financial statements included performing procedures to assess the risks of material misstatement of the consolidated financial statements, whether due to error or fraud, and performing procedures that respond to those risks. Such procedures included examining, on a test basis, evidence regarding the amounts and disclosures in the consolidated financial statements. Our audits also included evaluating the accounting principles used and significant estimates made by management, as well as evaluating the overall presentation of the consolidated financial statements. Our audit of internal control over financial reporting included obtaining an understanding of internal control over financial reporting, assessing the risk that a material weakness exists, and testing and evaluating the design and operating effectiveness of internal control based on the assessed risk. Our audits also included performing such other procedures as we considered necessary in the circumstances. We believe that our audits provide a reasonable basis for our opinions.
Definition and Limitations of Internal Control Over Financial Reporting
A company’s internal control over financial reporting is a process designed to provide reasonable assurance regarding the reliability of financial reporting and the preparation of financial statements for external purposes in accordance with generally accepted accounting principles. A company’s internal control over financial reporting includes those policies and procedures that (1) pertain to the maintenance of records that, in reasonable detail, accurately and fairly reflect the transactions and dispositions of the assets of the company; (2) provide reasonable assurance that transactions are recorded as necessary to permit preparation of financial statements in accordance with generally accepted accounting principles, and that receipts and expenditures of the company are being made only in accordance with authorizations of management and directors of the company; and (3) provide reasonable assurance regarding prevention or timely detection of unauthorized acquisition, use, or disposition of the company’s assets that could have a material effect on the financial statements.
56
Because of its inherent limitations, internal control over financial reporting may not prevent or detect misstatements. Also, projections of any evaluation of effectiveness to future periods are subject to the risk that controls may become inadequate because of changes in conditions, or that the degree of compliance with the policies or procedures may deteriorate.
Critical Audit Matter
The critical audit matter communicated below is a matter arising from the current period audit of the consolidated financial statements that was communicated or required to be communicated to the audit committee and that: (1) relates to accounts or disclosures that are material to the consolidated financial statements and (2) involved our especially challenging, subjective, or complex judgments. The communication of a critical audit matter does not alter in any way our opinion on the consolidated financial statements, taken as a whole, and we are not, by communicating the critical audit matter below, providing a separate opinion on the critical audit matter or on the accounts or disclosures to which it relates.
Evaluation of the sufficiency of audit evidence over net sales
As discussed in Note 1 to the consolidated financial statements, the Company recorded approximately $2,495,046 thousand of net sales during the year ended January 2, 2023. Net sales are recognized primarily from the sale of printed circuit boards, engineered systems using customer-supplied engineering and design plans as well as long-term contracts related to the design and manufacture of highly sophisticated intelligence, surveillance and communications solutions, radio-frequency and microwave/microelectronics components, assemblies, and subsystems.
We identified the evaluation of the sufficiency of audit evidence over net sales as a critical audit matter. Evaluating the sufficiency of audit evidence obtained required especially subjective auditor judgment because of the geographical dispersion and decentralized nature of the Company’s net sales generating activities. This included determining the Company locations at which procedures were performed. It also included the involvement of IT professionals with specialized skills and knowledge, who assisted in the performance of certain procedures.
The following are the primary procedures we performed to address this critical audit matter. We applied auditor judgment to determine the nature and extent of procedures to be performed over net sales, including determining the locations at which those procedures were to be performed. At each location where procedures were performed, we (1) evaluated the design and tested the operating effectiveness of certain internal controls over the Company’s net sales processes, including the Company’s controls over the accurate recording of sales amounts, (2) involved IT professionals, who assisted in testing certain IT applications used by the Company in its revenue recognition processes, and (3) tested the recorded net sales by selecting a sample of transactions and comparing the amounts recognized to underlying documentation, including contracts with customers. In addition, we evaluated the sufficiency of audit evidence obtained over net sales by assessing the results of procedures performed.
/s/ KPMG LLP
We have served as the Company’s auditor since 2014.
Irvine, California
March 3, 2023
57
TTM TECHNOLOGIES, INC.
Consolidated Balance Sheets
|
|
As of |
|
|||||
|
|
January 2, |
|
|
January 3, |
|
||
|
|
2023 |
|
|
2022 |
|
||
|
|
(In thousands, except par value) |
|
|||||
ASSETS |
|
|
|
|
|
|
||
Current assets: |
|
|
|
|
|
|
||
Cash and cash equivalents |
|
$ |
|
|
$ |
|
||
Accounts receivable, net |
|
|
|
|
|
|
||
Contract assets |
|
|
|
|
|
|
||
Inventories |
|
|
|
|
|
|
||
Receivable from sale of SH E-MS property |
|
|
|
|
|
|
||
Prepaid expenses and other current assets |
|
|
|
|
|
|
||
Total current assets |
|
|
|
|
|
|
||
Property, plant and equipment, net |
|
|
|
|
|
|
||
Operating lease right-of-use assets |
|
|
|
|
|
|
||
Goodwill |
|
|
|
|
|
|
||
Definite-lived intangibles, net |
|
|
|
|
|
|
||
Deposits and other non-current assets |
|
|
|
|
|
|
||
Total assets |
|
$ |
|
|
$ |
|
||
|
|
|
|
|
|
|
||
LIABILITIES AND STOCKHOLDERS' EQUITY |
|
|
|
|
|
|
||
Current liabilities: |
|
|
|
|
|
|
||
Short-term debt, including current portion of long-term debt |
|
$ |
|
|
$ |
|
||
Accounts payable |
|
|
|
|
|
|
||
Contract liabilities |
|
|
|
|
|
|
||
Accrued salaries, wages and benefits |
|
|
|
|
|
|
||
Other current liabilities |
|
|
|
|
|
|
||
Total current liabilities |
|
|
|
|
|
|
||
Long-term debt, net of discount and issuance costs |
|
|
|
|
|
|
||
Operating lease liabilities |
|
|
|
|
|
|
||
Other long-term liabilities |
|
|
|
|
|
|
||
Total long-term liabilities |
|
|
|
|
|
|
||
|
|
|
|
|
|
|||
Equity: |
|
|
|
|
|
|
||
Common stock, $ |
|
|
|
|
|
|
||
Treasury stock – common stock at cost; |
|
|
( |
) |
|
|
( |
) |
Additional paid-in capital |
|
|
|
|
|
|
||
Retained earnings |
|
|
|
|
|
|
||
Accumulated other comprehensive loss |
|
|
( |
) |
|
|
( |
) |
Total stockholders’ equity |
|
|
|
|
|
|
||
Total liabilities and stockholders' equity |
|
$ |
|
|
$ |
|
||
See accompanying notes to consolidated financial statements.
58
TTM TECHNOLOGIES, INC.
Consolidated Statements of Operations
|
|
For the Year Ended |
|
|||||||||
|
|
January 2, |
|
|
January 3, |
|
|
December 28, |
|
|||
|
|
2023 |
|
|
2022 |
|
|
2020 |
|
|||
|
|
(In thousands, except per share data) |
|
|||||||||
Net sales |
|
$ |
|
|
$ |
|
|
$ |
|
|||
Cost of goods sold |
|
|
|
|
|
|
|
|
|
|||
Gross profit |
|
|
|
|
|
|
|
|
|
|||
Operating expenses: |
|
|
|
|
|
|
|
|
|
|||
Selling and marketing |
|
|
|
|
|
|
|
|
|
|||
General and administrative |
|
|
|
|
|
|
|
|
|
|||
Research and development |
|
|
|
|
|
|
|
|
|
|||
Amortization of definite-lived intangibles |
|
|
|
|
|
|
|
|
|
|||
Gain on sale of SH E-MS property |
|
|
( |
) |
|
|
— |
|
|
|
— |
|
Restructuring charges |
|
|
|
|
|
|
|
|
|
|||
Impairment of goodwill |
|
|
— |
|
|
|
— |
|
|
|
|
|
Total operating expenses |
|
|
|
|
|
|
|
|
|
|||
Operating income |
|
|
|
|
|
|
|
|
|
|||
Other (expense) income: |
|
|
|
|
|
|
|
|
|
|||
Interest expense |
|
|
( |
) |
|
|
( |
) |
|
|
( |
) |
Loss on extinguishment of debt |
|
|
— |
|
|
|
( |
) |
|
|
— |
|
Other, net |
|
|
|
|
|
|
|
|
( |
) |
||
Total other expense, net |
|
|
( |
) |
|
|
( |
) |
|
|
( |
) |
Income (loss) from continuing operations before income taxes |
|
|
|
|
|
|
|
|
( |
) |
||
Income tax (provision) benefit |
|
|
( |
) |
|
|
( |
) |
|
|
|
|
Net income (loss) from continuing operations |
|
|
|
|
|
|
|
|
( |
) |
||
Income from discontinued operations, net of income taxes |
|
|
— |
|
|
|
— |
|
|
|
|
|
Net income |
|
$ |
|
|
$ |
|
|
$ |
|
|||
|
|
|
|
|
|
|
|
|
|
|||
Earnings per share: |
|
|
|
|
|
|
|
|
|
|||
Basic earnings (loss) per share from continuing operations |
|
$ |
|
|
$ |
|
|
$ |
( |
) |
||
Basic earnings per share from discontinued operations |
|
|
— |
|
|
|
— |
|
|
|
|
|
Basic earnings per share |
|
$ |
|
|
$ |
|
|
$ |
|
|||
|
|
|
|
|
|
|
|
|
|
|||
Diluted earnings (loss) per share from continuing operations |
|
$ |
|
|
$ |
|
|
$ |
( |
) |
||
Diluted earnings per share from discontinued operations |
|
|
— |
|
|
|
— |
|
|
|
|
|
Diluted earnings per share |
|
$ |
|
|
$ |
|
|
$ |
|
|||
See accompanying notes to consolidated financial statements.
59
TTM TECHNOLOGIES, INC.
Consolidated Statements of Comprehensive Income
|
|
For the Year Ended |
|
|||||||||
|
|
January 2, |
|
|
January 3, |
|
|
December 28, |
|
|||
|
|
2023 |
|
|
2022 |
|
|
2020 |
|
|||
|
|
(In thousands) |
|
|||||||||
Net income |
|
$ |
|
|
$ |
|
|
$ |
|
|||
Other comprehensive income (loss), net of tax: |
|
|
|
|
|
|
|
|
|
|||
Pension obligation adjustments, net |
|
|
|
|
|
|
|
|
( |
) |
||
Reclassification adjustment for foreign currency translation |
|
|
— |
|
|
|
— |
|
|
|
( |
) |
Derecognition of foreign currency translation adjustments |
|
|
— |
|
|
|
— |
|
|
|
( |
) |
Foreign currency translation adjustments, net |
|
|
( |
) |
|
|
|
|
|
|
||
Derecognition of unrealized losses on cash flow hedge |
|
|
— |
|
|
|
— |
|
|
|
|
|
Net unrealized losses on cash flow hedges: |
|
|
|
|
|
|
|
|
|
|||
Unrealized loss on effective cash flow hedges during |
|
|
( |
) |
|
|
( |
) |
|
|
( |
) |
Loss realized in the statement of operations, net |
|
|
|
|
|
|
|
|
|
|||
Net |
|
|
|
|
|
|
|
|
( |
) |
||
Other comprehensive income (loss), net of tax |
|
|
|
|
|
|
|
|
( |
) |
||
Comprehensive income, net of tax |
|
$ |
|
|
$ |
|
|
$ |
|
|||
See accompanying notes to consolidated financial statements.
60
TTM TECHNOLOGIES, INC.
Consolidated Statements of Stockholders’ Equity
|
|
Common Stock |
|
|
Treasury Stock |
|
|
Additional |
|
|
Retained |
|
|
Accumulated |
|
|
Total |
|
||||||||||||||
|
|
Shares |
|
|
Amount |
|
|
Shares |
|
|
Amount |
|
|
Capital |
|
|
Earnings |
|
|
(Loss) Income |
|
|
Equity |
|
||||||||
|
|
(In thousands) |
|
|||||||||||||||||||||||||||||
Balance, December 30, 2019 |
|
|
|
|
$ |
|
|
|
— |
|
|
$ |
— |
|
|
$ |
|
|
$ |
|
|
$ |
( |
) |
|
$ |
|
|||||
Net income |
|
|
— |
|
|
|
— |
|
|
|
— |
|
|
|
— |
|
|
|
— |
|
|
|
|
|
|
— |
|
|
|
|
||
Other comprehensive loss |
|
|
— |
|
|
|
— |
|
|
|
— |
|
|
|
— |
|
|
|
— |
|
|
|
— |
|
|
|
( |
) |
|
|
( |
) |
Exercise of stock options |
|
|
|
|
|
— |
|
|
|
— |
|
|
|
— |
|
|
|
|
|
|
— |
|
|
|
— |
|
|
|
|
|||
Issuance of common stock for |
|
|
|
|
|
— |
|
|
|
— |
|
|
|
— |
|
|
|
— |
|
|
|
— |
|
|
|
— |
|
|
|
— |
|
|
Issuance of common stock for |
|
|
|
|
|
|
|
|
— |
|
|
|
— |
|
|
|
( |
) |
|
|
— |
|
|
|
— |
|
|
|
— |
|
||
Stock-based compensation |
|
|
— |
|
|
|
— |
|
|
|
— |
|
|
|
— |
|
|
|
|
|
|
— |
|
|
|
— |
|
|
|
|
||
Balance, December 28, 2020 |
|
|
|
|
$ |
|
|
|
— |
|
|
$ |
— |
|
|
$ |
|
|
$ |
|
|
$ |
( |
) |
|
$ |
|
|||||
Net income |
|
|
— |
|
|
|
— |
|
|
|
— |
|
|
|
— |
|
|
|
— |
|
|
|
|
|
|
— |
|
|
|
|
||
Other comprehensive income |
|
|
— |
|
|
|
— |
|
|
|
— |
|
|
|
— |
|
|
|
— |
|
|
|
— |
|
|
|
|
|
|
|
||
Issuance of common stock for |
|
|
|
|
|
— |
|
|
|
— |
|
|
|
— |
|
|
|
— |
|
|
|
— |
|
|
|
— |
|
|
|
— |
|
|
Issuance of common stock for |
|
|
|
|
|
|
|
|
— |
|
|
|
— |
|
|
|
( |
) |
|
|
— |
|
|
|
— |
|
|
|
— |
|
||
Repurchases of common stock |
|
|
— |
|
|
|
— |
|
|
|
( |
) |
|
|
( |
) |
|
|
— |
|
|
|
— |
|
|
|
— |
|
|
|
( |
) |
Fair value of warrants |
|
|
— |
|
|
|
— |
|
|
|
— |
|
|
|
— |
|
|
|
( |
) |
|
|
— |
|
|
|
— |
|
|
|
( |
) |
Issuance of stock |
|
|
|
|
|
— |
|
|
|
|
|
|
|
|
|
( |
) |
|
|
— |
|
|
|
— |
|
|
|
— |
|
|||
Stock-based compensation |
|
|
— |
|
|
|
— |
|
|
|
— |
|
|
|
— |
|
|
|
|
|
|
— |
|
|
|
— |
|
|
|
|
||
Balance, January 3, 2022 |
|
|
|
|
$ |
|
|
|
( |
) |
|
$ |
( |
) |
|
$ |
|
|
$ |
|
|
$ |
( |
) |
|
$ |
|
|||||
Net income |
|
|
— |
|
|
|
— |
|
|
|
— |
|
|
|
— |
|
|
|
— |
|
|
|
|
|
|
— |
|
|
|
|
||
Other comprehensive income |
|
|
— |
|
|
|
— |
|
|
|
— |
|
|
|
— |
|
|
|
— |
|
|
|
— |
|
|
|
|
|
|
|
||
Issuance of common stock for |
|
|
|
|
|
— |
|
|
|
— |
|
|
|
— |
|
|
|
— |
|
|
|
— |
|
|
|
— |
|
|
|
— |
|
|
Issuance of common stock for |
|
|
|
|
|
|
|
|
— |
|
|
|
— |
|
|
|
( |
) |
|
|
— |
|
|
|
— |
|
|
|
— |
|
||
Repurchases of common stock |
|
|
— |
|
|
|
— |
|
|
|
( |
) |
|
|
( |
) |
|
|
— |
|
|
|
— |
|
|
|
— |
|
|
|
( |
) |
Fair value of warrants |
|
|
— |
|
|
|
— |
|
|
|
— |
|
|
|
— |
|
|
|
( |
) |
|
|
— |
|
|
|
— |
|
|
|
( |
) |
Issuance of stock |
|
|
— |
|
|
|
— |
|
|
|
|
|
|
|
|
|
( |
) |
|
|
— |
|
|
|
— |
|
|
|
— |
|
||
Stock-based compensation |
|
|
— |
|
|
|
— |
|
|
|
— |
|
|
|
— |
|
|
|
|
|
|
— |
|
|
|
— |
|
|
|
|
||
Balance, January 2, 2023 |
|
|
|
|
$ |
|
|
|
( | ) |
|
$ |
( |
) |
|
$ |
|
|
$ |
|
|
$ |
( |
) |
|
$ |
|
|||||
See accompanying notes to consolidated financial statements.
61
TTM TECHNOLOGIES, INC.
Consolidated Statements of Cash Flows
|
|
For the Year Ended |
|
|||||||||
|
|
January 2, 2023 |
|
|
January 3, 2022 |
|
|
December 28, 2020 |
|
|||
|
|
(In thousands) |
|
|||||||||
Cash flows from operating activities: |
|
|
|
|
|
|
|
|
|
|||
Net income |
|
$ |
|
|
$ |
|
|
$ |
|
|||
Adjustments to reconcile net income to net cash provided by operating activities: |
|
|
|
|
|
|
|
|
|
|||
Depreciation of property, plant and equipment |
|
|
|
|
|
|
|
|
|
|||
Amortization of definite-lived intangible assets |
|
|
|
|
|
|
|
|
|
|||
Amortization of debt discount and issuance costs |
|
|
|
|
|
|
|
|
|
|||
Loss on extinguishment of debt |
|
|
— |
|
|
|
|
|
|
— |
|
|
Deferred income taxes |
|
|
|
|
|
|
|
|
|
|||
Stock-based compensation |
|
|
|
|
|
|
|
|
|
|||
Gain on sale of SH E-MS property |
|
|
( |
) |
|
|
— |
|
|
|
— |
|
Impairment of goodwill |
|
|
— |
|
|
|
— |
|
|
|
|
|
Gain on sale of the Mobility business unit |
|
|
— |
|
|
|
— |
|
|
|
( |
) |
Other |
|
|
( |
) |
|
|
( |
) |
|
|
|
|
Changes in operating assets and liabilities: |
|
|
|
|
|
|
|
|
|
|||
Accounts receivable, net |
|
|
( |
) |
|
|
( |
) |
|
|
|
|
Contract assets |
|
|
|
|
|
( |
) |
|
|
( |
) |
|
Inventories |
|
|
( |
) |
|
|
( |
) |
|
|
|
|
Prepaid expenses and other current assets |
|
|
( |
) |
|
|
( |
) |
|
|
( |
) |
Accounts payable |
|
|
( |
) |
|
|
|
|
|
|
||
Contract liabilities |
|
|
|
|
|
|
|
|
|
|||
Accrued salaries, wages and benefits |
|
|
|
|
|
( |
) |
|
|
|
||
Other liabilities |
|
|
|
|
|
( |
) |
|
|
( |
) |
|
Net cash provided by operating activities |
|
|
|
|
|
|
|
|
|
|||
Cash flows from investing activities: |
|
|
|
|
|
|
|
|
|
|||
Acquisition of Gritel Holding Co., Inc. and ISC Farmingdale Corp. |
|
|
( |
) |
|
|
— |
|
|
|
— |
|
Proceeds from sale of the Mobility business unit, net of cash disposed |
|
|
— |
|
|
|
— |
|
|
|
|
|
Purchase of property, plant and equipment and other assets |
|
|
( |
) |
|
|
( |
) |
|
|
( |
) |
Proceeds from sale of property, plant and equipment and other assets |
|
|
|
|
|
|
|
|
|
|||
Investment in unconsolidated joint venture |
|
|
— |
|
|
|
( |
) |
|
|
— |
|
Other |
|
|
( |
) |
|
|
( |
) |
|
|
( |
) |
Net cash (used in) provided by investing activities |
|
|
( |
) |
|
|
( |
) |
|
|
|
|
Cash flows from financing activities: |
|
|
|
|
|
|
|
|
|
|||
Proceeds from borrowings of revolving loan |
|
|
|
|
|
— |
|
|
|
— |
|
|
Repayment of revolving loan |
|
|
( |
) |
|
|
— |
|
|
|
— |
|
Repurchases of common stock |
|
|
( |
) |
|
|
( |
) |
|
|
— |
|
Customer deposits |
|
|
|
|
|
— |
|
|
|
— |
|
|
Cash used to settle warrants |
|
|
( |
) |
|
|
( |
) |
|
|
— |
|
Proceeds from long-term debt borrowing |
|
|
— |
|
|
|
|
|
|
— |
|
|
Repayment of long-term debt borrowings |
|
|
— |
|
|
|
( |
) |
|
|
( |
) |
Payment of debt issuance costs |
|
|
— |
|
|
|
( |
) |
|
|
— |
|
Other |
|
|
— |
|
|
|
( |
) |
|
|
|
|
Net cash used in financing activities |
|
|
( |
) |
|
|
( |
) |
|
|
( |
) |
Effect of foreign currency exchange rates on cash and cash equivalents |
|
|
( |
) |
|
|
|
|
|
|
||
Net (decrease) increase in cash and cash equivalents |
|
|
( |
) |
|
|
|
|
|
|
||
Cash and cash equivalents at beginning of year |
|
|
|
|
|
|
|
|
|
|||
Cash and cash equivalents at end of year |
|
$ |
|
|
$ |
|
|
$ |
|
|||
Supplemental cash flow information: |
|
|
|
|
|
|
|
|
|
|||
Cash paid, net for interest |
|
$ |
|
|
$ |
|
|
$ |
|
|||
Cash paid, net for income taxes |
|
|
|
|
|
|
|
|
|
|||
Net cash provided by operating activities from discontinued operations |
|
|
— |
|
|
|
— |
|
|
|
|
|
Net cash provided by investing activities from discontinued operations |
|
|
— |
|
|
|
— |
|
|
|
|
|
Supplemental disclosure of noncash investing and financing activities: |
|
|
|
|
|
|
|
|
|
|||
Receivable from sale of SH E-MS property |
|
$ |
|
|
$ |
— |
|
|
$ |
— |
|
|
Property, plant and equipment recorded in accounts payable |
|
|
|
|
|
|
|
|
|
|||
Issuance of common stock for warrant settlement |
|
|
|
|
|
|
|
|
— |
|
||
See accompanying notes to consolidated financial statements.
62
TTM TECHNOLOGIES, INC.
Notes to Consolidated Financial Statements
(Dollars and shares in thousands, except per share data)
Nature of Operations
TTM Technologies, Inc. (the Company or TTM) is a leading global manufacturer of technology solutions, including engineered systems, radio frequency (RF) components and RF microwave/microelectronic assemblies, and printed circuit boards (PCB). The Company provides time-to-market and volume production of advanced technology products and offers a one-stop design, engineering and manufacturing solution to customers. This one-stop design, engineering and manufacturing solution allows the Company to align technology developments with the diverse needs of the Company’s customers and to enable them to reduce the time required to develop new products and bring them to market.
The Company serves a diversified customer base in various markets throughout the world, including aerospace and defense, data center computing, automotive, medical, industrial and instrumentation, as well as networking and telecommunications. The Company’s customers include original equipment manufacturers (OEMs), electronic manufacturing services (EMS) providers, original design manufacturers (ODMs), distributors and government agencies.
On January 19, 2020, the Company entered into a definitive equity interests purchase agreement with AKMMeadville Electronics (Xiamen) Co., Ltd (the Purchaser) for the sale that was completed on April 17, 2020 of the following now former Company subsidiaries: Shanghai Kaiser Electronics Co., Ltd. (SKE), Shanghai Meadville Electronics Co., Ltd. (SME), Shanghai Meadville Science & Technology Co., Ltd. (SP) and Guangzhou Meadville Electronics Co., Ltd. (GME) (collectively, the Mobility business unit). In the consolidated statements of operations for 2020, all sales, costs, expenses, income taxes and gain on sale attributable to the Mobility business unit have been aggregated under the caption “Income from discontinued operations, net of income taxes”. See Note 9 for additional information.
The Company operates on a 52 or 53 week fiscal calendar with the fourth quarter ending on the Monday nearest December 31. Fiscal year 2022 and 2020 consisted of 52 weeks ended on January 2, 2023 and December 28, 2020, respectively. Fiscal year 2021 consisted of 53 weeks ended on January 3, 2022, with the additional week included in the fourth quarter. All references to years relate to fiscal years unless otherwise noted.
Reclassifications
The Company currently has
Use of Estimates
The preparation of financial statements in conformity with accounting principles generally accepted in the United States of America (U.S. GAAP) requires management to make estimates and assumptions that affect the reported amounts of assets and liabilities and disclosure of contingent assets and liabilities at the date of the financial statements and the reported amount of revenues and expenses during the reporting period. These estimates and assumptions are based on management’s best estimates and judgment. Due, in part, to the on-going effects of the coronavirus (COVID-19) global pandemic on the Company and the conflict between Russia and Ukraine, the global economy and financial markets have been volatile, and both the pandemic and conflict has contributed to on-going disruptions in global supply chains, labor shortages, high inflation, and a potential recession, and there is a significant amount of uncertainty about the length and severity of the direct and indirect effects of the pandemic and the conflict. The Company has considered information available to it as of the date of issuance of these financial statements and is not aware of any specific events or circumstances that would require an update to its estimates or judgments, or a revision to the carrying value of its assets or liabilities. Management evaluates its estimates and assumptions on an ongoing basis using historical experience and other factors, including the economic environment, which management believes to be reasonable under the circumstances. Management adjusts such estimates and assumptions when facts and circumstances dictate. The actual results the Company experienced may differ materially and adversely from its estimates. To the extent there are material differences between the estimates and actual results, the Company’s future result of operations will be affected.
Principles of Consolidation
The consolidated financial statements include the accounts of TTM and its subsidiaries. All intercompany accounts and transactions have been eliminated in consolidation.
63
TTM TECHNOLOGIES, INC.
Notes to Consolidated Financial Statements — (Continued)
Foreign Currency Translation and Transactions
The functional currency of one of the Company’s subsidiaries is the Chinese Renminbi (RMB). Accordingly, assets and liabilities are translated into U.S. dollars using period-end exchange rates. Sales and expenses are translated at the average exchange rates in effect during the period. The resulting translation gains or losses are recorded as a component of accumulated other comprehensive income/(loss) in the consolidated statement of stockholders’ equity and the consolidated statement of comprehensive income. Net gains and losses resulting from foreign currency remeasurements and transactions are included in income as a component of other, net in the consolidated statements of operations and totaled $
Cash Equivalents
The Company considers highly liquid investments with insignificant interest rate risk and original maturities to the Company of three months or less to be cash equivalents.
Accounts Receivable and Allowance for Doubtful Accounts
Accounts receivable are reflected at estimated net realizable value, do not bear interest and do not generally require collateral. The Company performs credit evaluations of its customers and adjusts credit limits based upon payment history and the customer’s current creditworthiness. The Company maintains an allowance for doubtful accounts based upon a variety of factors. The Company considers both current and forecasted future economic conditions in determining the adequacy of its allowance for doubtful accounts.
The Company’s allowance for doubtful accounts was $
Inventories
Inventories are stated at the lower of cost (determined on a first-in, first-out or weighted average basis) or net realizable value. Assessments to value the inventory at the lower of the actual cost to purchase and/or manufacture the inventory, or net realizable value of the inventory, are based upon assumptions about future demand and market conditions. As a result of the Company’s assessments, when the net realizable value of inventory is less than the carrying value, the inventory cost is written down to the net realizable value and the write down is recorded as a charge to cost of goods sold.
Property, Plant and Equipment, Net
Property, plant and equipment are recorded at cost. Depreciation expense is computed using the straight-line method over the estimated useful lives of the assets. Assets recorded under leasehold improvements are amortized using the straight-line method over the lesser of their useful lives or the related lease term.
Land use rights |
|
|
Buildings and improvements |
|
|
Machinery and equipment |
|
|
Furniture and fixtures |
|
Upon retirement or other disposition of property, plant and equipment, the cost and related accumulated depreciation are removed from the accounts. The resulting gain or loss is included in the determination of operating income in the period incurred. Depreciation and amortization expense on property, plant and equipment was $
The Company capitalizes interest on borrowings during the active construction period of major capital projects. Capitalized interest is amortized over the average useful lives of such assets, which primarily consist of buildings and machinery and equipment. The Company capitalized interest costs of $
Major renewals and betterments are capitalized and depreciated over their estimated useful lives while minor expenditures for maintenance and repairs are included in operating income as incurred.
Goodwill
Goodwill represents the excess of purchase price of an acquisition over the fair value of net assets acquired. Goodwill is not amortized but instead is assessed for impairment, at a reporting unit level, annually and when events and circumstances warrant an evaluation. Goodwill is allocated to reporting units, which are operating segments or one level below the Company’s operating segments (the component level). Reporting units are determined by the discrete financial information available for the component and whether it is regularly reviewed by segment management. Components are aggregated into a single reporting unit if they share similar economic
64
TTM TECHNOLOGIES, INC.
Notes to Consolidated Financial Statements — (Continued)
characteristics. The Company evaluates its goodwill on an annual basis in the fourth quarter or more frequently if it believes indicators of impairment exist. The Company assesses qualitative factors to determine whether it is more likely than not that the fair value of a reporting unit is less than its carrying amount or performs a quantitative impairment test. When tested quantitatively, the Company compares the fair value of the applicable reporting unit with its carrying value. In making this assessment, management relies on a number of factors, including expected future operating results, business plans, economic projections, anticipated future cash flows, business trends and declines in the Company’s market capitalization. The Company estimates the fair values of its reporting units using a combination of the discounted cash flow (DCF) and market approaches. If the carrying amount of a reporting unit exceeds the reporting unit’s fair value, the amount by which the carrying value exceeds the fair value is recognized as an impairment loss. See Note 5 for further details.
Intangible Assets
Intangible assets include customer relationships, technology, and trade names which are being amortized over their estimated useful lives on a straight-line basis. The estimated useful lives of such intangibles range from
Impairment of Long-lived Assets
Long-lived tangible assets, including property, plant and equipment, assets held for sale, and definite-lived intangible assets, are reviewed for impairment whenever events or changes in circumstances indicate that the carrying value of the asset or asset groups may not be recoverable. The Company regularly evaluates whether events or circumstances have occurred that indicate possible impairment and relies on a number of factors, including expected future operating results, business plans, economic projections, and anticipated future cash flows. The Company uses an estimate of the future undiscounted net cash flows of the related asset or asset group over the remaining life in measuring whether the assets are recoverable. If the sum of the undiscounted cash flows is less than the carrying amount of the net assets, impairment is measured based on the difference between the net asset’s carrying value and estimated fair value. Fair value is determined through various valuation techniques, including cost-based, market and income approaches as considered necessary.
The Company classifies assets to be sold as assets held for sale when (i) Company management has approved and commits to a plan to sell the asset; (ii) the asset is available for immediate sale in its present condition and is ready for sale; (iii) an active program to locate a buyer and other actions required to sell the asset have been initiated; (iv) the sale of the asset is probable; (v) the asset is being actively marketed for sale at a price that is reasonable in relation to its current fair value; and (vi) it is unlikely that significant changes to the plan will be made or that the plan will be withdrawn. Assets classified as held for sale are recorded at the lower of the carrying amount or fair value less the cost to sell.
The Company classifies assets held for use when a decision to dispose of an asset or a business is made and the held for sale criteria are not met. In evaluating the recoverability of property and intangible assets subject to amortization, in a held for use business, the carrying value is first compared to the sum of the undiscounted cash flows expected to result from the use and eventual disposition. If the carrying value exceeds the undiscounted expected cash flows, then a fair value analysis is performed. An impairment charge is recognized if the carrying value exceeds the fair value.
Leases
The Company determines if an arrangement is a lease at inception. Operating leases are included in operating lease right-of-use (ROU) assets, and lease liabilities are included in other current liabilities and operating lease liabilities on the consolidated balance sheets. Finance lease ROU assets are included in property, plant and equipment, net and lease liabilities are included in other current liabilities and other long-term liabilities on the consolidated balance sheets.
ROU assets represent the Company’s right to use an underlying asset for the lease term and lease liabilities represent the Company’s obligation to make lease payments arising from the lease. Operating and finance lease ROU assets and liabilities are recognized at commencement date based on the present value of lease payments over the lease term. As most of the Company’s leases do not provide an implicit rate, the Company uses its incremental borrowing rate based on the information available at the commencement date in determining the present value of lease payments. The operating and finance lease ROU assets also include any lease payments made and excludes lease incentives. Lease terms may include options to extend or terminate the lease when it is reasonably certain that the Company will exercise that option. Operating lease expense is recognized on a straight-line basis over the lease term. Finance lease expense is recognized based on the effective interest method over the lease term.
The Company has lease agreements with lease and non-lease components and accounts for the lease and non-lease components as a single lease component.
Revenue Recognition
The Company derives revenues primarily from the sale of PCBs, engineered systems using customer-supplied engineering and design plans as well as long-term contracts related to the design and manufacture of highly sophisticated intelligence, surveillance and
65
TTM TECHNOLOGIES, INC.
Notes to Consolidated Financial Statements — (Continued)
communications solutions, RF and microwave/microelectronics components, assemblies, and subsystems. In the absence of a sales agreement, the Company’s standard terms and conditions apply. Revenue is recognized when control of the promised goods or services is transferred to the Company’s customers, in an amount that reflects the consideration to which it expects to be entitled in exchange for those goods or services. The Company applies a five-step approach in determining the amount and timing of revenue to be recognized: (1) identifying the contract with a customer; (2) identifying the performance obligations in the contract; (3) determining the transaction price; (4) allocating the transaction price to the performance obligations in the contract; and (5) recognizing revenue when the corresponding performance obligation is satisfied.
Revenue Streams
For PCBs and engineered systems, including pursuant to the Company’s long-term contracts related to the manufacture of highly sophisticated intelligence, surveillance and communications solutions, components, assemblies and subsystems, orders for products generally correspond to the production schedules of the Company’s customers and are supported with firm purchase orders. The Company’s customers have continuous control of the work in progress and finished goods throughout the PCB and engineered systems manufacturing process, as these are built to customer specifications with no alternative use, and there is an enforceable right to payment for work performed to date. As a result, the Company recognizes revenue progressively over time based on the extent of progress towards completion of the performance obligation. Revenue recognized is based on a cost method as it best depicts the transfer of control to the customer which takes place as we incur costs. Revenues are recorded proportionally as costs are incurred. For contracts in which anticipated total costs exceed the total expected revenue, an estimated loss is recognized in the period when identifiable. A provision for the entire amount of the estimated loss is recorded on a cumulative basis. The estimated remaining costs to complete for loss contracts as of January 2, 2023 was $
In addition, the Company manufactures components, assemblies, subsystems, and completed systems which service its RF&S Components and certain aerospace and defense customers. The Company recognizes revenue at a point in time upon transfer of control of the products to the customer. Point in time recognition was determined as the customer does not simultaneously receive or consume the benefits provided by the Company’s performance and the asset being manufactured has alternative uses to the Company.
Performance Obligations
Each distinct promise to transfer products is considered to be an identified performance obligation for which revenue is recognized upon transfer of control of the products to the customer. A contract’s transaction price is allocated to each distinct performance obligation and recognized as revenue when, or as, the performance obligation is satisfied. The majority of the Company's contracts have a single performance obligation as the promise to transfer the individual good or service is not separately identifiable from other promises in the contract and is, therefore, not distinct. As of January 2, 2023, the aggregate amount of the transaction price allocated to remaining performance obligations for the Company’s long-term contracts was $
66
TTM TECHNOLOGIES, INC.
Notes to Consolidated Financial Statements — (Continued)
Transaction Price
The Company provides customers a limited right of return for defective PCBs including components, subsystems and assemblies. Estimates of returns are treated as variable consideration for purposes of determining the transaction price. The Company accrues an estimate for sales returns and allowances progressively over time based on the extent of progress towards completion of the performance obligation using the Company’s judgment based on historical results and anticipated returns. To the extent actual experience varies from its historical experience, revisions to the sales returns and allowances accrual may be required. Sales returns and allowances are recorded as a reduction of revenue and included as a component of other current liabilities on the consolidated balance sheets. Shipping and handling fees and related freight costs and supplies associated with shipping products to customers are included as a component of cost of goods sold. Warranty-related services are not considered a separate performance obligation. Incremental warranty costs that are not related to sales returns are recorded in other current liabilities on the consolidated balance sheets and cost of goods sold on the consolidated statements of operations.
|
|
For the Year Ended |
|
|||||||||
|
|
January 2, |
|
|
January 3, |
|
|
December 28, |
|
|||
|
|
2023 |
|
|
2022 |
|
|
2020 |
|
|||
|
|
(In thousands) |
|
|||||||||
Balance at beginning of year |
|
$ |
|
|
$ |
|
|
$ |
|
|||
Addition charged as a reduction of sales |
|
|
|
|
|
|
|
|
|
|||
Deductions |
|
|
( |
) |
|
|
( |
) |
|
|
( |
) |
Effect of foreign currency exchange rates |
|
|
( |
) |
|
|
( |
) |
|
|
|
|
Balance at end of year |
|
$ |
|
|
$ |
|
|
$ |
|
|||
Contract Balances
Accounts receivable represents the Company’s unconditional right to receive consideration from its customer. Payments are generally due within 90 days or less of invoicing and do not include a significant financing component. To date, there have been no material credit losses on accounts receivable.
A contract asset is recognized when the Company has recognized revenue, but not issued an invoice for payment. Amounts will be invoiced when applicable contract terms, such as the achievement of specified milestones or product delivery, are met. Contract assets are transferred to receivables when the entitlement to payment becomes unconditional. Contract assets were $
A contract liability is recognized when the Company has received payment in advance for the future transfer of goods or services. The Company’s contract liabilities are reduced as the contract requirements are fulfilled. Contract liabilities were $
The remaining change in the balances of the Company’s contract assets and liabilities primarily results from timing differences between revenue recognition and customer billings and/or payments.
The Company has elected to account for shipping and handling activities as a fulfillment cost as permitted by the standard. All incremental customer contract acquisition costs are expensed as they are incurred as the amortization period of the asset that the Company otherwise would have recognized is one year or less in duration.
Disaggregated Revenue
Revenue from products and services transferred to customers over time and at a point in time accounted for
67
TTM TECHNOLOGIES, INC.
Notes to Consolidated Financial Statements — (Continued)
The following tables represent a disaggregation of revenue by principal end markets with the reportable segments:
|
|
For the Year Ended January 2, 2023 |
|
|
|||||||||
|
|
PCB |
|
|
RF&S Components |
|
|
Total |
|
|
|||
End Markets |
|
(In thousands) |
|
|
|||||||||
Aerospace and Defense |
|
$ |
|
|
$ |
|
|
$ |
|
|
|||
Automotive |
|
|
|
|
|
— |
|
|
|
|
|
||
Data Center Computing (2) |
|
|
|
|
|
|
|
|
|
|
|||
Medical/Industrial/Instrumentation |
|
|
|
|
|
|
|
|
|
|
|||
Networking |
|
|
|
|
|
|
|
|
|
|
|||
Other |
|
|
|
|
|
( |
) |
|
|
|
|
||
Total |
|
$ |
|
|
$ |
|
|
$ |
|
|
|||
|
|
For the Year Ended January 3, 2022 |
|
|
|||||||||||||
|
|
PCB |
|
|
RF&S Components |
|
|
Other (1) |
|
|
Total |
|
|
||||
End Markets |
|
(In thousands) |
|
|
|||||||||||||
Aerospace and Defense |
|
$ |
|
|
$ |
|
|
$ |
|
|
$ |
|
|
||||
Automotive |
|
|
|
|
|
— |
|
|
|
|
|
|
|
|
|||
Data Center Computing (2) |
|
|
|
|
|
|
|
|
— |
|
|
|
|
|
|||
Medical/Industrial/Instrumentation |
|
|
|
|
|
|
|
|
|
|
|
|
|
||||
Networking |
|
|
|
|
|
|
|
|
|
|
|
|
|
||||
Other |
|
|
|
|
|
|
|
|
( |
) |
|
|
|
|
|||
Total |
|
$ |
|
|
$ |
|
|
$ |
|
|
$ |
|
|
||||
|
|
For the Year Ended December 28, 2020 |
|
|
|||||||||||||
|
|
PCB |
|
|
RF&S Components |
|
|
Other (1) |
|
|
Total |
|
|
||||
End Markets |
|
(In thousands) |
|
|
|||||||||||||
Aerospace and Defense |
|
$ |
|
|
$ |
|
|
$ |
|
|
$ |
|
|
||||
Automotive |
|
|
|
|
|
— |
|
|
|
|
|
|
|
|
|||
Cellular Phone |
|
|
|
|
|
— |
|
|
|
— |
|
|
|
|
|
||
Data Center Computing (2) |
|
|
|
|
|
|
|
|
|
|
|
|
|
||||
Medical/Industrial/Instrumentation |
|
|
|
|
|
|
|
|
|
|
|
|
|
||||
Networking |
|
|
|
|
|
|
|
|
|
|
|
|
|
||||
Other |
|
|
|
|
|
|
|
|
( |
) |
|
|
|
|
|||
Total |
|
$ |
|
|
$ |
|
|
$ |
|
|
$ |
|
|
||||
Value Added and Sales Tax Collected from Customers
As a part of the Company’s normal course of business, value added and sales taxes are collected from customers. Such taxes collected are remitted, in a timely manner, to the appropriate governmental tax authority on behalf of the customer. Value added and sales taxes are excluded from reported revenues and costs of goods sold presented in the consolidated statements of operations and comprehensive income.
Stock-Based Compensation
The Company recognizes stock-based compensation expense in its consolidated financial statements for its incentive compensation plan awards. The incentive compensation plan awards include performance-based restricted stock units, restricted stock units, and stock options. The associated compensation expense for all awards is based on the grant date fair value of the awards. For performance-based restricted stock units, compensation expense also includes management’s periodic assessment of annual financial performance goals to be achieved. Compensation expense for the incentive compensation plan awards is recognized on a straight line basis over the vesting period of the awards. The fair value of performance-based restricted stock units is estimated on the grant date using a Monte Carlo simulation model based on the underlying common stock closing price as of the date of grant, stock price volatility, and risk-free interest rates. The fair value of restricted stock units is measured on the grant date based on the quoted closing market price of the Company’s common stock. The fair value of the stock options is estimated on the grant date using the Black-Scholes option
68
TTM TECHNOLOGIES, INC.
Notes to Consolidated Financial Statements — (Continued)
pricing model based on the underlying common stock closing price as of the date of grant, the expected term, stock price volatility, and risk-free interest rates.
Income Taxes
Income taxes are accounted for under the asset and liability method. Deferred income tax assets or liabilities are recognized for the future tax consequences attributable to differences between the financial statement carrying amounts of assets and liabilities and their respective tax bases and operating loss and tax credit carryforwards. Deferred income tax assets and liabilities are measured using enacted tax rates expected to apply to taxable income in the years in which those temporary differences are expected to be settled or realized. The effect on deferred income tax assets and liabilities of a change in tax rates is recognized in income in the period that includes the enactment date. Deferred income tax assets are reviewed for recoverability, and the Company records a valuation allowance to reduce its deferred income tax assets when it is more likely than not that all or some portion of the deferred income tax assets will not be realized.
The Company has various foreign subsidiaries formed or acquired to conduct or support its business outside the United States. The Company expects its earnings attributable to foreign subsidiaries will not be indefinitely reinvested except for certain subsidiaries, and we have established a deferred tax liability for foreign withholding taxes and the estimated federal/state tax impact. For those other companies with earnings currently being reinvested outside of the U.S.,
The Company recognizes the effect of income tax positions only if those positions are more likely than not to be sustained. Recognized income tax positions are measured at the largest amount that is greater than
Fair Value Measures
The Company measures at fair value certain of its financial and non-financial assets and liabilities by using a fair value hierarchy that prioritizes the inputs to valuation techniques used to measure fair value. Fair value is the price that would be received to sell an asset or paid to transfer a liability in an orderly transaction between market participants at the measurement date, essentially an exit price, based on the highest and best use of the asset or liability. The levels of the fair value hierarchy are:
Level 1 — Quoted market prices in active markets for identical assets or liabilities;
Level 2 — Significant other observable inputs (e.g., quoted prices for similar items in active markets, quoted prices for identical or similar items in markets that are not active, inputs other than quoted prices that are observable, such as interest rate and yield curves, and market-corroborated inputs); and
Level 3 — Unobservable inputs in which there is little or no market data, which require the reporting unit to develop its own assumptions.
Earnings Per Share
Basic earnings per common share excludes dilution and is computed by dividing net income by the weighted average number of common shares outstanding during the period. Diluted earnings per common share reflect the potential dilution that could occur if stock options, Convertible Senior Notes or other common stock equivalents were exercised or converted into common stock. The dilutive effect of stock options or other common stock equivalents is calculated using the treasury stock method. During the year ended December 28, 2020, the Company calculated the dilutive effect of Convertible Senior Notes using the treasury stock method because the Company repaid and settled the Convertible Senior Notes in cash.
Comprehensive Income
Comprehensive income includes changes to equity accounts that were not the result of transactions with stockholders. Comprehensive income is comprised of net income, changes in the cumulative foreign currency translation adjustments, pension obligation adjustments, and realized and unrealized gains or losses on hedged derivative instruments.
Loss Contingencies
The Company establishes an accrual for an estimated loss contingency when it is both probable that an asset has been impaired or that a liability has been incurred and the amount of the loss can be reasonably estimated. Any legal fees expected to be incurred in connection with a contingency are expensed as incurred.
69
TTM TECHNOLOGIES, INC.
Notes to Consolidated Financial Statements — (Continued)
Accounting for Retirement Benefit Plans
The Company accounts for its retirement benefit plans and postretirement and postemployment benefit obligations in accordance with ASC Topic 715, Compensation—Retirement Benefits. ASC Topic 715 requires the Company to recognize the overfunded or underfunded status of a defined benefit plan, measured as the difference between the fair value of plan assets and the plan's benefit obligation, as an asset or liability in its consolidated balance sheets and to recognize changes to that funded status in the year in which the changes occur through accumulated other comprehensive loss. ASC Topic 715 also requires measurement of the funded status of a plan as of the Company's consolidated balance sheet dates.
Recently Adopted and Issued Accounting Standards
Recently Adopted Accounting Standards
In November 2021, the Financial Accounting Standards Board (FASB) issued Accounting Standards Update (ASU) 2021-10, Government Assistance (Topic 832): Disclosures by Business Entities about Government Assistance, which provides guidance on disclosures for transactions with a government that are accounted for by applying a grant or contribution accounting model by analogy. The guidance is effective for fiscal years, and for interim periods within those fiscal years, beginning after December 15, 2021. Early adoption is permitted. The Company adopted this ASU and it did not have a material impact on the consolidated financial statements.
In October 2021, the FASB issued ASU 2021-08, Business Combinations (Topic 805): Accounting for Contract Assets and Contract Liabilities from Contracts with Customers, which requires that an acquirer recognize and measure contract assets and contract liabilities acquired in a business combination in accordance with Accounting Standards Codification (ASC) 606, Revenue from Contracts with Customers, as if it had originated the contracts. Prior to this ASU, an acquirer generally recognizes contract assets acquired and contract liabilities assumed that arose from contracts with customers at fair value on the acquisition date. The ASU is effective for fiscal years beginning after December 15, 2022, with early adoption permitted. The ASU is to be applied prospectively to business combinations occurring on or after the effective date of the amendment (or if adopted early as of an interim period, as of the beginning of the fiscal year that includes the interim period of early application). The Company early adopted ASU 2021-08 on
Recently Issued Accounting Standards Not Yet Adopted
In September 2022, the FASB issued ASU 2022-04, Liabilities - Supplier Finance Programs (Topic 450-50): Disclosure of Supplier Finance Program Obligations, that requires entities that use supplier finance programs in connection with the purchase of goods and services to disclose the key terms of the programs and information about obligations outstanding at the end of the reporting period, including a rollforward of those obligations. The guidance does not affect the recognition, measurement or financial statement presentation of supplier finance program obligations. The amendments are effective for all entities for fiscal years beginning after December 15, 2022 on a retrospective basis, including interim periods within those fiscal years, except for the requirement to disclose rollforward information, which is effective prospectively for fiscal years beginning after December 15, 2023. Early adoption is permitted upon issuance of the update. The Company is currently evaluating the new guidance to determine the impact it may have on its consolidated financial statements and related disclosures.
The Company leases some of its manufacturing and assembly plants, sales offices and equipment under non-cancellable operating leases and finance leases that expire at
70
TTM TECHNOLOGIES, INC.
Notes to Consolidated Financial Statements — (Continued)
The components of lease expense were as follows:
|
|
For the Year Ended |
|
|||||||||
|
|
January 2, 2023 |
|
|
January 3, 2022 |
|
|
December 28, 2020 |
|
|||
|
|
(In thousands) |
|
|||||||||
Operating lease cost |
|
$ |
|
|
$ |
|
|
$ |
|
|||
Variable lease cost |
|
|
|
|
|
|
|
|
|
|||
Short-term lease cost |
|
|
|
|
|
|
|
|
|
|||
Finance lease costs: |
|
|
|
|
|
|
|
|
|
|||
Amortization of right-of-use assets |
|
|
|
|
|
|
|
|
— |
|
||
Interest on lease liabilities |
|
|
|
|
|
|
|
|
— |
|
||
Supplemental cash flow information related to leases was as follows:
|
|
For the Year Ended |
|
|||||||||
|
|
January 2, 2023 |
|
|
January 3, 2022 |
|
|
December 28, 2020 |
|
|||
|
|
(In thousands) |
|
|||||||||
Cash paid for amounts included in the measurement of lease liabilities: |
|
|
|
|
|
|
|
|
|
|||
Operating cash flows for operating leases |
|
$ |
|
|
$ |
|
|
$ |
|
|||
Right-of-use assets obtained in exchange for new lease obligations: |
|
|
|
|
|
|
|
|
|
|||
Operating leases |
|
|
|
|
|
|
|
|
|
|||
Finance leases |
|
|
|
|
|
|
|
|
— |
|
||
Supplemental balance sheet information related to leases was as follows:
|
|
|
|
As of |
|
|||||
|
|
Balance Sheet Location |
|
January 2, 2023 |
|
|
January 3, 2022 |
|
||
|
|
|
|
(In thousands) |
|
|||||
Assets: |
|
|
|
|
|
|
|
|
||
Operating leases |
|
Operating lease right-of-use assets |
|
$ |
|
|
$ |
|
||
Finance leases |
|
|
|
|
|
|
|
|||
Total lease assets |
|
|
|
$ |
|
|
$ |
|
||
Liabilities: |
|
|
|
|
|
|
|
|
||
Current: |
|
|
|
|
|
|
|
|
||
Operating leases |
|
|
$ |
|
|
$ |
|
|||
Finance leases |
|
|
|
|
|
|
|
|||
Long-term: |
|
|
|
|
|
|
|
|
||
Operating leases |
|
Operating lease liabilities |
|
|
|
|
|
|
||
Finance leases |
|
|
|
|
|
|
|
|||
Total lease liabilities |
|
|
|
$ |
|
|
$ |
|
||
|
|
As of |
|
|||||
|
|
January 2, 2023 |
|
|
January 3, 2022 |
|
||
Weighted average remaining lease term (years): |
|
|
|
|
|
|
||
Operating leases |
|
|
|
|
||||
Finance leases |
|
|
|
|
||||
Weighted average discount rate: |
|
|
|
|
|
|
||
Operating leases |
|
|
% |
|
|
% |
||
Finance leases |
|
|
% |
|
|
% |
||
71
TTM TECHNOLOGIES, INC.
Notes to Consolidated Financial Statements — (Continued)
Maturities of lease liabilities were as follows:
|
|
Operating |
|
|
Finance |
|
||
|
|
(In thousands) |
|
|||||
Less than one year |
|
$ |
|
|
$ |
|
||
1 - 2 years |
|
|
|
|
|
|
||
2 - 3 years |
|
|
|
|
|
|
||
3 - 4 years |
|
|
|
|
|
|
||
4 - 5 years |
|
|
|
|
|
|
||
Thereafter |
|
|
|
|
|
|
||
Total lease payments |
|
|
|
|
|
|
||
Less imputed interest |
|
|
( |
) |
|
|
( |
) |
Total |
|
$ |
|
|
$ |
|
||
On
For the year ended January 2, 2023, bank fees and legal, accounting, and other professional service costs associated with the acquisition of $
Preliminary Purchase Price Allocation
The purchase price was allocated to tangible and intangible assets acquired, and liabilities assumed based on estimates of fair value at the date of the acquisition, June 27, 2022. The excess of the purchase price over the fair value of net assets acquired was allocated to goodwill. The fair values were based on management’s analysis, including work performed by third-party valuation specialists.
The fair values assigned are based on reasonable methods applicable to the nature of the assets acquired and liabilities assumed.
|
|
(In thousands) |
|
|
|
Accounts receivable |
|
$ |
|
|
|
Contract assets |
|
|
|
|
|
Inventories |
|
|
|
|
|
Prepaid expenses and other current assets |
|
|
|
|
|
Property, plant and equipment |
|
|
|
|
|
Operating lease right-of-use assets |
|
|
|
|
|
Goodwill |
|
|
|
|
|
Identifiable intangible assets |
|
|
|
|
|
Non-current deferred tax assets |
|
|
|
|
|
Deposits and other non-current assets |
|
|
|
|
|
Accounts payable |
|
|
( |
) |
|
Contract liabilities |
|
|
( |
) |
|
Accrued salaries, wages and benefits |
|
|
( |
) |
|
Other current liabilities |
|
|
( |
) |
|
Operating lease liabilities |
|
|
( |
) |
|
Other long-term liabilities |
|
|
( |
) |
|
Total |
|
$ |
|
|
|
The areas of the preliminary purchase price allocations that are not yet finalized relate to the fair values of identifiable intangible assets, deferred taxes, tax uncertainties, income taxes payable, and goodwill. As such, fair values may change during the allowable
72
TTM TECHNOLOGIES, INC.
Notes to Consolidated Financial Statements — (Continued)
measurement period, which is up to the point the Company obtains and analyzes information that existed as of the date of the acquisition necessary to determine the fair values of the assets acquired and liabilities assumed, but in no case to exceed more than one year from the date of acquisition. Any subsequent changes to the purchase price allocation during the measurement period will be recorded in the reporting period in which the adjustment amounts are determined. Any changes in the fair values of the assets acquired and liabilities assumed during the measurement period may result in material adjustments to goodwill.
Inventories
The Company acquired $
Property, Plant and Equipment
The fair value of property, plant and equipment was determined by utilizing two approaches: the cost and sales comparison approaches, each including management assumptions. Each approach assumes valuation of the property at the property’s highest and best use.
Identifiable Intangible Assets
Acquired identifiable intangible assets include customer relationships and trade names. As of January 2, 2023, the Company had not finalized the determination of fair values allocated to identifiable intangible assets. The Company used publicly available benchmarking information, as well as a variety of other assumptions, including market participant assumptions to determine the preliminary values.
Goodwill
Goodwill represents the excess of the purchase price over the fair value of assets acquired and liabilities assumed. The Company has integrated Telephonics into the PCB reportable segment. The excess purchase price over the fair value of assets acquired and liabilities assumed has been completely allocated to the PCB reportable segment. The Company believes that the acquisition of Telephonics will strengthen the Company’s differentiated position in the Aerospace and Defense market. The Company believes that these factors support the amount of goodwill recognized as a result of the purchase price paid for Telephonics, in relation to other acquired tangible and intangible assets. The goodwill acquired in the acquisition is not deductible for income tax purposes.
Results of Operations
Included in the consolidated statements of operations are $
Preliminary Pro forma Financial Information (Unaudited)
The unaudited preliminary pro forma financial information below gives effect to this acquisition as if it had occurred at the beginning of fiscal 2021, or December 29, 2020. The preliminary pro forma financial information presented includes the effects of adjustments related to the amortization of acquired identifiable intangible assets and decrease in inventory markup, depreciation of acquired fixed assets, and other non-recurring transactions costs directly associated with the acquisition such as legal, accounting and banking fees.
The preliminary pro forma financial information as presented below is for informational purposes only and is not necessarily indicative of the actual results that would have been achieved had the acquisition occurred at the beginning of the earliest period presented, or the results that may be achieved in future periods.
|
|
For the Year Ended |
|
|||||
|
|
January 2, 2023 |
|
|
January 3, 2022 |
|
||
|
|
(In thousands, except per share amounts) |
|
|||||
Net sales |
|
$ |
|
|
$ |
|
||
Net income |
|
|
|
|
|
|
||
Basic earnings per share |
|
$ |
|
|
$ |
|
||
Diluted earnings per share |
|
$ |
|
|
$ |
|
||
73
TTM TECHNOLOGIES, INC.
Notes to Consolidated Financial Statements — (Continued)
|
|
As of |
|
|||||
|
|
January 2, 2023 |
|
|
January 3, 2022 |
|
||
|
|
(In thousands) |
|
|||||
Inventories: |
|
|
|
|
|
|
||
Raw materials |
|
$ |
|
|
$ |
|
||
Work-in-process |
|
|
|
|
|
|
||
Finished goods |
|
|
|
|
|
|
||
|
|
$ |
|
|
$ |
|
||
Property, plant and equipment, net: |
|
|
|
|
|
|
||
Land and land use rights |
|
$ |
|
|
$ |
|
||
Buildings and improvements |
|
|
|
|
|
|
||
Machinery and equipment |
|
|
|
|
|
|
||
Furniture and fixtures and other |
|
|
|
|
|
|
||
Construction-in-progress |
|
|
|
|
|
|
||
|
|
|
|
|
|
|
||
Less: Accumulated depreciation |
|
|
( |
) |
|
|
( |
) |
|
|
$ |
|
|
$ |
|
||
Other current liabilities: |
|
|
|
|
|
|
||
Income taxes payable |
|
$ |
|
|
$ |
|
||
Sales return and allowances |
|
|
|
|
|
|
||
Interest |
|
|
|
|
|
|
||
Accrued facility operating costs |
|
|
|
|
|
|
||
Warranty |
|
|
|
|
|
|
||
Housing fund |
|
|
|
|
|
|
||
Operating leases |
|
|
|
|
|
|
||
Accrued professional fees |
|
|
|
|
|
|
||
Restructuring |
|
|
|
|
|
|
||
Derivative liabilities |
|
|
|
|
|
|
||
Other |
|
|
|
|
|
|
||
|
|
$ |
|
|
$ |
|
||
Other long-term liabilities: |
|
|
|
|
|
|
||
Deferred income taxes |
|
$ |
|
|
$ |
|
||
Customer deposits |
|
|
|
|
|
|
||
Finance leases |
|
|
|
|
|
|
||
Defined benefit pension plan liability |
|
|
|
|
|
|
||
Other |
|
|
|
|
|
|
||
|
|
$ |
|
|
$ |
|
||
On December 22, 2022, land, building, and relevant ancillary assets related to the Company’s former Shanghai E-MS (SH E-MS) manufacturing facility was expropriated by the Chinese government for a compensation fee of RMB
74
TTM TECHNOLOGIES, INC.
Notes to Consolidated Financial Statements — (Continued)
As of January 2, 2023 and January 3, 2022, goodwill by reportable segment was as follows:
|
|
PCB |
|
RF&S Components |
|
Total |
|
|||
|
|
(In thousands) |
|
|||||||
Balance as of January 3, 2022 |
|
|
|
|
|
|
|
|||
Goodwill |
|
$ |
|
$ |
|
$ |
|
|||
Accumulated impairment losses |
|
|
( |
) |
|
( |
) |
|
( |
) |
|
|
|
|
|
|
|
|
|||
Goodwill recognized during the year ended January 2, 2023 |
|
|
|
|
— |
|
|
|
||
Balance as of January 2, 2023 |
|
|
|
|
|
|
|
|||
Goodwill |
|
|
|
|
|
|
|
|||
Accumulated impairment losses |
|
|
( |
) |
|
( |
) |
|
( |
) |
|
|
$ |
|
$ |
|
$ |
|
|||
Goodwill recognized as a result of the acquisition of Telephonics is not yet finalized as of January 2, 2023. See Note 3 for additional information.
The Company evaluates its goodwill on an annual basis during its fourth fiscal quarter and at other times when events or changes in circumstances — such as significant adverse changes in the business climate or operating results or changes in management strategy, coupled with a decline in the market price of its stock and market capitalization — indicate that there may be a potential impairment.
During the fourth quarter of 2022, the Company performed its annual goodwill impairment test quantitatively, which was based on a combination of the income approach utilizing discounted cash flow analysis and the market approach, and concluded that the goodwill was
As of January 2, 2023 and January 3, 2022, the components of definite-lived intangibles were as follows:
|
|
Gross |
|
|
Accumulated |
|
|
Net |
|
|
Weighted |
|
||||
|
|
(In thousands) |
|
|
(In years) |
|
||||||||||
January 2, 2023 |
|
|
|
|
|
|
|
|
|
|
|
|
||||
Customer relationships |
|
$ |
|
|
$ |
( |
) |
|
$ |
|
|
|
|
|||
Technology |
|
|
|
|
|
( |
) |
|
|
|
|
|
|
|||
Acquired intangibles from acquisition |
|
|
|
|
|
|
|
|
|
|
|
|
||||
Customer relationships |
|
|
|
|
|
( |
) |
|
|
|
|
|
|
|||
Trade names |
|
|
|
|
|
( |
) |
|
|
|
|
|
|
|||
|
|
$ |
|
|
$ |
( |
) |
|
$ |
|
|
|
|
|||
|
|
|
|
|
|
|
|
|
|
|
|
|
||||
January 3, 2022 |
|
|
|
|
|
|
|
|
|
|
|
|
||||
Customer relationships |
|
$ |
|
|
$ |
( |
) |
|
$ |
|
|
|
|
|||
Technology |
|
|
|
|
|
( |
) |
|
|
|
|
|
|
|||
|
|
$ |
|
|
$ |
( |
) |
|
$ |
|
|
|
|
|||
Definite-lived intangibles are amortized using the straight-line method of amortization over the useful life. Amortization expense was $
75
TTM TECHNOLOGIES, INC.
Notes to Consolidated Financial Statements — (Continued)
Estimated aggregate amortization for definite-lived intangible assets for the next five years and thereafter is as follows:
|
|
(In thousands) |
|
|
2023 |
|
$ |
|
|
2024 |
|
|
|
|
2025 |
|
|
|
|
2026 |
|
|
|
|
2027 |
|
|
|
|
Thereafter |
|
|
|
|
|
|
$ |
|
|
The following table summarizes the long-term debt of the Company as of January 2, 2023 and January 3, 2022:
|
|
Interest Rate as of |
|
|
Principal |
|
|
Interest Rate as of |
|
|
Principal |
|
||||
|
|
(In thousands, except interest rates) |
|
|||||||||||||
Senior Notes due |
|
|
|
% |
$ |
|
|
|
|
% |
$ |
|
||||
Term Loan due |
|
|
|
|
|
|
|
|
|
|
|
|
||||
Asia ABL Revolving Loan due |
|
|
|
|
|
|
|
|
|
|
|
|
||||
|
|
|
|
|
|
|
|
|
|
|
|
|
||||
Less: Long-term debt unamortized discount |
|
|
|
|
|
( |
) |
|
|
|
|
|
( |
) |
||
Long-term debt unamortized debt |
|
|
|
|
|
( |
) |
|
|
|
|
|
( |
) |
||
|
|
|
|
|
|
|
|
|
|
|
|
|
||||
Less: current maturities |
|
|
|
|
|
( |
) |
|
|
|
|
|
— |
|
||
Long-term debt, less current maturities |
|
|
|
|
$ |
|
|
|
|
|
$ |
|
||||
|
|
|
|
|
|
|
|
|
|
|
|
|
||||
The fiscal calendar maturities of debt through 2027 and thereafter are as follows:
|
|
(In thousands) |
|
|
2023 |
|
$ |
|
|
2024 |
|
|
|
|
2025 |
|
|
— |
|
2026 |
|
|
— |
|
2027 |
|
|
— |
|
Thereafter |
|
|
|
|
|
|
$ |
|
|
As of January 2, 2023, the Company was in compliance with the financial covenants under the Term Loan Facility, Senior Notes due 2029 and ABL Revolving Loans.
Senior Notes due 2029
On March 10, 2021, the Company issued $
The Company used a portion of the net proceeds from the issuance of the Senior Notes due 2029 during the quarter ended March 29, 2021 to: (i) fund the early retirement of $
Convertible Senior Notes due 2020
The Convertible Senior Notes bore interest at a rate of
76
TTM TECHNOLOGIES, INC.
Notes to Consolidated Financial Statements — (Continued)
expenses were amortized to interest expense over the term of the Convertible Senior Notes. The Convertible Senior Notes matured and were repaid in cash in the amount of $
Convertible Note Hedge and Warrant Transaction: In connection with the issuance of the Convertible Senior Notes due 2020, the Company entered into a convertible note hedge and warrant transaction (Call Spread Transaction), with respect to the Company’s common stock. The convertible note hedge consisted of the Company’s option to purchase up to
The components of interest expense resulting from the Convertible Senior Notes for the year ended December 28, 2020 were as follows: $
Term Loan Facility
On April 18, 2018, the Company closed its $
Pursuant to the Term Loan Credit Agreement, the Company could reinvest the cash proceeds received from the sale of the Mobility business unit for a period of twelve months commencing September 3, 2020. If the proceeds were not reinvested during that time, the Company was required to use the proceeds to prepay the Term Loan. The Company used a portion of the cash proceeds to repay $
Based on certain parameters defined in the Term Loan Facility, including a First Lien Leverage Ratio, the Company may be required to make an additional principal payment on an annual basis beginning after fiscal year 2018, if the Company’s First Lien Leverage Ratio is greater than
Borrowings under the Term Loan Facility are subject to certain affirmative and negative covenants, including limitations on indebtedness, corporate transactions, investments, dispositions, and share payments.
Asset-Based Lending Agreements
In June 2019, the Company amended its U.S. Asset-Based Lending Credit Agreement (U.S. ABL) and its Asia Asset-Based Lending Credit Agreement (Asia ABL) (collectively the ABL Revolving Loans). The U.S. ABL credit facility was amended to extend its maturity to
The U.S. ABL consists of
77
TTM TECHNOLOGIES, INC.
Notes to Consolidated Financial Statements — (Continued)
The Asia ABL consists of
As of January 2, 2023, letters of credit in the amount of $
The Company is required to pay a commitment fee of
Debt Issuance and Debt Discount
As of January 2, 2023 and January 3, 2022, remaining unamortized debt discount and debt issuance costs for the Senior Notes due 2029 and Term Loan Facility are as follows:
|
|
As of January 2, 2023 |
|
|
As of January 3, 2022 |
||||||||||||||||||||
|
|
Debt |
|
|
Debt |
|
|
Effective |
|
|
Debt |
|
|
Debt |
|
|
Effective |
|
|
||||||
|
|
(In thousands, except interest rates) |
|||||||||||||||||||||||
Senior Notes due March 2029 |
|
$ |
|
|
$ |
— |
|
|
|
|
% |
$ |
|
|
$ |
— |
|
|
|
|
% |
||||
Term Loan due September 2024 |
|
|
|
|
|
|
|
|
|
|
|
|
|
|
|
|
|
|
|
||||||
|
|
$ |
|
|
$ |
|
|
|
|
|
$ |
|
|
$ |
|
|
|
|
|
||||||
|
|
|
|
|
|
|
|
|
|
|
|
|
|
|
|
|
|
|
|
||||||
The above debt discount and debt issuance costs are recorded as a reduction of the debt and are amortized into interest expense using an effective interest rate over the duration of the debt.
Remaining unamortized debt issuance costs for the ABL Revolving Loans of $
As of January 2, 2023, the remaining weighted average amortization period for all unamortized debt discount and debt issuance costs was
Loss on Extinguishment of Debt
During the year ended January 3, 2022, the Company recognized losses of $
The components of income (loss) from continuing operations before income taxes for the years ended January 2, 2023, January 3, 2022 and December 28, 2020 are:
|
|
For the Year Ended |
|
|||||||||
|
|
January 2, |
|
|
January 3, |
|
|
December 28, |
|
|||
|
|
(In thousands) |
|
|||||||||
United States |
|
$ |
( |
) |
|
$ |
( |
) |
|
$ |
( |
) |
Foreign |
|
|
|
|
|
|
|
|
|
|||
Income (loss) from continuing operations before income taxes |
|
$ |
|
|
$ |
|
|
$ |
( |
) |
||
78
TTM TECHNOLOGIES, INC.
Notes to Consolidated Financial Statements — (Continued)
The Company expects its earnings attributable to foreign subsidiaries will not be indefinitely reinvested, except for certain subsidiaries, and the Company has established a deferred tax liability of approximately $
The components of income tax (provision) benefit for the years ended January 2, 2023, January 3, 2022 and December 28, 2020 are:
|
|
For the Year Ended |
|
|||||||||
|
|
January 2, |
|
|
January 3, |
|
|
December 28, |
|
|||
|
|
(In thousands) |
|
|||||||||
Current (provision) benefit: |
|
|
|
|
|
|
|
|
|
|||
Federal |
|
$ |
( |
) |
|
$ |
( |
) |
|
$ |
( |
) |
State |
|
|
( |
) |
|
|
|
|
|
( |
) |
|
Foreign |
|
|
( |
) |
|
|
( |
) |
|
|
|
|
Total current |
|
|
( |
) |
|
|
( |
) |
|
|
|
|
Deferred (provision) benefit: |
|
|
|
|
|
|
|
|
|
|||
Federal |
|
|
( |
) |
|
|
|
|
|
|
||
State |
|
|
( |
) |
|
|
( |
) |
|
|
|
|
Foreign |
|
|
( |
) |
|
|
( |
) |
|
|
( |
) |
Total deferred |
|
|
( |
) |
|
|
( |
) |
|
|
|
|
Income tax (provision) benefit |
|
$ |
( | ) |
|
$ |
( | ) |
|
$ |
|
|
The following is a reconciliation of the provision for income taxes at the statutory federal income tax rate compared to the Company’s provision for income taxes for the years ended January 2, 2023, January 3, 2022 and December 28, 2020:
|
|
For the Year Ended |
|
|||||||||
|
|
January 2, |
|
|
January 3, |
|
|
December 28, |
|
|||
|
|
(In thousands) |
|
|||||||||
Statutory federal income tax (provision) benefit |
|
$ |
( |
) |
|
$ |
( |
) |
|
$ |
|
|
State income taxes, net of federal benefit and state tax credits |
|
|
|
|
|
|
|
|
( |
) |
||
IRC Section 162(m) limitation |
|
|
( |
) |
|
|
( |
) |
|
|
( |
) |
Stock options |
|
|
( |
) |
|
|
|
|
|
( |
) |
|
Global Intangible Low-Taxed Income |
|
|
( |
) |
|
|
( |
) |
|
|
( |
) |
Foreign tax credits |
|
|
|
|
|
|
|
|
|
|||
Permanently reinvested earnings assertion |
|
|
( |
) |
|
|
( |
) |
|
|
( |
) |
Foreign tax differential on foreign earnings & other permanent items |
|
|
|
|
|
|
|
|
|
|||
Change in valuation allowance |
|
|
( |
) |
|
|
( | ) |
|
|
( | ) |
Uncertain tax positions |
|
|
( |
) |
|
|
( |
) |
|
|
|
|
Federal research and development credits |
|
|
|
|
|
|
|
|
|
|||
Goodwill impairment |
|
|
— |
|
|
|
— |
|
|
|
( |
) |
Other |
|
|
( |
) |
|
|
|
|
|
( |
) |
|
Income tax (provision) benefit |
|
$ |
( | ) |
|
$ |
( | ) |
|
$ |
|
|
79
TTM TECHNOLOGIES, INC.
Notes to Consolidated Financial Statements — (Continued)
Deferred income taxes reflect the net tax effects of temporary differences between the carrying amounts of assets and liabilities for financial reporting purposes and the amounts used for income tax purposes.
|
|
As of |
|
|||||
|
|
January 2, |
|
|
January 3, |
|
||
|
|
(In thousands) |
|
|||||
Deferred income tax assets: |
|
|
|
|
|
|
||
Net operating loss carryforwards |
|
$ |
|
|
$ |
|
||
Reserves and accruals |
|
|
|
|
|
|
||
Interest expense limitation |
|
|
|
|
|
|
||
Unrealized (gain) loss on cash flow hedge |
|
|
( |
) |
|
|
|
|
Tax credit carryforwards |
|
|
|
|
|
|
||
Stock-based compensation |
|
|
|
|
|
|
||
Property, plant and equipment |
|
|
|
|
|
|
||
Other deferred income tax assets |
|
|
|
|
|
|
||
|
|
|
|
|
|
|
||
Less: valuation allowance |
|
|
( |
) |
|
|
( |
) |
|
|
|
|
|
|
|
||
Deferred income tax liabilities: |
|
|
|
|
|
|
||
Repatriation of foreign earnings |
|
|
( |
) |
|
|
( |
) |
Property, plant and equipment basis differences |
|
|
( |
) |
|
|
( |
) |
Goodwill and intangible amortization |
|
|
( |
) |
|
|
( |
) |
Other deferred income tax liabilities |
|
|
( |
) |
|
|
( |
) |
Net deferred income tax (liabilities) assets (included in Other |
|
$ |
( | ) |
|
$ |
|
|
As of January 2, 2023, the Company had the following net operating loss (NOL) carryforwards: $
In connection with the Company’s acquisition of Viasystems during 2015, there was more than a
A valuation allowance is provided when it is more likely than not that all or some portion of the deferred income tax assets will not be realized. The Company established a valuation allowance on its U.S. net deferred tax assets in the current year mainly due to cumulative book losses in the U.S. In addition, certain subsidiaries in various tax jurisdictions continue to have NOL carryforwards, which the Company has determined are not more likely than not to be utilized. As a result, a full valuation allowance has been recorded for these subsidiaries as of January 2, 2023. For the remaining net deferred income tax assets, management has determined that it is more likely than not that the results of future operations will generate sufficient income to realize the net deferred tax assets.
The following summarizes the activity in the Company’s valuation allowance for the years ended January 2, 2023, January 3, 2022 and December 28, 2020:
|
|
For the Year Ended |
|
|||||||||
|
|
January 2, |
|
|
January 3, |
|
|
December 28, |
|
|||
|
|
(In thousands) |
|
|||||||||
Balance at beginning of year |
|
$ |
|
|
$ |
|
|
$ |
|
|||
Additions charged to expense |
|
|
|
|
|
|
|
|
|
|||
Other reduction charged to expense |
|
|
( |
) |
|
|
( |
) |
|
|
( |
) |
Balance at end of year |
|
$ |
|
|
$ |
|
|
$ |
|
|||
80
TTM TECHNOLOGIES, INC.
Notes to Consolidated Financial Statements — (Continued)
Certain entities within China qualified for the high and new technology enterprise (HNTE) status enabling those entities to enjoy certain benefits, which were effective for the years ended January 2, 2023, January 3, 2022 and December 28, 2020.
|
|
For the Year Ended |
|
|||||||||
|
|
January 2, |
|
|
January 3, |
|
|
December 28, |
|
|||
|
|
(In thousands, except per share data) |
|
|||||||||
HNTE and R&D benefits |
|
$ |
|
|
$ |
|
|
$ |
|
|||
Basic shares |
|
|
|
|
|
|
|
|
|
|||
Diluted shares |
|
|
|
|
|
|
|
|
|
|||
Increases earnings per share: |
|
|
|
|
|
|
|
|
|
|||
Basic |
|
$ |
|
|
$ |
|
|
$ |
|
|||
Diluted |
|
$ |
|
|
$ |
|
|
$ |
|
|||
HNTE status expires for certain subsidiaries in 2023, but the Company expects to continue to file for renewal of such HNTE status for the foreseeable future.
A reconciliation of the beginning and ending amount of unrecognized tax benefits, exclusive of accrued interest and penalties, is as follows:
|
|
For the Year Ended |
|
|||||||||
|
|
January 2, |
|
|
January 3, |
|
|
December 28, |
|
|||
|
|
(In thousands) |
|
|||||||||
Balance at beginning of year |
|
$ |
|
|
$ |
|
|
$ |
|
|||
Additions based on tax positions related to the current year |
|
|
|
|
|
|
|
|
|
|||
Additions for tax positions of prior years |
|
|
|
|
|
|
|
|
|
|||
Reductions for tax positions of prior years |
|
|
( | ) |
|
|
( | ) |
|
|
( |
) |
Lapse of statute of limitations |
|
|
( |
) |
|
|
( |
) |
|
|
( |
) |
Balance at end of year |
|
$ |
|
|
$ |
|
|
$ |
|
|||
During the year ended January 2, 2023, the Company increased uncertain tax positions by $
As of January 2, 2023, and January 3, 2022, the Company recorded unrecognized tax benefits of $
As of January 2, 2023, the Company is open for (i) U.S. federal income tax examination for the period from
On January 19, 2020, the Company entered into a definitive equity interests purchase agreement for the sale of the Company’s Mobility business unit. The sale was completed on April 17, 2020 for a base purchase price of $
On April 18, 2020, the Company entered into a Transition Services Agreement (TSA) with the Purchaser pursuant to which the Purchaser is receiving certain services (the Services) to enable it to operate the Mobility business unit after the closing of the sale of the Mobility business unit. The Services include finance and accounting, human resources, legal and compliance, sales, information technology, and other corporate support services. Under the TSA, the Services were being provided at cost for a period of up to
81
TTM TECHNOLOGIES, INC.
Notes to Consolidated Financial Statements — (Continued)
will supply products to a few customers of the Company. There was no material impact of these agreements on the Company’s consolidated financial statements.
Further, on June 29, 2020, the Company entered into a Sales Force Agreement with the Purchaser pursuant to which the Company’s sales representatives assisted the Purchaser in selling PCBs manufactured by the Purchaser to certain customers for a commission for a period up to April 17, 2021. There was no material impact on the Company’s consolidated financial statements.
As the sale of the Company’s Mobility business unit represented a strategic shift that had a major effect on the Company’s operations and financial results, in accordance with the provisions of FASB authoritative guidance on the presentation of financial statements, Mobility business unit results are classified as discontinued operations in the consolidated statements of operations for 2020.
The following table summarizes the results of Mobility operations for fiscal year 2020 prior to sale:
|
|
For the Year Ended |
|
|
|
|
December 28, |
|
|
|
|
2020 |
|
|
|
|
(In thousands, except per share data) |
|
|
Net sales |
|
$ |
|
|
Cost of goods sold |
|
|
|
|
Gross profit |
|
|
|
|
Operating expenses: |
|
|
|
|
Selling and marketing |
|
|
|
|
General and administrative |
|
|
|
|
Research and development |
|
|
|
|
Amortization of definite-lived intangibles |
|
|
|
|
Restructuring charges |
|
|
|
|
Total operating expenses |
|
|
|
|
Operating income |
|
|
|
|
Other (expense) income: |
|
|
|
|
Interest expense |
|
|
( |
) |
Gain on sale of the Mobility business unit |
|
|
|
|
Other, net |
|
|
|
|
Total other income, net |
|
|
|
|
Income from discontinued operations |
|
|
|
|
Income tax provision |
|
|
( |
) |
Income from discontinued operations, |
|
$ |
|
|
|
|
|
|
|
Earnings per share from discontinued operations: |
|
|
|
|
Basic earnings per share |
|
$ |
|
|
Diluted earnings per share |
|
$ |
|
|
Depreciation expense related to the discontinued operations for the year ended December 28, 2020 was $
During the year ended December 28, 2020, the Company’s income tax expense related to the discontinued operations was impacted by a net discrete tax expense of $
82
TTM TECHNOLOGIES, INC.
Notes to Consolidated Financial Statements — (Continued)
Proceeds from the sale of the Company’s Mobility business unit have been presented in the consolidated statements of cash flows within net cash provided by investing activities from discontinued operations.
Net proceeds from the sale of the Mobility business unit (1) |
|
$ |
|
|
|
|
|
|
|
Mobility business unit assets: |
|
|
|
|
Cash and cash equivalents |
|
|
|
|
Restricted cash |
|
|
|
|
Accounts receivable, net |
|
|
|
|
Contract assets |
|
|
|
|
Inventories |
|
|
|
|
Prepaid expenses and other current assets |
|
|
|
|
Property, plant and equipment, net |
|
|
|
|
Goodwill |
|
|
|
|
Definite-lived intangibles, net |
|
|
|
|
Deposits and other non-current assets |
|
|
|
|
Total Mobility business unit assets |
|
|
|
|
|
|
|
|
|
Mobility business unit liabilities: |
|
|
|
|
Accounts payable |
|
|
|
|
Accrued salaries, wages and benefits |
|
|
|
|
Other current liabilities |
|
|
|
|
Other long-term liabilities |
|
|
|
|
Total Mobility business unit liabilities |
|
|
|
|
|
|
|
|
|
Derecognition of foreign currency translation adjustments and unrealized losses |
|
|
|
|
|
|
|
|
|
Other transaction costs incurred as part of the sale of the Mobility business unit (2) |
|
|
|
|
|
|
|
|
|
Gain on sale of the Mobility business unit before income taxes |
|
$ |
|
|
83
TTM TECHNOLOGIES, INC.
Notes to Consolidated Financial Statements — (Continued)
The following provides a summary of the components of accumulated other comprehensive loss, net of tax as of January 2, 2023, January 3, 2022 and December 28, 2020:
|
|
Foreign |
|
|
Pension Obligation |
|
|
(Losses) Gains |
|
|
Total |
|
||||
|
|
(In thousands) |
|
|||||||||||||
Ending balance as of December 28, 2020 |
|
$ |
( |
) |
|
$ |
( |
) |
|
$ |
( |
) |
|
$ |
( |
) |
Other comprehensive income (loss) before |
|
|
|
|
|
|
|
|
( | ) |
|
|
|
|||
Amounts reclassified from accumulated |
|
|
— |
|
|
|
— |
|
|
|
|
|
|
|
||
Net year to date other comprehensive |
|
|
|
|
|
|
|
|
|
|
|
|
||||
Ending balance as of January 3, 2022 |
|
|
( |
) |
|
|
( |
) |
|
|
( |
) |
|
|
( |
) |
Other comprehensive (loss) income |
|
|
( |
) |
|
|
|
|
|
( | ) |
|
|
( | ) |
|
Amounts reclassified from accumulated |
|
|
— |
|
|
|
— |
|
|
|
|
|
|
|
||
Net year to date other comprehensive (loss) |
|
|
( |
) |
|
|
|
|
|
|
|
|
|
|||
Ending balance as of January 2, 2023 |
|
$ |
( |
) |
|
$ |
|
|
$ |
( | ) |
|
$ |
( |
) |
|
In the normal course of business, the Company extends credit to its customers. Some customers to whom the Company extends credit are located outside the United States. The Company performs ongoing credit evaluations of customers, does not require collateral, and considers the credit risk profile of the entity from which the receivable is due in further evaluating collection risk. As of January 2, 2023, there was
The Company’s customers include both OEMs and EMS companies. The Company’s OEM customers often direct a significant portion of their purchases through EMS companies. While the Company’s customers include both OEM and EMS providers, the Company measures customer concentration based on OEM companies, as they are the ultimate end customers.
For each of the years ended January 2, 2023 and January 3, 2022,
84
TTM TECHNOLOGIES, INC.
Notes to Consolidated Financial Statements — (Continued)
The Company measures at fair value its financial and non-financial assets by using a fair value hierarchy that prioritizes the inputs to valuation techniques used to measure fair value. Fair value is the price that would be received to sell an asset or paid to transfer a liability in an orderly transaction between market participants at the measurement date, essentially an exit price, based on the highest and best use of the asset or liability.
The carrying amount and estimated fair value of the Company’s financial instruments as of January 2, 2023 and January 3, 2022 were as follows:
|
|
As of |
|
|
As of |
|
||||||||||
|
|
January 2, 2023 |
|
|
January 3, 2022 |
|
||||||||||
|
|
Carrying |
|
|
Fair Value |
|
|
Carrying |
|
|
Fair Value |
|
||||
|
|
(In thousands) |
|
|||||||||||||
|
$ |
— |
|
|
$ |
— |
|
|
$ |
|
|
$ |
|
|||
Derivative liabilities, current |
|
|
|
|
|
|
|
|
|
|
|
|
||||
Senior Notes due March 2029 |
|
|
|
|
|
|
|
|
|
|
|
|
||||
Term Loan due September 2024 |
|
|
|
|
|
|
|
|
|
|
|
|
||||
ABL Revolving Loans |
|
|
|
|
|
|
|
|
|
|
|
|
||||
The fair value of the derivative instruments was determined using pricing models developed based on the LIBOR swap rate, foreign currency exchange rates, and other observable market data, including quoted market prices, as appropriate using Level 2 inputs. The values were adjusted to reflect non-performance risk of both the counterparty and the Company, as necessary.
The fair value of the long-term debt was estimated based on quoted market prices or discounting the debt over its life using current market rates for similar debt as of January 2, 2023 and January 3, 2022, which are considered Level 2 inputs.
The fair value of plan assets in the defined benefit plan of $
As of January 2, 2023 and January 3, 2022, the Company’s other financial instruments included cash and cash equivalents, accounts receivable, contract assets, accounts payable, and contract liabilities. The carrying amount of these instruments approximates fair value. The Company’s cash and cash equivalents as of January 2, 2023 consisted of $
The majority of the Company’s non-financial assets and liabilities, which include goodwill, intangible assets, inventories, and property, plant and equipment, are not required to be carried at fair value on a recurring basis. However, if certain triggering events occur (or are tested at least annually in the case of goodwill) such that a non-financial instrument is required to be evaluated for impairment, based upon a comparison of the non-financial instrument’s fair value to its carrying value, an impairment is recorded to reduce the carrying value to the fair value, if the carrying value exceeds the fair value.
Legal Matters
The Company is subject to various legal matters, which it considers normal for its business activities. While the Company currently believes that the amount of any reasonably possible loss for known matters would not be material to the Company’s financial condition, the outcome of these actions is inherently difficult to predict. In the event of an adverse outcome, the ultimate potential loss could have a material adverse effect on the Company’s financial condition or results of operations in a particular period. The Company has accrued amounts for its loss contingencies which are probable and estimable as of January 2, 2023 and January 3, 2022. However, these amounts are not material to the consolidated financial statements of the Company.
Offset Agreements
Following the acquisition of Telephonics on June 27, 2022, the Company has and may continue to enter into industrial cooperation agreements, sometimes referred to as offset agreements, as a condition to obtaining orders for products and services from customers in foreign countries. These agreements are intended to promote investment in the applicable country, and the Company’s obligations under these agreements may be satisfied through activities that do not require the Company to use cash, including transferring technology or providing manufacturing and other consulting support. The obligations under these agreements may also be satisfied through the use of cash for activities such as purchasing supplies from in-country vendors, setting up support centers, research and development investments, acquisitions, and building or leasing facilities for in-country operations, if applicable. The amount of the offset requirement is determined by contract value awarded and negotiated percentages with customers. As of January 2, 2023, the Company had outstanding offset agreements of approximately $
85
TTM TECHNOLOGIES, INC.
Notes to Consolidated Financial Statements — (Continued)
several years and in some cases provide for penalties in the event the Company fails to perform in accordance with contract requirements. Historically, the Company has not paid any such penalties, and as of January 2, 2023, no such penalties have been paid.
Incentive Compensation Plan
The Company maintains a 2014 Incentive Compensation Plan (the Plan), which, with subsequent amendments, allows for issuance of up to
The Plan provides for the grant of performance-based restricted stock units (PRUs), restricted stock units (RSUs), and stock appreciation rights. The exercise price for awards is determined by the compensation committee of the board of directors. Each award shall vest and expire as determined by the compensation committee of the board of directors, with PRUs and RSUs generally vesting over
As of January 2, 2023,
Performance-based Restricted Stock Units
The Company maintains a long-term incentive program for executives that provides for the issuance of PRUs, representing hypothetical shares of the Company’s common stock that may be issued. Under the PRU program, a target number of PRUs is awarded at the beginning of each
Under the PRU program, financial goals are set at the beginning of each fiscal year and performance is reviewed at the end of that year. The percentage to be applied to each participant’s target award ranges from
At the end of the three-year performance period, the total units earned, if any, are adjusted by applying a modifier, ranging from
The TSR modifier is intended to ensure that there are limited or no payouts under the PRU program if the Company’s stock performance is significantly below the median TSR of a group of peer companies selected by the Company’s compensation committee over the three-year performance period. Where the annual financial goals have been met and where there has been strong relative TSR performance over the three-year performance period, the PRU program may provide substantial rewards to participants with a maximum payout of
Recipients of PRU awards generally must remain employed by the Company on a continuous basis through the end of the three-year performance period in order to receive any amount of the PRUs covered by that award. In events such as death, disability or retirement, the recipient may be entitled to pro-rata amounts of PRUs as defined in the Plan. Target shares subject to PRU awards do not have voting rights of common stock until earned and issued following the end of the three-year performance period.
86
TTM TECHNOLOGIES, INC.
Notes to Consolidated Financial Statements — (Continued)
The Company records stock-based compensation expense for PRU awards granted based on management’s periodic assessment of the annual financial performance goals to be achieved. As of January 2, 2023, management determined that vesting of the PRU awards was probable.
|
|
Shares |
|
|
Weighted |
|
||
|
|
(In thousands) |
|
|
|
|
||
Outstanding shares as of January 3, 2022 |
|
|
|
|
$ |
|
||
Granted |
|
|
|
|
|
|
||
Vested |
|
|
( |
) |
|
|
|
|
Forfeited / cancelled |
|
|
( |
) |
|
|
|
|
Change in units due to annual performance achievement |
|
|
|
|
|
|
||
Outstanding shares as of January 2, 2023 |
|
|
|
|
$ |
|
||
87
TTM TECHNOLOGIES, INC.
Notes to Consolidated Financial Statements — (Continued)
The fair value of PRUs granted is calculated using a Monte Carlo simulation model, as the TSR modifier contains a market condition.
|
|
For the Year Ended |
|
|||||||||
|
|
January 2, 2023 (1) |
|
|
January 3, 2022 (2) |
|
|
December 28, 2020 (3) |
|
|||
Weighted-average fair value |
|
$ |
|
|
$ |
|
|
$ |
|
|||
Risk-free interest rate |
|
|
% |
|
|
% |
|
|
% |
|||
Dividend yield |
|
|
— |
|
|
|
— |
|
|
|
— |
|
Expected volatility |
|
|
% |
|
|
% |
|
|
% |
|||
The risk-free interest rate for the expected term of PRUs is based on the U.S. Treasury yield curve in effect at the time of grant. Expected volatility is calculated using the Company’s historical stock price.
Restricted Stock Units
RSU activity for the year ended January 2, 2023 was as follows:
|
|
Shares |
|
|
Weighted |
|
||
|
|
(In thousands) |
|
|
|
|
||
Non-vested RSUs outstanding as of January 3, 2022 |
|
|
|
|
$ |
|
||
Granted |
|
|
|
|
|
|
||
Vested |
|
|
( |
) |
|
|
|
|
Forfeited |
|
|
( |
) |
|
|
|
|
Non-vested RSUs outstanding as of January 2, 2023 |
|
|
|
|
$ |
|
||
Vested and expected to vest through |
|
|
|
|
$ |
|
||
The fair value of the Company’s RSUs is determined based upon the closing common stock price on the grant date. The weighted average fair value per unit of RSUs granted was $
Stock Options
As of January 2, 2023, stock options outstanding was
Stock-based Compensation Expense and Unrecognized Compensation Costs
For the years ended January 2, 2023, January 3, 2022 and December 28, 2020, the amounts recognized in the consolidated statements of operations with respect to the stock-based compensation plan are as follows:
|
|
For the Year Ended |
|
|||||||||
|
|
January 2, |
|
|
January 3, |
|
|
December 28, |
|
|||
|
|
2023 |
|
|
2022 |
|
|
2020 |
|
|||
|
|
(In thousands) |
|
|||||||||
Cost of goods sold |
|
$ |
|
|
$ |
|
|
$ |
|
|||
Selling and marketing |
|
|
|
|
|
|
|
|
|
|||
General and administrative |
|
|
|
|
|
|
|
|
|
|||
Research and development |
|
|
|
|
|
|
|
|
|
|||
Stock-based compensation expense recognized |
|
$ |
|
|
$ |
|
|
$ |
|
|||
88
TTM TECHNOLOGIES, INC.
Notes to Consolidated Financial Statements — (Continued)
The following is a summary of total unrecognized compensation costs as of January 2, 2023:
|
|
Unrecognized Stock-Based Compensation Cost |
|
|
Remaining Weighted Average |
|
||
|
|
(In thousands) |
|
|
(In years) |
|
||
RSU awards |
|
$ |
|
|
|
|
||
PRU awards |
|
|
|
|
|
|
||
Stock options |
|
|
|
|
|
— |
|
|
|
|
$ |
|
|
|
|
||
As of January 2, 2023, the Company has several defined contribution plans.
The Company also maintains a deferred compensation plan (the Compensation Plan). The Compensation Plan is an unfunded, nonqualified deferred compensation plan and is limited to selected employees, including the Company’s named executive officers and directors. The Compensation Plan allows participants to defer up to
Following the acquisition of Anaren on April 18, 2018, the Company has a noncontributory defined benefit pension plan covering eligible employees. Effective August 15, 2000, the plan was closed for new participants. Benefits under this plan generally are based on the employee’s years of service and compensation. Effective December 31, 2019, the plan is frozen as to further participation and to further benefit accruals.
As of January 2, 2023 and January 3, 2022, the funded status of the accumulated benefit obligation was
The following tables set forth the changes in benefit obligation and the plan assets in the defined benefit plan described above for the years ended January 2, 2023, January 3, 2022 and December 28, 2020:
|
|
For the Year Ended |
|
|||||||||
Change in Benefit Obligations |
|
January 2, |
|
|
January 3, |
|
|
December 28, |
|
|||
|
|
(In thousands) |
|
|||||||||
Benefit obligation at beginning of year |
|
$ |
( |
) |
|
$ |
( |
) |
|
$ |
( |
) |
Interest cost |
|
|
( |
) |
|
|
( |
) |
|
|
( |
) |
Actuarial gain (loss) |
|
|
|
|
|
|
|
|
( |
) |
||
Benefits paid |
|
|
|
|
|
|
|
|
|
|||
Benefit obligation at end of year |
|
$ |
( |
) |
|
$ |
( |
) |
|
$ |
( |
) |
Accumulated benefit obligation at end of year |
|
$ |
|
|
$ |
|
|
$ |
|
|||
|
|
For the Year Ended |
|
|||||||||
Change in Plan Assets |
|
January 2, |
|
|
January 3, |
|
|
December 28, |
|
|||
|
|
(In thousands) |
|
|||||||||
Fair value of plan assets at beginning of year |
|
$ |
|
|
$ |
|
|
$ |
|
|||
Actual return on plan assets |
|
|
( |
) |
|
|
|
|
|
|
||
Employer contributions |
|
|
|
|
|
|
|
|
|
|||
Benefits paid |
|
|
( |
) |
|
|
( |
) |
|
|
( |
) |
Fair value of plan assets at end of year |
|
$ |
|
|
$ |
|
|
$ |
|
|||
Unfunded status |
|
$ |
( |
) |
|
$ |
( |
) |
|
$ |
( |
) |
Net amount recognized |
|
$ |
( |
) |
|
$ |
( |
) |
|
$ |
( |
) |
89
TTM TECHNOLOGIES, INC.
Notes to Consolidated Financial Statements — (Continued)
Amounts before income tax effect recognized in the consolidated balance sheets consists of the following:
|
|
As of |
|
|
|||||
|
|
January 2, |
|
|
January 3, |
|
|
||
|
|
(In thousands) |
|
|
|||||
Other long-term liabilities |
|
$ |
( |
) |
|
$ |
( |
) |
|
Net amount recognized |
|
$ |
( |
) |
|
$ |
( |
) |
|
Amounts before income tax effect included in accumulated other comprehensive loss as of January 2, 2023 and
January 3, 2022 are as follows:
|
|
January 2, |
|
|
January 3, |
|
|
||
|
|
(In thousands) |
|
|
|||||
Net actuarial gain (loss) |
|
$ |
|
|
$ |
( |
) |
|
|
Accumulated other comprehensive gain (loss) |
|
$ |
|
|
$ |
( |
) |
|
|
The net actuarial gain during the year ended January 2, 2023 was primarily driven by a decrease in liabilities due to a higher assumed discount rate.
The components included in the net periodic benefit cost and the increase in minimum liability included in other comprehensive loss for the years ended January 2, 2023, January 3, 2022 and December 28, 2020 are as follows:
|
|
January 2, |
|
|
January 3, |
|
|
December 28, |
|
|
|||
|
|
(In thousands) |
|
|
|||||||||
Interest cost |
|
$ |
|
|
$ |
|
|
$ |
|
|
|||
|
|
( |
) |
|
|
( |
) |
|
|
( |
) |
|
|
|
|
— |
|
|
|
|
|
|
— |
|
|
||
Net periodic benefit cost |
|
$ |
( |
) |
|
$ |
( |
) |
|
$ |
( |
) |
|
The weighted-average assumptions used to determine benefit obligations for this plan as of January 2, 2023, January 3, 2022 and December 28, 2020 are as follows:
|
|
January 2, |
|
|
January 3, |
|
|
December 28, |
|
|
|||
Discount rate |
|
|
|
% |
|
|
% |
|
|
% |
|||
Expected return on plan assets |
|
|
|
|
|
|
|
|
|
|
|||
The Company determines the discount rate assumption based on the internal rate of return for a portfolio of high quality bonds, with a minimum rating of Moody's AA Corporate and with maturities that are consistent with the projected future cash flow obligations.
The weighted-average assumptions used to determine net periodic benefit cost for the years ended January 2, 2023, January 3, 2022 and December 28, 2020 are as follows:
|
|
For the Year Ended |
|
|
|||||||||
|
|
January 2, |
|
|
January 3, |
|
|
December 28, |
|
|
|||
Discount rate |
|
|
|
% |
|
|
% |
|
|
% |
|||
Expected return on plan assets |
|
|
|
|
|
|
|
|
|
|
|||
The Company determines the expected long-term rate of return on plan assets based upon recommendations from its pension plan's investment advisors and using an allocation approach that considers diversification and rebalancing for a portfolio of assets invested over a long-term time horizon. The approach relies on the historical returns of the plan's portfolio and relationships between equities and fixed income investments, consistent with the widely accepted capital market principle that a diversified portfolio with a larger allocation to equity investments can generate a greater return over the long run. Additionally, the Company monitors the mix of investments in its portfolio to ensure alignment with its expected long-term pension obligations. The Company reviews the expected long-term rate of return annually and revises it as appropriate.
Investments shall be made pursuant to the following objectives: 1) preserve the purchasing power of the plan’s assets adjusted for inflation; 2) provide long-term growth; and 3) avoid significant volatility. Asset allocation shall be determined based on a long-term
90
TTM TECHNOLOGIES, INC.
Notes to Consolidated Financial Statements — (Continued)
target allocation having
The target allocation for 2023 and the plan asset allocation at the end of 2022 and 2021, in percentages, by asset category are as follows:
|
|
Target Allocation 2023 |
|
|
|
January 2, 2023 |
|
|
|
January 3, 2022 |
|
|
|||
Equity securities (1) |
|
|
|
% |
|
|
|
% |
|
|
|
% |
|||
Debt securities (2) |
|
|
|
|
|
|
|
|
|
|
|
|
|||
Cash and cash equivalents (3) |
|
|
|
|
|
|
|
|
|
|
|
|
|||
Total |
|
|
|
% |
|
|
|
% |
|
|
|
% |
|||
The following table summarizes plan assets measured at fair value as of January 2, 2023 and January 3, 2022:
|
|
As of |
|
|||||||||||||
|
|
January 2, 2023 |
|
|||||||||||||
|
|
Total |
|
|
Quoted Prices in |
|
|
Significant |
|
|
Significant |
|
||||
|
|
(In thousands) |
|
|||||||||||||
Equity securities (1) |
|
$ |
|
|
$ |
|
|
$ |
— |
|
|
$ |
— |
|
||
Debt securities (2) |
|
|
|
|
|
|
|
|
— |
|
|
|
— |
|
||
Cash and cash equivalents (3) |
|
|
|
|
|
|
|
|
— |
|
|
|
— |
|
||
Total |
|
$ |
|
|
$ |
|
|
$ |
— |
|
|
$ |
— |
|
||
|
|
|
|
|
|
|
|
|
|
|
|
|
||||
|
|
As of |
|
|||||||||||||
|
|
January 3, 2022 |
|
|||||||||||||
|
|
Total |
|
|
Quoted Prices in |
|
|
Significant |
|
|
Significant |
|
||||
|
|
(In thousands) |
|
|||||||||||||
Equity securities (1) |
|
$ |
|
|
$ |
|
|
$ |
— |
|
|
$ |
— |
|
||
Debt securities (2) |
|
|
|
|
|
|
|
|
— |
|
|
|
— |
|
||
Cash and cash equivalents (3) |
|
|
|
|
|
|
|
|
— |
|
|
|
— |
|
||
Total |
|
$ |
|
|
$ |
|
|
$ |
— |
|
|
$ |
— |
|
||
The Company seeks to maximize medium to long-term returns of the overall pension plan assets with reasonable levels of investment risk. One element of controlling the overall investment risk is through diversification of asset allocation, among domestic and international equity and debt instruments. The plan's equity investments include foreign and domestic exchange traded equities across a range of industries and countries, but primarily in the domestic markets. The plan's debt securities are primarily invested in government and corporate issuers primarily in the domestic market.
The following benefit payments, which reflect expected future service, as appropriate, are expected to be paid:
|
|
(In thousands) |
|
|
2023 |
|
$ |
|
|
2024 |
|
|
|
|
2025 |
|
|
|
|
2026 |
|
|
|
|
2027 |
|
|
|
|
Years 2028 through 2032 |
|
|
|
|
91
TTM TECHNOLOGIES, INC.
Notes to Consolidated Financial Statements — (Continued)
The board of directors has the authority, without action by stockholders, to designate and issue preferred stock in one or more series. The board of directors may also designate the rights, preferences and privileges of each series of preferred stock, any or all of which may be superior to the rights of the common stock. As of January 2, 2023,
The reportable segments shown below are the Company’s segments for which separate financial information is available and upon which operating results are evaluated by the chief operating decision maker to assess performance and to allocate resources. As of the fourth quarter of 2022, the Company reassessed its reportable segments, which resulted in the inclusion of Telephonics into the PCB reportable segment. On April 29, 2020, the Company announced the restructuring of its E-M Solutions business unit. In prior periods, the Company’s E-M Solutions business unit consisted of
The Company, including the chief operating decision maker, evaluates segment performance based on reportable segment income, which is operating income before amortization of intangibles. Interest expense and interest income are not presented by segment since they are not included in the measure of segment profitability reviewed by the chief operating decision maker. All inter-segment transactions have been eliminated.
|
|
For the Year Ended |
|
|||||||||
|
|
January 2, 2023 |
|
|
January 3, 2022 |
|
|
December 28, 2020 |
|
|||
|
|
(In thousands) |
|
|||||||||
Net Sales: |
|
|
|
|
|
|
|
|
|
|||
PCB |
|
$ |
|
|
$ |
|
|
$ |
|
|||
RF&S Components |
|
|
|
|
|
|
|
|
|
|||
Other (1) |
|
|
— |
|
|
|
|
|
|
|
||
Total net sales |
|
$ |
|
|
$ |
|
|
$ |
|
|||
Operating Segment Income: |
|
|
|
|
|
|
|
|
|
|||
PCB |
|
$ |
|
|
$ |
|
|
$ |
|
|||
RF&S Components |
|
|
|
|
|
|
|
|
( |
) |
||
Corporate and Other (1) |
|
|
( |
) |
|
|
( |
) |
|
|
( |
) |
Total operating segment income |
|
|
|
|
|
|
|
|
|
|||
Amortization of definite-lived intangibles (2) |
|
|
( |
) |
|
|
( |
) |
|
|
( |
) |
Total operating income |
|
|
|
|
|
|
|
|
|
|||
Total other expense, net |
|
|
( |
) |
|
|
( |
) |
|
|
( |
) |
Income (loss) before income taxes |
|
$ |
|
|
$ |
|
|
$ |
( |
) |
||
|
|
For the Year Ended |
|
|||||||||
|
|
January 2, 2023 |
|
|
January 3, 2022 |
|
|
December 28, 2020 |
|
|||
|
|
(In thousands) |
|
|||||||||
Depreciation Expense: |
|
|
|
|
|
|
|
|
|
|||
PCB |
|
$ |
|
|
$ |
|
|
$ |
|
|||
RF&S Components |
|
|
|
|
|
|
|
|
|
|||
Corporate and Other (1) |
|
|
|
|
|
|
|
|
|
|||
Total depreciation expense |
|
$ |
|
|
$ |
|
|
$ |
|
|||
|
|
|
|
|
|
|
|
|
|
|||
Capital Expenditures: |
|
|
|
|
|
|
|
|
|
|||
PCB |
|
$ |
|
|
$ |
|
|
$ |
|
|||
RF&S Components |
|
|
|
|
|
|
|
|
|
|||
Corporate and Other (1) |
|
|
|
|
|
|
|
|
|
|||
Total capital expenditures |
|
$ |
|
|
$ |
|
|
$ |
|
|||
92
TTM TECHNOLOGIES, INC.
Notes to Consolidated Financial Statements — (Continued)
|
|
As of |
|
|||||
|
|
January 2, 2023 |
|
|
January 3, 2022 |
|
||
|
|
(In thousands) |
|
|||||
Segment Assets: |
|
|
|
|
|
|
||
PCB |
|
$ |
|
|
$ |
|
||
RF&S Components |
|
|
|
|
|
|
||
Corporate and Other (1) |
|
|
|
|
|
|
||
Total assets |
|
$ |
|
|
$ |
|
||
The Corporate category primarily includes operating expenses that are not included in the segment operating performance measures. Corporate consists primarily of corporate governance functions such as finance, accounting, information technology and human resources personnel, as well as global sales and marketing personnel, research and development costs, and acquisition and integration costs associated with acquisitions and divestitures.
The Company markets and sells its products in approximately
|
|
2022 |
|
|
2021 |
|
|
2020 |
|
|||||||||||||||
|
|
Net Sales |
|
|
Long-Lived Assets |
|
|
Net Sales |
|
|
Long-Lived Assets |
|
|
Net Sales |
|
|
Long-Lived Assets |
|
||||||
|
|
(In thousands) |
|
|||||||||||||||||||||
United States |
|
$ |
|
|
$ |
|
|
$ |
|
|
$ |
|
|
$ |
|
|
$ |
|
||||||
China |
|
|
|
|
|
|
|
|
|
|
|
|
|
|
|
|
|
|
||||||
Other |
|
|
|
|
|
|
|
|
|
|
|
|
|
|
|
|
|
|
||||||
Total |
|
$ |
|
|
$ |
|
|
$ |
|
|
$ |
|
|
$ |
|
|
$ |
|
||||||
Net sales are attributed to countries by country invoiced.
The following is a reconciliation of the numerator and denominator used to calculate basic earnings per share and diluted earnings per share from continuing operations for the years ended January 2, 2023, January 3, 2022 and December 28, 2020:
|
|
For the Year Ended |
|
|||||||||
|
|
January 2, 2023 |
|
|
January 3, 2022 |
|
|
December 28, 2020 |
|
|||
|
|
(In thousands, except per share amounts) |
|
|||||||||
Net income (loss) from continuing operations |
|
$ |
|
|
$ |
|
|
$ |
( |
) |
||
|
|
|
|
|
|
|
|
|
|
|||
Basic weighted average shares |
|
|
|
|
|
|
|
|
|
|||
Dilutive effect of performance-based restricted stock units, |
|
|
|
|
|
|
|
|
— |
|
||
Dilutive effect of outstanding warrants |
|
|
|
|
|
|
|
|
— |
|
||
Diluted shares |
|
|
|
|
|
|
|
|
|
|||
Earnings (loss) per share: |
|
|
|
|
|
|
|
|
|
|||
Basic |
|
$ |
|
|
$ |
|
|
$ |
( |
) |
||
Diluted |
|
$ |
|
|
$ |
|
|
$ |
( |
) |
||
For the years ended January 2, 2023, January 3, 2022 and December 28, 2020, PRUs, RSUs and stock options to purchase
93
TTM TECHNOLOGIES, INC.
Notes to Consolidated Financial Statements — (Continued)
There were warrants sold to purchase
During the year ended December 28, 2020, the Company calculated the dilutive effect of Convertible Senior Notes using the treasury stock method because the Company repaid and settled the Convertible Senior Notes in cash. For the year ended December 28, 2020, the effect of shares of common stock related to the Company’s Convertible Senior Notes were not included in the computation of dilutive earnings per share as the impact would be anti-dilutive due to the net loss from continuing operations.
On February 3, 2021, the Company announced that its Board of Directors authorized and approved a share repurchase program. Under the program, the Company was authorized to repurchase up to $
During the year ended January 2, 2023, the Company repurchased a total of
On February 8, 2023, the Company announced that it intends to close PCB manufacturing operations in Anaheim and Santa Clara, California, and Hong Kong and to consolidate the business from these impacted sites into the Company’s remaining facilities. The plant closures are expected to improve both facility and talent utilization across the Company’s footprint resulting in improved profitability. The Company expects to record between $
94