10-K: Annual report pursuant to Section 13 and 15(d)
Published on February 26, 2020
UNITED STATES
SECURITIES AND EXCHANGE COMMISSION
Washington, D.C. 20549
Form
For the fiscal year ended
Or
For the transition period from to
Commission file number
(Exact Name of Registrant as Specified in Its Charter)
|
|
|
|
|
(State or Other Jurisdiction of Incorporation or Organization) |
|
(I.R.S. Employer Identification No.) |
|
|
|
(Zip Code) |
|
(Address of Principal Executive Offices) |
|
|
(
(Registrant’s telephone number, including area code)
Securities registered pursuant to Section 12(b) of the Exchange Act:
|
|
|
|
|
|
Title of each class |
Trading symbol(s) |
Name of each exchange on which registered |
|
|
|
|
|
|
Indicate by check mark if the registrant is a well-known seasoned issuer, as defined in Rule 405 of the Securities Act.
Indicate by check mark if the registrant is not required to file reports pursuant to Section 13 or 15(d) of the Act. Yes ☐
Indicate by check mark whether the registrant: (1) has filed all reports required to be filed by Section 13 or 15(d) of the Securities Exchange Act of 1934 during the preceding 12 months (or for such shorter period that the registrant was required to file such reports), and (2) has been subject to such filing requirements for the past 90 days.
Indicate by check mark whether the registrant has submitted electronically every Interactive Data File required to be submitted pursuant to Rule 405 of Regulation S-T (§232.405 of this chapter) during the preceding 12 months (or for such shorter period that the registrant was required to submit such files).
Indicate by check mark whether the registrant is a large accelerated filer, an accelerated filer, a non-accelerated filer, a smaller reporting company, or an emerging growth company. See the definitions of “large accelerated filer,” “accelerated filer”, “smaller reporting company” and “emerging growth company” in Rule 12b-2 of the Exchange Act:
|
Large accelerated filer |
☑ |
Accelerated filer |
☐ |
|
Non-accelerated filer |
☐ |
Smaller reporting company |
|
|
|
|
|
|
|
|
|
Emerging growth company |
|
If an emerging growth company, indicate by check mark if the registrant has elected not to use the extended transition period for complying with any new or revised financial accounting standards provided pursuant to Section 13(a) of the Exchange Act. ☐
Indicate by check mark whether the registrant is a shell company (as defined in Rule 12b-2 of the Act). Yes
The aggregate market value of Common Stock held by non-affiliates of the registrant (based on the closing price of the registrant’s Common Stock as reported on the Nasdaq Global Select Market on July 1, 2019, the last business day of the most recently completed second fiscal quarter), was $
As of February 19, 2020, there were outstanding
DOCUMENTS INCORPORATED BY REFERENCE
Portions of the registrant’s definitive Proxy Statement for its 2020 Annual Meeting of Stockholders are incorporated by reference into Part III of this report. Such Proxy Statement will be filed with the Securities and Exchange Commission within 120 days after the end of the fiscal year to which this report relates.
TTM TECHNOLOGIES, INC.
ANNUAL REPORT ON FORM 10-K
TABLE OF CONTENTS
|
|
||
|
ITEM 1. |
3 |
|
|
ITEM 1A. |
14 |
|
|
ITEM 1B. |
31 |
|
|
ITEM 2. |
32 |
|
|
ITEM 3. |
33 |
|
|
ITEM 4. |
33 |
|
|
|
|
|
|
|
||
|
ITEM 5. |
34 |
|
|
ITEM 6. |
35 |
|
|
ITEM 7. |
MANAGEMENT’S DISCUSSION AND ANALYSIS OF FINANCIAL CONDITION AND RESULTS OF OPERATIONS |
36 |
|
ITEM 7A. |
44 |
|
|
ITEM 8. |
46 |
|
|
ITEM 9. |
CHANGES IN AND DISAGREEMENTS WITH ACCOUNTANTS ON ACCOUNTING AND FINANCIAL DISCLOSURE |
47 |
|
ITEM 9A. |
47 |
|
|
ITEM 9B. |
47 |
|
|
|
|
|
|
|
||
|
ITEM 10. |
48 |
|
|
ITEM 11. |
48 |
|
|
ITEM 12. |
SECURITY OWNERSHIP OF CERTAIN BENEFICIAL OWNERS AND MANAGEMENT AND RELATED STOCKHOLDER MATTERS |
48 |
|
ITEM 13. |
CERTAIN RELATIONSHIPS AND RELATED TRANSACTIONS, AND DIRECTOR INDEPENDENCE |
48 |
|
ITEM 14. |
48 |
|
|
|
|
|
|
|
||
|
ITEM 15. |
49 |
|
|
ITEM 16. |
52 |
|
|
53 |
||
|
54 |
||
2
PART I
Statement Regarding Forward-Looking Statements
This report on Form 10-K contains forward-looking statements regarding future events or our future financial and operational performance. Forward-looking statements include statements regarding markets for our products; trends in net sales, gross profits and estimated expense levels; liquidity and anticipated cash needs and availability; and any statement that contains the words “anticipate,” “believe,” “plan,” “forecast,” “foresee,” “estimate,” “project,” “expect,” “seek,” “target,” “intend,” “goal” and other similar expressions. The forward-looking statements included in this report reflect our current expectations and beliefs, and we do not undertake publicly to update or revise these statements, even if experience or future changes make it clear that any projected results expressed in this annual report or future quarterly reports to stockholders, press releases or company statements will not be realized. In addition, the inclusion of any statement in this report does not constitute an admission by us that the events or circumstances described in such statement are material. Furthermore, we wish to caution and advise readers that these statements are based on assumptions that may not materialize and may involve risks and uncertainties, many of which are beyond our control, that could cause actual events or performance to differ materially from those contained or implied in these forward-looking statements. These risks and uncertainties include the business and economic risks described in “Item 1A — Risk Factors”.
Unless otherwise indicated or unless the context requires otherwise, all references to time periods refer to our fiscal year, and all reference to “TTM,” “our company,” “we,” “us,” “our,” and similar names refer to TTM Technologies, Inc. and its subsidiaries.
|
ITEM 1. |
BUSINESS |
General
We are a leading global printed circuit board (PCB) manufacturer, focusing on quick-turn and volume production of technologically complex PCBs, backplane assemblies and electro-mechanical solutions (E-M Solutions), as well as a global designer and manufacturer of radio-frequency (RF) and microwave components and assemblies. We are the largest PCB manufacturer in North America and one of the largest PCB manufacturers in the world, in each case based on revenue, according to the 2018 rankings from N.T. Information LTD (NTI). In 2019, we generated approximately $2.7 billion in net sales and ended the year with approximately 25,700 employees worldwide. We operate a total of 29 specialized facilities in North America and China. We focus on providing time-to-market and volume production of advanced technology products and offer a one-stop design, engineering and manufacturing solution to our customers. This one-stop design and manufacturing solution allows us to align technology development with the diverse needs of our customers and to enable them to reduce the time required to develop new products and bring them to market. We serve a diversified customer base consisting of approximately 1,900 customers in various markets throughout the world, including aerospace and defense, automotive components, smartphones and other mobile devices, high-end computing, medical, industrial and instrumentation related products as well as networking/communications infrastructure products. Our customers include both original equipment manufacturers (OEMs) and electronic manufacturing services (EMS) providers.
We manage our worldwide operations based on two reportable segments: (1) PCB, which consists of sixteen domestic PCB, RF sub-system, and RF component fabrication plants, including two facilities that provide follow-on value-added services; nine PCB fabrication and RF component plants in China; and one in Canada; and (2) E-M Solutions, which consists of three custom electronic assembly plants in China. Each segment operates predominantly in the same industries with production facilities that produce customized products for our customers and use similar means of product distribution.
Additional information on our reportable segments and product information is contained in Note 17 of the Notes to Consolidated Financial Statements.
3
Industry Overview
PCBs are manufactured in panels from sheets of laminated material. Each panel is typically subdivided into multiple PCBs, each consisting of a pattern of electrical circuitry etched from copper to provide an electrical connection between the components mounted to it. PCBs serve as the foundation for virtually all electronic products, including the electronic components integrated into automobiles, consumer electronics products (smartphones and other mobile devices), high-end commercial electronic equipment (such as medical equipment, data communications routers, switches and servers) and aerospace and defense electronic systems.
Products designed to offer faster data transmission, thinner and more lightweight packaging, and reduced power consumption generally require increasingly complex PCBs to meet these criteria. By using advanced processes such as High Density Interconnect (HDI) and modified semi-additive process (mSAP) technologies, circuit densities can be increased, thereby providing for smaller products with higher packaging densities. Furthermore, rigid-flex circuits can be found in small and lightweight end products, such as smartphones and other mobile devices and increasingly in other end markets such as automotive, industrial and aerospace and defense. PCB manufacturers also manufacture high performance substrates that serve as the interconnect between integrated circuits (ICs) and the PCB’s used in most RF components and sub-systems serving the aerospace, defense, and automotive markets. We collectively refer to all of these technologies as “advanced technologies,” and they generally have growth rates which are higher than conventional technologies. In addition, most of our markets have low volume requirements during the prototype stage that demand a highly flexible manufacturing environment which later transitions to a higher volume requirement during product ramp.
According to estimates in a November 2019 report by Prismark Partners, worldwide demand for PCBs is expected to be $61.3 billion in 2019. Of this worldwide demand for production in 2019, Prismark Partners reports that PCB production in the Americas accounted for approximately 4% (approximately $2.7 billion), PCB production in China accounted for approximately 54% (approximately $33.0 billion), and PCB production in the rest of the world accounted for approximately 42% (approximately $25.6 billion). According to the same report by Prismark Partners, worldwide demand for PCBs is forecast to grow at a 4.3% compound annual growth rate (CAGR) from 2018 to 2023 driven mostly by multilayer boards and package substrates. Prismark Partners expects a strong rebound in 2020 following the decline of worldwide demand for PCBs in 2019, driven primarily by HDI and package substrates.
Industry Trends
We believe that several trends impacting the PCB manufacturing industry will benefit us in the future. These trends include:
Shorter electronic product life cycles, which create opportunities for PCB manufacturers that can offer engineering support in the prototype stage and manufacturing scalability throughout the production life cycle.
Increasing complexity of electronic products, which requires technologically complex PCBs that can accommodate higher speeds and component densities, including HDI, flexible, and substrate PCBs as well as intricately engineered RF components and subsystems.
Higher demand for reliable product manufactured in the U.S., encompassing better oversight on sub-tier supply chain materials and controls. In addition, the trade war between the U.S. and China has increased the importance of supply chain partners with strong domestic capabilities and manufacturing footprint.
Growing utilization of PCB technology in automobiles. An increasing trend toward sophisticated safety systems, automated driving, electric/hybrid vehicles and miniaturization of electronic devices in the automotive industry is driving increasing electronic content and higher PCB usage in automobiles, particularly with regard to the increased demand for advanced technologies like HDI, rigid-flex and RF PCBs for radar.
Reconsideration of electronics supply chain concentration in China. China has emerged as the global production center for electronic manufacturers. However, the US-China trade war is resulting in reconsideration and rebalancing throughout the supply chain as companies evaluate the right degree of continued presence in China to support evolving global supply chain needs and China’s local growth, versus geographic diversification to lessen China over-concentration risks highlighted by the trade war.
Supply chain consolidation by commercial OEMs. We believe that PCB manufacturers which can offer one-stop manufacturing capabilities — from prototype to volume production — and integration capabilities have a competitive advantage in the market.
Our Strategy
Our goal is to be the leading global provider of time-critical, one-stop manufacturing services for highly complex PCBs and RF components. Our core strategy includes the following elements:
Provide differentiated capabilities beyond the base PCB by incorporating advanced design-to-specification engineering support, testing, components and specialized assembly into the value-added package provided to customers. With the acquisition of Anaren in 2018, TTM has moved beyond build to print manufacturing and assembly capabilities to engage with customers in designing a more complete RF solution to meet their technology needs. With the additional design capabilities, TTM now provides cost effective, ready for manufacture, enabling technologies to the customer. We intend to build on the Anaren acquisition to deepen
4
our RF engagement with key aerospace and defense customers as well as to carry this same capability to our commercial automotive, telecommunications and networking customers.
Maintain our customer-driven culture and provide superior service to our customers in our core markets of aerospace and defense, automotive, computing and storage, medical/industrial/instrumentation, and networking/communications. Our customer-oriented culture is designed to achieve extraordinary service, competitive differentiation, and superior execution. Our customer-oriented strategies include engaging in co-development of new products, capturing new technology products for next generation equipment, and continuing investments to enhance our broad offering of PCB and RF/microwave technologies. We believe our ability to anticipate and meet customers’ needs is critical to retaining existing customers and attracting leading companies as new customers.
Drive operational efficiency and productivity. We are highly focused on improving our operational execution to increase efficiency, productivity and yields. We strongly believe in the benefits of sharing best practices across our extensive manufacturing footprint and rely on stringent goals for throughput, quality and customer satisfaction to measure our effectiveness. The fast paced nature of our business requires a disciplined approach to manufacturing that is rooted in continuous improvement.
Accelerate customer, end-market, and technology diversification through strategic mergers and acquisitions. We have a history of executing successful acquisitions that have been key to our growth and profitability. We continuously look for strategic opportunities that could facilitate our efforts to further diversify into other growing end markets including automotive and aerospace and defense as well as further strengthen our leading edge technology capabilities. For example, the acquisition of Anaren in 2018 added critical RF engineering, simulation and integration capabilities and the acquisition of i3’s assets in 2019 allowed us to broaden our technology portfolio for high mix, low volume advanced technology PCBs.
Accelerate our expansion into the automotive and other growing markets using our advanced technology as a key point of differentiation. With rising requirements for faster data transmission, shrinking features (i.e., lightweight and thin), and lower power consumption, many PCB designs have migrated to more complex HDI PCBs from conventional multi-layer PCB technologies. This trend began with PCBs used in portable devices such as smartphones and other mobile devices but has become an increasing trend in other end markets, such as automotive, networking/communications, medical, and aerospace and defense. We are focused in particular on the automotive opportunity where the combination of our strength in highly reliable conventional and RF PCBs and our advanced technology PCB product capabilities allows us to meet our automotive customers’ growing demand in such areas as infotainment, radar systems, cameras for advanced driver assistance systems and electric vehicles. As our customers consolidate their supply chain, our objective is to differentiate ourselves as a strategic supplier with the technology breadth to meet most, if not all, of our automotive customers’ PCB requirements.
Address customer needs in all stages of the product life cycle. By providing a one-stop solution, we work to service our customers’ needs from the earliest stages of product design and development through volume production. We believe that by servicing our customers early in the development process, we are able to demonstrate our capabilities and establish an incumbent position early in the product development cycle, which translates into additional opportunities as our customers move into volume production. We believe our expertise is enhanced by our ability to deliver highly complex PCBs to customers in significantly compressed lead times. This rapid delivery service enables OEMs to develop sophisticated electronic products more quickly and reduce their time to market. We believe we will be able to increase customer engagement with customizable RF solutions from the concept stage through to volume, which typically results in higher customer engagement.
Deliver strong financial performance with improved asset turnover. We aspire to deliver industry-leading financial performance. We expect to achieve this by servicing our customers’ needs in higher-growth end markets in a cost-efficient and effective manner. We believe that this strategy will allow us to generate strong cash flows, which will enable us to reduce financial leverage over time while at the same time providing us with the financial flexibility to continue to invest in our business, including through opportunistic acquisitions.
Products and Services
We offer a wide range of PCB products, RF components, and electro-mechanical solutions, including conventional PCBs, RF and microwave circuits, HDI PCBs, substrate-like PCBs, flexible PCBs, rigid-flex PCBs, custom assemblies and system integration, IC substrates, passive RF components, advanced ceramic RF components, hi-reliability multi-chip modules, and beamforming and switching networks. We also offer certain value-added services to support our customers’ needs. These include design-for-manufacturability (DFM), PCB layout design, simulation and testing services, and quick turnaround (QTA) production. By offering this wide range of PCB products and complementary value-added services, we are able to provide our customers with a “one-stop” manufacturing solution for their PCB and integration requirements. This differentiates us from our competition and enhances our relationships with our customers.
Conventional PCBs
A conventional PCB is made from a composite laminate that is metalized with a conductive material such as copper. The PCB is the basic platform used to interconnect components in most electronic products including computers, communications equipment,
5
cellular phones, high-end consumer electronics, automotive controls, commercial aerospace and defense systems and medical and industrial equipment. Conventional PCBs can be classified as single-sided, double-sided and multi-layer boards.
We focus on higher layer count conventional PCBs. A multi-layer PCB can accommodate more complex circuitry than a single-sided or double-sided PCB and as such requires more sophisticated production techniques. The number of layers comprising a PCB often increases with the complexity of the end product. For example, a simple consumer device such as a garage door controller may use a single-sided or double-sided PCB, while a high-end network router or computer server may use a PCB with 30 or more layers.
RF and microwave circuits
We produce and test specialized circuits used in radio-frequency or microwave emission and collection applications. These products are typically used for radar, transmit/receive antennas and similar wireless applications. Markets for these products include defense, avionics, satellite, and commercial applications including telecommunications, networking and automotive. The manufacture of these products requires advanced materials, equipment, and methods that are highly specialized and distinct from conventional printed circuit manufacturing techniques. We also offer specialized radio-frequency assembly and test services. We have developed integrated solutions across our facilities and capabilities to provide sophisticated integrated electronics for numerous platforms, ranging from digital RF memory (DRFM) to frequency up/down converters (UDC) and channelized amplifiers for military and space applications.
High density interconnect or HDI PCBs
Our facilities in North America and China also produce high density interconnect (HDI) PCBs, which are PCBs with higher interconnect density per unit area requiring more sophisticated technology and manufacturing processes for their production than conventional PCB products. HDI PCBs are boards with high-density characteristics including micro-sized holes, or microvias (diameter at or less than 0.15 mm), and fine line circuitry (circuit line width and spacing at or less than 0.075 mm) and are fabricated with thin high performance materials, thereby enabling more interconnection functions per unit area. HDI PCBs generally are manufactured using a sequential build-up process in which circuitry is formed in the PCB one layer at a time through successive drilling, plating and lamination cycles. In general, a board’s complexity is a function of interconnect and circuit density, layer count, laminate material type and surface finishes. As electronic devices have become smaller and more portable with higher functionality, demand for advanced HDI PCB products has increased dramatically. We define advanced HDI PCBs as those having more than one layer of microvia interconnection structure.
Substrate-like PCBs or SLPs
Substrate-like PCBs (SLPs) represent the next evolution of high end HDI PCBs. SLPs are PCBs with even higher interconnect density per unit area than the traditional Advanced HDI PCBs described above and require an even more sophisticated manufacturing technology called modified semi-additive process or mSAP. The mSAP process is adapted from IC substrate fabrication and uses enhancements to the subtractive and additive techniques of traditional PCBs. This enables fine line circuitry (circuit line width and spacing at or less than 0.03 mm). We manufacture SLPs with the mSAP process in our China facilities and the products are generally used in the cellular market which requires high performance in a small footprint. Demand for this type of high-density circuit is beginning to penetrate the markets of more traditional PCBs. In addition, we now offer an alternative approach to building SLP technology in the United States for lower volume, higher mix commercial and aerospace and defense applications.
Flexible PCBs
Flexible PCBs are printed circuits produced on flexible films, allowing them to be folded or bent to fit the available space or allowing for application movement. We manufacture circuits on flexible substrates that can be installed in three-dimensional applications for electronic packaging systems. Use of flexible circuitry can enable improved reliability and electrical performance, reduced weight and reduced assembly costs when compared with traditional wire harness or ribbon cable packaging. Flexible PCBs can provide for flexible electronic connectivity of an electrical device’s apparatus such as printer heads, cameras, camcorders, TVs, mobile handsets, and tablets. For some of our flexible PCB customers, we also assemble components onto the flexible PCBs we manufacture.
Rigid-flex PCBs
Rigid-flex circuitry provides a simple means to integrate multiple PCB assemblies and other elements such as display, input or storage devices without wires, cables or connectors, replacing them with thin, light composites that integrate wiring in ultra-thin, flexible ribbons between rigid sections. In rigid-flex packaging, a flexible circuit substrate provides a backbone of wiring with rigid multilayer circuit sections built up as modules where needed.
Since the ribbons can be bent or folded, rigid-flex provides a means to compactly package electronics in three dimensions with dynamic or static bending functions as required, enabling miniaturization and thinness of product design. The simplicity of rigid-flex integration also generally reduces the number of parts and interconnections required, which can improve reliability. The increasing
6
popularity of mobile electronics coupled with the design trend of developing increasingly thinner, lighter and more feature-rich products, is expected to further drive growth in the rigid-flex and flex sectors, where these PCBs are the backbone of miniaturization.
Rigid-flex technology is essential to a broad range of applications including aerospace and defense, industrial and transportation systems requiring high reliability; hand-held and wearable electronics such as mobile phones, video cameras and music players where thinness and mechanical articulation are essential; and ultra-miniaturized products such as headsets, medical implants and semiconductor packaging where size and reliability are paramount.
Custom assemblies and system integration
Our assembly facilities produce custom electronic assemblies as well as fully integrated electronic systems. Custom electronic assemblies refers to a variety of PCB assemblies such as backplane and midplane assemblies, flexible and rigid-flex assemblies and RF assemblies. Each of these assemblies involves mounting electronic components to a printed circuit board and then testing the assembly for electrical continuity. Our services also go beyond the PCB assembly to fully integrated systems. A fully integrated system often includes installing the PCB assembly into a metal enclosure and adding fans for cooling the system, a power supply and cable assemblies to create a fully assembled and tested system that will be shipped to our customers.
IC substrates
IC substrates provide the mechanical support and electrical interconnect used to package ICs (integrated circuits or semiconductors) either in single chip packages or multi-chip modules. IC substrates, also known as chip carriers, are highly miniaturized circuits manufactured by a process largely similar to that for PCBs but requiring the use of ultra-thin materials and including micron-scale features, because they must bridge the gap between sub-micron IC features and millimeter scale PCBs. Consequently, IC substrates are generally manufactured in a clean room environment to ensure products are free of defects and contamination and employ advanced HDI processes such as mSAP and alternative approaches for SLP technology.
Passive RF Components
Our line of products consists of off-the-shelf surface mount microwave components which provide passive microwave signal distribution functions. These products were developed to provide a low-cost high performance signal distribution component, which could be placed on standard printed circuit boards with automated production equipment. The primary applications of these products are currently in equipment for cellular base stations and in WLAN, Bluetooth, and satellite television. In cellular base stations, our surface mount products are utilized in RF power amplifiers, and are also found in low-noise amplifiers, radios, and antennas. 5G advancements and the continued proliferation of wireless technology may create new applications for these products across other end markets.
Advanced Ceramic RF Components
Our ceramic offerings include standard and etched thick-film ceramic substrates. Etched thick-film ceramic circuits compete favorably with thin-film ceramic circuits in cost while providing comparable performance. These products are generally customer designed in close cooperation with our engineering staff to ensure the highest performance and manufacturability possible. These capabilities are aimed at high performance applications in the medical, industrial, and defense markets.
Hi-Reliability Multi-Chip Modules
We offer custom hybrid and multi-chip modules, high-performance radiation-hardened and space-qualified micro-electronics and power management and control electronics.
Beamforming and Switching Networks
Our beamforming technologies are used in military and aerospace applications, offering a variety of active and passive high-performance RF assemblies, including L-band/LEO and L- and S-band/GEO space beamformers, UHF thru Ka-band radar AESA RF networks, Butler matrices, multi-octave, and more.
Quick turnaround services
We refer to our rapid delivery services as “quick turnaround” or “QTA”, because we provide custom-fabricated PCBs to our customers within as little as 24 hours to ten days. As a result of our ability to rapidly and reliably respond to the critical time requirements of our customers, we generally receive premium pricing for our QTA services as compared to standard lead time prices.
|
|
• |
Prototype production. In the design, testing, and launch phase of a new electronic product’s life cycle, our customers typically require limited quantities of PCBs in a very short period of time. We satisfy this need by manufacturing prototype PCBs in small quantities, with delivery times ranging from as little as 24 hours to ten days. |
|
|
• |
Ramp-to-volume production. After a product has successfully completed the prototype phase, our customers introduce the product to the market and require larger quantities of PCBs in a short period of time. This transition stage between low- |
7
|
|
volume prototype production and volume production is known as ramp-to-volume. Our ramp-to-volume services typically include manufacturing up to a few hundred PCBs per order with delivery times ranging from five to 15 days. |
Thermal management
Increased component density on circuit boards often requires improved thermal dissipation to reduce operating temperatures. We produce printed circuits with heavy copper cores and both embedded and press-fit coins. In addition, we produce PCBs with electrically passive heat sinks laminated externally on a circuit board or between two circuit boards, as well as PCBs with electrically active thermal cores.
Manufacturing Technologies
The market for our products is characterized by rapidly evolving technology. In recent years, the trend in the electronic products industry has been to increase the speed, complexity, and performance of components while reducing their size. We believe our technological capabilities allow us to address the needs of manufacturers to bring complicated electronic products to market faster.
To manufacture PCBs, we generally receive circuit designs directly from our customers in the form of computer data files, which we review to ensure data accuracy and product manufacturability. Processing these data files with computer aided manufacturing (CAM) technology, we generate images of the circuit patterns that we then physically develop on individual layers, using advanced photographic and direct imaging processes. Through a variety of plating and etching processes, we selectively add and remove conductive materials to form horizontal layers of thin circuitry, which are separated by electrical insulating material. A multilayer circuit board is produced by laminating together multiple layers of circuitry, using intense heat and pressure under vacuum. Vertical connections between layers are achieved by drilling and plating through small holes, called vias. Vias are made by highly specialized drilling equipment capable of achieving extremely fine tolerances with high accuracy. We specialize in high layer count PCBs with extremely fine geometries and tolerances. Because of the tolerances involved, we employ clean rooms in certain manufacturing processes where tiny particles might otherwise create defects on the circuit patterns. We also use automated optical inspection systems and electrical testing systems to ensure consistent quality of the circuits we produce.
We believe that our highly specialized equipment and advanced manufacturing processes enable us to reliably produce PCBs with the following characteristics:
|
|
• |
High layer count. Manufacturing PCBs with a large number of layers is difficult to accomplish due to the accumulation of manufacturing tolerances and registration systems required. In our PCB reportable segment, we regularly manufacture PCBs with more than 30 layers on a quick-turn and volume basis. |
|
|
• |
Blind and buried vias. Vias are drilled holes that provide electrical connectivity between layers of circuitry in a PCB. Blind vias connect the surface layer of the PCB to an internal layer and terminate at the internal layer. Buried vias are holes that do not reach either surface of the PCB but allow inner layers to be interconnected. Products with blind and buried vias can be made thinner, smaller, lighter and with higher component density and more functionality than products with traditional vias. |
|
|
• |
Microvias. HDI technology utilizes microvias, which are small vias with diameters generally less than 0.15 mm after plating. Advanced HDI products may also require the microvias to be fully filled using a specialized plating process so that additional microvia structures can be stacked to form more complex interconnections. These microvias consume much less space on the layers they connect, thereby providing for greater wiring densities and flexibility, and also providing closer spacing of components and their attachment pads. The fabrication of PCBs with microvias requires specialized equipment, such as laser drills, and highly developed process knowledge. Applications such as handheld wireless devices employ microvias to obtain a higher degree of functionality from a given surface area. |
|
|
• |
Embedded passives. Embedded passive technology involves embedding either capacitive or resistive elements inside the PCB, which allows for removal of passive components from the surface of the PCB and thereby leaves more surface area for active components. Use of this technology provides greater surface area for surface-mounted ICs and better signal performance, as well as increased functionality of products with higher component density. |
|
|
• |
Fine line traces and spaces. Traces are the connecting copper lines between the different components of the PCB, and spaces are the distances between traces. The smaller the traces and the tighter the spaces, the higher the density of the PCB and the greater the expertise required to achieve a desired final yield performance level. We are able to manufacture PCBs with traces and spaces less than 0.030 mm. |
|
|
• |
High aspect ratios. The aspect ratio is the ratio between the thickness of the PCB and the diameter of a drilled hole. As the aspect ratio increases, it becomes increasingly more difficult to consistently and reliably form, electroplate and finish all the holes on a PCB. In production, we are able to provide aspect ratios of up to 30:1. |
|
|
• |
Thin core processing. A core is the basic inner-layer building block material from which PCBs are constructed. A core consists of a flat sheet of material comprised of glass-reinforced resin with copper foil laminated on either side. The thickness of inner-layer cores is typically determined by the overall thickness of the PCB and the number of layers required. |
8
|
|
The demand for thinner cores derives from the requirements for thinner PCBs, higher layer counts and various electrical parameters. Core thickness in our PCBs ranges from as little as 0.025 mm up to 1.57 mm. |
|
|
• |
Advanced hole fill processes. Our advanced hole fill processes provide designers the opportunity to increase the density of component placements by reducing the surface area required to place many types of components. In traditional design, components are routed from their surface interfaces through via connections in order to access power and ground connections and the internal circuitry used to connect to other discrete components. Our advanced hole fill processes provide methods to allow for vias to be placed inside their respective surface mount pads by filling the vias with a thermoset epoxy and plating flat copper surface mount pads directly over the filled hole. |
|
|
• |
Advanced materials. We manufacture circuit boards using a wide variety of advanced dielectric materials. These high-performance materials offer electrical, thermal, and long-term reliability advantages over conventional materials but are more difficult to manufacture. We are certified by Underwriters Laboratories to manufacture PCBs using many types and combinations of these specialty materials. This broad offering allows us to manufacture PCBs for a wide array of end-use applications, including highly complex PCBs for niche and high-end commercial and aerospace and defense markets. |
|
|
• |
Quick Turn Manufacturing. In addition, in circumstances where our customers require time critical engineering and manufacturing services, we are able to meet our customers’ need with our quick-turn manufacturing capabilities. |
Our RF Engineering organization principally designs and manufactures state-of-the-art microwave-based hardware for use in advanced radar systems, advanced jamming systems, missiles and decoys, electronic surveillance systems and satellite and ground based communication systems. Several core manufacturing technology areas include:
|
|
• |
Microwave Assembly Technology. Our Microwave product capabilities include simple isolator components for large scale phased array radars to very complex highly integrated Electronic Warfare Line Replaceable Units. All products are designed internally to customer specifications using the latest versions of microwave design and simulation software, coupled with an extensive internal design library. Our radar beamforming solutions are realized through internal design, manufacturing and highly automated test processes for circulators, RF distribution and manifold assemblies. Automated pick-and-place, surface mount reflow, fully automated visual inspection and automated test stands ensure highly repeatable integrated microwave assembly performance. Our environmental lab test capability is used for product qualification and Highly Accelerated Life Testing when required. |
|
|
• |
Analog Hybrid Module Technology. Analog Hybrid Modules are assembled in our Microelectronics Center of Excellence, which is certified to MIL-PRF-38534 and -38535 Class H and Class K. We continue to invest in state-of-the-art equipment for precision microelectronic assembly processes including custom ceramic substrate manufacturing, eutectic die attach, automated epoxy dispense, wire bonding, lid attach and lead forming. All parts are electrically tested for performance and subjected to environmental testing as may be required. |
|
|
• |
Ceramic Technology. Low Temperature Co-fired Ceramic (LTCC) circuits are well-suited for high performance RF packages for multi-function applications such as transmit-receive modules or other RF integrated modules. We developed proprietary processes to allow for the use of less expensive conductors (Silver vs. traditional Gold) in the LTCC product thus providing significantly lower cost options to our customers. We developed a proprietary etched thick film process resulting in thin film performance at a much reduced cost. We recently deployed customized equipment to support automated test, visual and electrical inspection, and final tape-and-reel for ceramic resistor products significantly reducing cost and enhancing product quality. |
Drawing on our vertical manufacturing capabilities, our E-M Solutions business delivers system integration solutions that power, protect, cool and enable our customers’ products to function as intended. These in-house vertical capabilities include Higher Level Assemblies (HLA) incorporating TTM produced printed circuit boards and backplanes, PCB assemblies and backplane assemblies, fabricated precision sheet metal chassis, enclosures and weldments. As a contract manufacturer, we also selectively procure such products and services from third providers on an exception basis.
Our E-M Solutions business manufactures a wide range of products for customers in the Automotive / Electric Vehicle, Energy, Industrial and Network Communications segments.
The customers of our E-M Solutions business provide us data packages that may include: 3D models, 2D drawings, wiring diagrams, circuit design computer data files, circuit assembly computer data files and multi-level bills of material. Also included are testing requirement specifications for PCB assemblies, backplane assemblies and HLA, and qualification / verification requirements for the product.
When processing the data package, our Engineering and Operations teams ensure data accuracy and product manufacturability. Detailed reviews at both component and assembly levels are conducted at E-M Solutions to ensure repeatable and controlled manufacturing and assembly processes.
The E-M solutions PCB assemblies and backplane assemblies manufacturing capability has been developed to support high reliability products. Automated Optical Inspection (AOI) capabilities encompass solder paste and component placement and ensure
9
the precise alignment of components both before and after the reflow soldering process, Through Hole Placing (THP), selective solder, 3D x-ray, hi-pot testing, in-circuit testing, functional circuit testing and selective conformal coating.
Chassis, enclosures and weldments are manufactured in-house utilizing smart flexible manufacturing techniques that deliver cost effective products with minimal up-front investment.
Our smart HLA lines deliver precise repeatable processes. A complete manufacturing history report is automatically generated during the HLA process that includes verification of serialized parts, full traceability of: materials, torque levels, in-line tests, in-process checks, start and finish time of each step throughout the process while providing real time visibility tracking of product output versus plan.
Customers and Markets
Our customers include both OEMs and EMS companies that primarily serve the aerospace and defense, automotive, cellular phone, computing, medical/industrial/instrumentation, and networking/communications end markets of the electronics industry. Included in the end markets that our OEM and EMS customers serve is the U.S. government. As a result, we are a supplier, primarily as a subcontractor, to the U.S. government.
The following table shows the percentage of our net sales in each of the principal end markets we served for the periods indicated:
|
|
|
For the Year Ended |
|
|
|||||||||||
|
End Markets (1) |
|
December 30, 2019 |
|
|
|
December 31, 2018 (3) |
|
|
|
January 1, 2018 |
|
|
|||
|
Aerospace and Defense |
|
|
26 |
|
% |
|
|
21 |
|
% |
|
|
16 |
|
% |
|
Automotive |
|
|
16 |
|
|
|
|
18 |
|
|
|
|
19 |
|
|
|
Cellular Phone (2) |
|
|
13 |
|
|
|
|
14 |
|
|
|
|
18 |
|
|
|
Computing/Storage/Peripherals (2) |
|
|
13 |
|
|
|
|
14 |
|
|
|
|
13 |
|
|
|
Medical/Industrial/Instrumentation |
|
|
14 |
|
|
|
|
14 |
|
|
|
|
14 |
|
|
|
Networking/Communications |
|
|
15 |
|
|
|
|
17 |
|
|
|
|
18 |
|
|
|
Other (2) |
|
|
3 |
|
|
|
|
2 |
|
|
|
|
2 |
|
|
|
Total |
|
|
100 |
|
% |
|
|
100 |
|
% |
|
|
100 |
|
% |
|
(1) |
Sales to EMS companies are classified by the end markets of their OEM customers. |
|
(2) |
Smartphones are included in the Cellular Phone end market, tablets are included in the Computing/Storage/Peripherals end market and other consumer devices that include wearables, portable video devices and personal headphones are included in the Other end market. |
|
(3) |
Amended for Anaren integration and amounts include activity of Anaren since the acquisition which occurred on April 18, 2018. |
Sales attributable to our five largest OEM customers, which can vary from year to year, collectively accounted for 33%, 32%, and 37%, of our net sales in fiscal years 2019, 2018 and 2017, respectively. Our five largest OEM customers in 2019 were, in alphabetical order, Apple Inc., Huawei Technology Co. Ltd., Northrop Grumman Corporation, Raytheon Company and Robert Bosch GmbH. For the fiscal year 2019, Apple accounted for 15% of our net sales. Sales attributed to OEMs include sales made through EMS providers. Sales to EMS providers comprised approximately 36%, 37%, and 32% of our net sales in fiscal years 2019, 2018 and 2017, respectively. Although our contractual relationships are with the EMS companies, we typically negotiate price and volume requirements directly with the OEMs. In addition, we are on the approved vendor lists of several of our EMS providers. This positions us to participate in business that is awarded at the discretion of the EMS provider.
Our sales and marketing strategy focuses on building long-term relationships with our customers’ engineering and new product introduction personnel early in the product development phase, frequently through strategic account management teams. Traditional build to print opportunities involve TTM engineering with design for manufacture reviews and recommendations for both manufacturability and cost without impacting specifications. Prototype builds to verify design ensue, along with the early stages of production. As the product then matures from the prototype stage to volume production, we shift our focus to the customers’ procurement departments in order to capture sales at each point in the product’s life cycle. Our design to specification capabilities allow us to engage at the onset in the engineering cycle at critical aerospace and defense, automotive, telecommunications, and networking customers as they begin the process of specifying an RF requirement. At that stage, we are able to support our customers by designing a complete or specific portions of an RF solution as well as providing early prototyping and test support for that solution. TTM will then provide the ramp to volume and volume production requirements for our customers.
Our staff of engineers, sales support personnel, and managers assists our sales representatives in advising customers with respect to manufacturing feasibility, design review, and technological capabilities through direct communication and visits. We combine our sales efforts with customer service personnel at each facility to better serve our customers. Each large customer is typically assigned an account manager to coordinate all of the Company’s services across all of our facilities. Additionally, the largest and most strategic customers are also supported by select program management and engineering teams. Our global sales force is comprised of direct sales personnel, complemented by commission-based independent representatives, and supports customers throughout North America, Europe, Asia and the Middle East.
10
Our North America footprint comprises a significant amount of our PCB reportable segment with seventeen PCB fabrication plants located in California, Colorado, Connecticut, New Hampshire, New York, Ohio, Oregon, Utah, Virginia, Wisconsin, and Ontario, Canada. The footprint includes two facilities that provide follow-on value-added services.
Our China footprint includes facilities from both our PCB and E-M Solutions reportable segments with nine PCB fabrication plants located in Hong Kong, Huiyang, Dongguan, Guangzhou, Shanghai, Suzhou and Zhongshan, China, and three custom assembly and system integration operations in Shanghai and Shenzhen, China.
For certain risks attendant to our foreign operations, see Item 1A, Risk Factors.
For information regarding credit to customers, see Note 11 of the Notes to Consolidated Financial Statements.
Suppliers
The primary raw materials we use in PCB manufacturing include copper-clad laminate, chemical solutions such as copper and gold for plating operations, photographic film, carbide drill bits, and plastic for testing fixtures. Although we have preferred suppliers for some raw materials used in the manufacture of PCBs, most of our raw materials are generally readily available in the open market from numerous other potential suppliers.
The primary raw materials we use in RF components, RF subsystems, backplane assemblies and other PCB assemblies are manufactured components such as PCBs, ceramic and ferrite substrates, connectors, capacitors, resistors, diodes and integrated circuits, many of which are custom made and controlled by our customers’ approved vendors. The more complicated RF subsystems may require us to purchase integrated sub-assemblies and super-components such as RF Oscillators, Frequency Converters, Power Supplies and Microprocessors. These components for backplane assemblies and other PCB assemblies in some cases have limited or sole sources of supply. For example, in some instances, our customers will require us to use a specific component from a particular supplier or require us to use a component provided by the customer itself, in which case we may have a single or limited number of suppliers for these specific components. The backplane assemblies, PCB assemblies and precision metal fabricated chassis and enclosures produced by us may be incorporated into a fully integrated and tested system delivered to our customer. These products often incorporate procured power, thermal, interconnect and mechanical components sourced from customer directed or our selected suppliers.
We typically use just-in-time procurement practices to maintain our raw materials inventory at low levels and work closely with our suppliers to obtain technologically advanced raw materials. In addition, we periodically seek alternative supply sources to ensure that we are receiving competitive pricing and service. While we have experienced shortages in the market place for certain specific raw materials, we believe we can acquire adequate raw materials in the future.
Competition
Despite industry consolidation, the PCB industry remains fragmented and characterized by intense competition. There are several competitive factors our customers consider when choosing their supplier including, but not limited to, technical capabilities, pricing, service, support, reliability, and quality production. Our principal PCB and substrate competitors include AT&S (Austria Technologie & Systemtechnik Aktiengesellschaft), BoardTek Electronics Corporation, Chin-Poon Industrial Co., Ltd., Compeq Manufacturing Co., Ltd., IBIDEN Co., Ltd., ISU Petasys Co., Ltd., Suzhou Dongshan Precision Manufacturing Co., Ltd., Sanmina Corporation, Tripod Technology Corporation, Unimicron Technology Corporation, and WUS Printed Circuit Co., Ltd. Our principal E-M Solutions competitors include Amphenol Corporation, Flex Ltd., Jabil Inc., and Sanmina Corporation. Our competition for RF products include Cobham plc, Crane Aerospace & Electronics, TRM Microwave, Mercury Systems, Inc., AVX Corporation, Molex, and Smiths Group plc.
We believe that our key competitive strengths include:
Leading global PCB manufacturer. We are one of the largest and most diversified PCB manufacturers in the world and enjoy significant economies of scale, with net sales of approximately $2.7 billion for fiscal 2019. The PCB industry is highly fragmented with the top 20 PCB providers comprising approximately 51% of market share in 2018, according to NTI. As our customers consolidate their supply base, we offer the technology breadth and scale to emerge as a preferred partner.
Breadth of technology and products. We offer a wide range of PCB and RF products as well as electro-mechanical solutions, including HDI PCBs, conventional PCBs, flexible PCBs, rigid-flex PCBs, custom assemblies, passive RF components, advanced ceramic RF components, hi-reliability multi-chip modules, beamforming and switching networks, and integrated circuit (IC) substrates. We also offer certain value-added services to support our customers’ needs. These include RF design to specification capability, design for manufacturability (DFM), PCB layout design, simulation and testing services, and QTA services. By providing these value-added services to customers, we are able to provide our customers with a “one-stop” manufacturing solution, which we believe enhances our relationships with our customers.
11
Diversified business model. Our sales are diversified by a well-balanced portfolio of end markets which we serve and by the customers we sell to within those end markets. We believe this diversity reduces our exposure to, and reliance on, any single end market or customer. We enjoy a large and diverse customer base with over 1,900 customers, as well as long-term relationships in excess of ten years with our ten largest customers. For fiscal 2019, net sales to our top five customers represented approximately 33% of our total net sales. Furthermore, for fiscal 2019, our largest five customers are not concentrated in any single end market, but rather are represented across four of our end markets.
Focused on attractive end markets with a favorable growth outlook and dependence on sophisticated product capabilities. We believe that our global manufacturing footprint and breadth of capabilities enables us to serve multiple key end markets for the PCB industry. The automotive industry in particular provides an opportunity for us as we combine our traditional market strength in core automotive engine controls with the advanced technologies and RF capabilities we offer for growing requirements in safety systems, automated driving and infotainment.
One-stop solution for customers. We are capable of providing a one-stop manufacturing solution to our customers from engineering support and prototype development through final volume production around the globe. This one-stop manufacturing solution allows us to better serve our customers, many of whom are based in time-critical high growth markets, enabling our customers to reduce the time required to develop new products and bring them to market. We utilize a facility specialization strategy in which each customer is directed to the facility best suited to the customer’s product type, delivery time, complexity and volume needs, which enables us to reduce the time from order placement to delivery. As our customers ramp to volume, we are positioned to seamlessly transition them to one of our volume facilities in China.
Leading aerospace and defense supplier. We have passed OEM and government certification processes, and administrative requirements associated with participation in government and commercial aerospace programs. When supplying various departments and agencies of the U.S. government, we are required to maintain facility security clearances under the National Industrial Security Program Operating Manual and International Traffic in Arms Regulations. Along with supply of traditional and RF PCBs, we offer a variety of RF components and sub-assemblies, as well as our engineering services and assembly capabilities which allow us to bring additional value to our customers.
Seasonality
Orders for our products generally correspond to the production schedules of our customers. We historically experience higher net sales in the third and fourth quarters due to end customer demand in the fourth quarter for consumer electronic products. Seasonal fluctuations also include the Chinese New Year holidays in the first quarter, which typically results in lower net sales. We attribute this decline to shutdowns of our customers’ and our own China based manufacturing facilities surrounding the Chinese New Year public holidays, which normally occur in January or February of each year.
Backlog
Backlog consists of purchase orders received, including, in some instances, demand agreements released for production under customer contracts. We obtain firm purchase orders from our customers for all products. However, for some of these purchase orders, customers do not make firm schedules for delivery more than 90 days in advance. Therefore, we measure backlog as orders with deliveries scheduled over the next 90 days. As of December 30, 2019, total backlog was $511.2 million, compared with $458.4 million at the end of 2018. Substantially all backlog as of December 30, 2019 is expected to be converted to sales in the first quarter of 2020. Additionally, we typically experience a higher amount of backlog in the second half of the year due to increased end customer demand for consumer electronic products in the fourth quarter, which is consistent with our seasonal patterns as discussed above.
Intellectual Property
The Anaren business that we acquired designs and manufactures products for its existing customer base and also designs off-the-shelf products for the customers we serve. With the Anaren acquisition, we acquired an additional thirty-six patents to complement our existing patent portfolio. Because our PCB business depends on the effectiveness of our fabrication techniques, proprietary PCB structures, and our ability to continually improve our manufacturing processes, we have strategically limited patent and trade secret protection for our PCB products and manufacturing processes relative to our size as a company. We rely on the collective experience of our employees in the manufacturing process to ensure that we continuously evaluate and adopt new technologies available within our industry. In addition, we depend on robust training, recruiting, and retention of our employees, who are required to be knowledgeable in the operation of advanced equipment and complicated manufacturing processes. In 2019, we acquired assets and technology, including ninety-six legacy patents, from i3 Electronics, Inc. (i3). The know how coupled with the patents we acquired from i3 will enable us to further expand our technology offering to our customer base in North America and we will migrate such technology to our global production facilities where possible. In regards to our RF products, the vast majority are proprietary and protected or covered by thirty-two patents and ten currently pending patent applications directed towards products for both the wireless infrastructure and aerospace and defense markets. We now have a total of 170 patents.
12
National Security Matters
A portion of our business consists of manufacturing defense and defense-related items for various departments and agencies of the U.S. government, including the U.S. Department of Defense (DoD), which requires that we maintain facility security clearances under the National Industrial Security Program Operating Manual, or NISPOM. The NISPOM requires that a corporation with significant foreign ownership maintaining a facility security clearance take steps to prevent foreign control or influence, referred to as “FOCI.” Pursuant to these laws and regulations, effective October 2010, we entered into a Special Security Agreement (SSA) with the DoD; Su Sih (BVI) Limited, or Su Sih (a foreign owner of our capital stock), and Mr. Tang Hsiang Chien (as the beneficial owner of Su Sih). At that time, Su Sih owned approximately 35% of the total outstanding shares of our common stock. The purpose of the SSA is to deny Mr. Tang, Su Sih, and other persons affiliated with our China operations, unauthorized access to classified and export controlled unclassified information and to mitigate any influence over our business or management in a manner that could result in the compromise of classified information or could adversely affect the performance of classified contracts. As of December 30, 2019, Su Sih owned approximately 5.8% of the total outstanding shares of our common stock.
Other Governmental Regulations
Our operations, particularly those in North America, are subject to a broad range of regulatory requirements relating to export control, environmental compliance, waste management, and health and safety matters. In particular, we are subject to the following:
|
|
• |
U.S. Department of State regulations, including the Arms Export Control Act (AECA) and International Traffic In Arms Regulations (ITAR) located at 22 CFR Parts 120-130; |
|
|
• |
U.S. Department of Commerce regulations, including the Export Administration Regulations (EAR) located at 15 CFR Parts 730-744; |
|
|
• |
Office of Foreign Asset Control (OFAC) regulations located at 31 CFR Parts 500-599; |
|
|
• |
U.S. Occupational Safety and Health Administration (OSHA), and state OSHA and Department of Labor laws pertaining to health and safety in the workplace; |
|
|
• |
U.S. Environmental Protection Agency regulations pertaining to air emissions; waste water discharges; and the use, storage, discharge, and disposal of hazardous chemicals used in the manufacturing processes; the reporting of chemical releases to the environment; and the reporting of chemicals manufactured in by-products that are beneficially recycled; |
|
|
• |
Department of Homeland Security regulations regarding the storage of certain chemicals of interest; |
|
|
• |
corresponding state laws and regulations, including site investigation and remediation; |
|
|
• |
corresponding U.S., county and city agencies; |
|
|
• |
corresponding regulations and agencies in China for our Chinese facilities; |
|
|
• |
material content directives and laws that ban or restrict certain hazardous substances in products sold in member states of the European Union, China, and other countries and jurisdictions; |
|
|
• |
SEC rules that require reporting of the use of certain metals (conflict minerals) originating in the Democratic Republic of the Congo and the 9 countries surrounding it pursuant to Section 1502 of the Dodd-Frank Act; and |
|
|
• |
reporting requirements of the California Transparency in Supply Chains Act of 2010 that requires reporting on efforts to eradicate slavery and human trafficking in retailers’ and manufacturers’ supply chains. |
The process to manufacture PCBs requires adherence to city, county, state, federal, and foreign environmental laws and regulations regarding the storage, use, handling, and disposal of chemicals, solid wastes and other hazardous materials, as well as compliance with wastewater and air quality standards. We believe that our facilities in the United States and Canada comply in all material respects with applicable environmental laws and regulations. In China, the government has a history of changing legal requirements with no or minimal notice. We believe that our facilities in China comply in all material respects with current applicable environmental laws and regulations and has resources in place to maintain compliance to them. The capital expenditure costs expected for environmental improvement initiatives are included in our annual capital expenditure projections.
Employees
As of December 30, 2019, we had approximately 25,700 employees. Of our employees, approximately 24,200 were involved in manufacturing and engineering, 600 worked in sales and marketing, and approximately 900 worked in accounting, information systems and other support capacities. None of our North American employees are represented by unions. In China, approximately 14,500 employees are members of the All-China Federation of Trade Unions and accordingly are considered to be represented by a labor union. We have not experienced any labor problems resulting in a work stoppage and we believe that we have good relations with our employees.
13
Availability of Reports Filed with the Securities and Exchange Commission
We are a Delaware corporation founded in 1998, with our principal executive offices located at 200 East Sandpointe, Suite 400, Santa Ana, CA 92707. Our telephone number is (714) 327-3000. Our website address is www.ttm.com. Information included on our website is not incorporated into this report. Our annual reports on Form 10-K, quarterly reports on Form 10-Q, current reports on Form 8-K and amendments to those reports are available without charge on our website at https://investors.ttm.com/, as soon as reasonably practicable after they are filed with or furnished electronically to the Securities and Exchange Commission (SEC). Our SEC filings are also available to the public at www.sec.gov. Copies are also available without charge by (i) telephonic request by calling our Investor Relations Department at (714) 327-3000, (ii) e-mail request to investor@ttmtech.com, or (iii) a written request to TTM Technologies, Inc., Attention: Investor Relations, 200 East Sandpointe, Suite 400, Santa Ana, CA 92707.
|
ITEM 1A. |
RISK FACTORS. |
An investment in our common stock involves a high degree of risk. You should carefully consider the factors described below, in addition to those discussed elsewhere in this report, in analyzing an investment in our common stock. If any of the events described below occurs, our business, financial condition, and results of operations would likely suffer, the trading price of our common stock could fall, and you could lose all or part of the money you paid for our common stock. The risk factors described below are not the only ones we face. Risks and uncertainties not known to us currently, or that may appear immaterial, also may have a material adverse effect on our business, financial condition, and results of operations.
In addition, the following risk factors and uncertainties could cause our actual results to differ materially from those projected in our forward-looking statements, whether made in this report or the other documents we file with the SEC, or our annual or quarterly reports to stockholders, future press releases, or orally, whether in presentations, responses to questions, or otherwise.
Risks Related to our Business
We serve customers and have manufacturing facilities outside the United States and are subject to global pandemic risks which could materially adversely affect our business, financial condition, and results of operations.
Global pandemics or other disasters or public health concerns in regions of the world where we have operations or source material or sell products, such as outbreaks of novel coronavirus or H1N1 flu could result in the disruption of our business. Specifically, the ongoing coronavirus outbreak emanating from China at the beginning of 2020 has resulted in increased travel restrictions and extended shutdowns of certain businesses in the region. These or any governmental developments or health concerns in China or other countries in which we operate could result in social, economic, or labor instability. Although we are monitoring the situation on a daily basis, it is currently unknown whether the outbreak will continue to disrupt our product shipments or impact manufacturing in the region over a prolonged period. If such disruption were to extend over a prolonged period, it could have a material adverse impact on our business and our financial results. Any disruption resulting from similar events could also cause significant delays in shipments of our products until we are able to resume normalized operations and this could have a material negative impact on our results of operations and cash flows.
We serve customers and have manufacturing facilities outside the United States and are subject to the risks characteristic of international operations, including recently imposed tariffs.
We have significant manufacturing operations in Asia and Canada and sales offices located in Asia and Europe, and we continue to consider additional opportunities to make foreign investments and construct new foreign facilities.
For the year ended December 30, 2019, we generated approximately 62% of our net sales from non-U.S. operations, and a significant portion of our manufacturing material was provided by international suppliers during this period. The United States’ trade policies and those of foreign countries are subject to change which could adversely affect our ability to purchase and sell goods and materials without significant tariffs, taxes or duties that may be imposed on the materials we purchase or the goods we sell, thereby increasing the cost of such materials and potentially decreasing our margins. Further, our revenues could be impacted if our customers’ ability to sell their goods is reduced by such tariffs, taxes or duties. Both the U.S. and Chinese governments have included PCBs among items subjected to tariffs imposed on imports from such countries, which may negatively impact our revenue and profitability. In addition, we are subject to risks relating to significant international operations, including but not limited to:
|
|
• |
managing international operations; |
|
|
• |
imposition of governmental controls; |
|
|
• |
unstable regulatory environments; |
|
|
• |
compliance with employment laws; |
|
|
• |
implementation of disclosure controls, internal controls, financial reporting systems, and governance standards to comply with U.S. accounting and securities laws and regulations; |
|
|
• |
limitations on imports or exports of our product offerings; |
14
|
|
• |
fluctuations in the value of local currencies; |
|
|
• |
inflation or changes in political and economic conditions; |
|
|
• |
labor unrest, rising wages, difficulties in staffing, and geographical labor shortages; |
|
|
• |
government or political unrest; |
|
|
• |
longer payment cycles; |
|
|
• |
language and communication barriers, as well as time zone differences; |
|
|
• |
cultural differences; |
|
|
• |
increases in duties and taxation levied on our products; |
|
|
• |
other potentially adverse tax consequences; |
|
|
• |
imposition of restrictions on currency conversion or the transfer of funds; |
|
|
• |
travel restrictions; |
|
|
• |
expropriation of private enterprises; |
|
|
• |
the potential reversal of current favorable policies encouraging foreign investment and trade; |
|
|
• |
the potential for strained trade relationships between the United States and its trading partners, including trade tariffs which could create competitive pricing risk; and |
|
|
• |
government imposed sanction laws and regulations. |
Our operations in China subject us to risks and uncertainties relating to the laws and regulations of China.
Under its current leadership, the government of China has been pursuing economic reform policies, including the encouragement of foreign trade and investment. No assurance can be given, however, that the government of China will continue to pursue such policies, that such policies will be successful if pursued, or that such policies will not be significantly altered from time to time, particularly in light of the increasingly tense trade climate with the United States. Despite progress in developing its legal system, China does not have a comprehensive and highly developed system of laws, particularly with respect to foreign investment activities and foreign trade. Enforcement of existing and future laws and contracts is uncertain, and implementation and interpretation thereof may be inconsistent. As the Chinese legal system develops, the promulgation of new laws, changes to existing laws, and the preemption of local regulations by national laws may adversely affect foreign investors. Further, any litigation in China may be protracted and may result in substantial costs and diversion of resources and management’s attention. In addition, though changes in government policies and rules are timely published or communicated, there is usually no indication of the duration of any grace period before which full implementation and compliance will be required. As a result, it is possible that we might operate our business in violation of new rules and policies before full compliance can be achieved. These uncertainties could limit the legal protections available to us and adversely impact our results of operations.
Uncertainty and adverse changes in the economy and financial markets could have an adverse impact on our business and operating results.
Uncertainty or adverse changes in the economy could lead to a significant decline in demand for the end products manufactured by our customers, which, in turn, could result in a decline in the demand for our products and pressure to reduce our prices. Any decrease in demand for our products could have an adverse impact on our financial condition, operating results and cash flows. Uncertainty and adverse changes in the economy could also increase the cost and decrease the availability of potential sources of financing and increase our exposure to losses from bad debts, either of which could have a material adverse effect on our financial condition, operating results and cash flows.
We participate in the competitive, cyclical automotive industry, which is subject to strict quality control standards. Failure to meet quality standards may adversely affect our business, financial condition and results of operations.
A significant portion of our sales are to customers within the telecommunications and automotive industry. The telecommunications industry is characterized by intense competition, relatively short product life cycles, and significant fluctuations in product demand, which is heavily dependent on the end markets it serves and therefore can be affected by the demand patterns of those markets. If the volatility in the telecommunications industry continues, it may have a material adverse effect on our business, financial condition and result of operations. The automotive industry has historically experienced multi-year cycles of growth and decline. If sales of automobiles should decline or go into a cyclical down turn, our sales could decline and this could have a materially adverse impact on our business, financial condition and result of operations.
In addition, for safety reasons, automotive customers have strict quality standards that generally exceed the quality requirements of other customers. If such products do not meet these quality standards, our business, financial condition, and results of operations
15
may be materially adversely affected. These automotive customers may require long periods of time to evaluate whether our manufacturing processes and facilities meet their quality standards. If we were to lose automotive customers due to quality control issues, we might not be able to regain those customers or gain new automotive customers for long periods of time, which could have a material adverse effect on our business, financial condition, and results of operations. Moreover, we may be required under our contracts with automotive industry customers to indemnify them for the cost of warranties and recalls relating to our products.
We rely on the cellular phone and mobile technology industry for a significant portion of sales. The economic volatility in this industry has had, and may continue to have, a material adverse effect on our ability to forecast demand and production and to meet desired sales levels.
A large percentage of our business is conducted with customers who are in the cellular phone and mobile technology industry. This industry is characterized by intense competition, short product life cycles, seasonality, particularly around the year-end holiday season, and significant fluctuations in consumer demand. This industry is heavily dependent on consumers and therefore can be affected by their demand patterns. If the volatility in this industry continues, it may have a material adverse effect on our business, financial condition, and results of operations.
We have pursued and intend to continue to pursue potential divestitures of assets and acquisitions of other businesses and may encounter risks associated with these activities, which could harm our business and operating results.
As part of our business strategy, we expect that we will continue to align our strategy by pursuing potential divestitures of assets and acquisitions of businesses, technologies, assets, or product lines that complement or expand our business. Risks related to such activity may include:
|
|
• |
the potential inability to successfully integrate acquired operations and businesses or to realize anticipated synergies, economies of scale, or other expected value; |
|
|
• |
diversion of management’s attention from normal daily operations of our existing business to focus on integration of the newly acquired business; |
|
|
• |
unforeseen expenses associated with the integration of the newly acquired business; |
|
|
• |
difficulties in managing production and coordinating operations at new sites; |
|
|
• |
the potential loss of key employees of acquired or divested operations; |
|
|
• |
the potential inability to retain existing customers of acquired companies when we desire to do so; |
|
|
• |
insufficient revenues to offset increased expenses associated with acquisitions; |
|
|
• |
the potential decrease in overall gross margins associated with acquiring a business with a different product mix; |
|
|
• |
the inability to identify certain unrecorded liabilities; |
|
|
• |
the inability to consummate a potential divestiture due to regulatory constraints; |
|
|
• |
the separation of business infrastructure involved in a potential divestiture may create disruption in our business; |
|
|
• |
the tax burden related to the divestiture may be larger than expected; |
|
|
• |
the potential divestiture of assets or product lines could create dis-synergies and change our profitability; |
|
|
• |
the potential need to restructure, modify, or terminate customer relationships of the acquired or divested assets or company; |
|
|
• |
an increased concentration of business from existing or new customers; and |
|
|
• |
the potential inability to identify assets best suited to our business plan. |
Acquisitions may cause us to:
|
|
• |
enter lines of business and/or markets in which we have limited or no prior experience; |
|
|
• |
issue debt and be required to abide by stringent loan covenants; |
|
|
• |
assume liabilities; record goodwill and intangible assets that will be subject to impairment testing and potential periodic impairment charges; |
16
|
|
• |
become subject to litigation and environmental issues, which include product material content certifications related to conflict minerals; |
|
|
• |
incur unanticipated costs; |
|
|
• |
incur large and immediate write-offs; and |
|
|
• |
incur substantial transaction-related costs, whether or not a proposed acquisition is consummated. |
Acquisitions of high technology companies are inherently risky, and no assurance can be given that our recent or future acquisitions will be successful. Failure to manage and successfully integrate acquisitions we make could have a material adverse effect on our business, financial condition, and results of operations. Even when an acquired company has already developed and marketed products, product enhancements may not be made in a timely fashion. In addition, unforeseen issues might arise with respect to such products after any such acquisition.
If we are unable to maintain satisfactory capacity utilization rates, our business, financial condition, and results of operations would be materially adversely affected.
Given the high fixed costs of our operations, decreases in capacity utilization rates can have a significant effect on our business. Accordingly, our ability to maintain or enhance gross margins will continue to depend, in part, on maintaining satisfactory capacity utilization rates. In turn, our ability to maintain satisfactory capacity utilization will depend on the demand for our products, the volume of orders we receive, and our ability to offer products that meet our customers’ requirements at competitive prices. If current or future production capacity fails to match current or future customer demands, our facilities would be underutilized, our sales may not fully cover our fixed overhead expenses, and we would be less likely to achieve expected gross margins. If forecasts and assumptions used to support the realizability of our long-lived assets change in the future, significant impairment charges could result that would materially adversely affect our business, financial condition, and results of operations.
In addition, we generally schedule our quick turnaround production facilities at less than full capacity to retain our ability to respond to unexpected additional quick-turn orders. However, if these orders are not received, we may forego some production and could experience continued excess capacity. If we conclude we have significant, long-term excess capacity, we may decide to permanently close one or more of our facilities and lay off some of our employees. Closures or lay-offs could result in our recording restructuring charges such as severance, other exit costs, and asset impairments, as well as potentially causing disruptions in our ability to supply customers.
We have substantial outstanding indebtedness, and our outstanding indebtedness could adversely impact our liquidity and flexibility in obtaining additional financing, our ability to fulfill our debt obligations and our financial condition and results of operations.
We have substantial debt and, as a result, we have significant debt service obligations. We maintain $250.0 million of Convertible Senior Notes due 2020 at an interest rate of 1.75%, a $805.9 million Term Loan Facility due 2024 (Term Loan Facility) at a floating rate of LIBOR plus 2.5%, $375.0 million of Senior Notes due 2025 (Senior Notes) at an interest rate of 5.63%, $40.0 million outstanding under a $150.0 million U.S. Asset-Based Lending Credit Agreement (U.S. ABL), and $30.0 million outstanding under a $150.0 million Asia Asset-Based Lending Credit Agreement (Asia ABL). We and a number of our direct and indirect subsidiaries also have various credit facilities and letters of credit. Such agreements also contain certain financial covenants which require us to maintain, under the occurrence of certain events, a consolidated fixed charge coverage ratio.
Subject to the limits contained in the credit agreements governing the Term Loan Facility, the U.S. ABL, the Asia ABL, the indenture governing the Senior Notes, and our other debt instruments, we may be able to incur substantial additional debt from time to time to finance working capital, capital expenditures, investments or acquisitions, or for other purposes. If we do so, the risks related to our high level of debt could intensify. Specifically, our high level of debt could have important consequences to us and our shareholders. For example, it could:
|
|
• |
make it more difficult for us to satisfy our obligations with respect to our indebtedness, which could in turn result in an event of default on such indebtedness; |
|
|
• |
require us to use a substantial portion of our cash flow from operations for debt service payments, thereby reducing the availability of cash for working capital, capital expenditures, acquisitions and other general corporate purposes; |
|
|
• |
impair our ability to obtain additional financing in the future for working capital, capital expenditures, acquisitions and other investments or general corporate purposes, which may limit our ability to execute our business strategy; |
|
|
• |
diminish our ability to withstand a downturn in our business, the industry in which we operate or the economy generally and restrict us from exploiting business opportunities or making acquisitions; |
|
|
• |
limit our flexibility in planning for, or reacting to, changes in our business and the industry in which we operate or the general economy; |
17
|
|
• |
increase our vulnerability to general adverse economic and industry conditions, including movements in interest rates, which could result in increased borrowing costs; |
|
|
• |
limit management’s discretion in operating our business; and |
|
|
• |
place us at a competitive disadvantage as compared to our competitors that have less debt as it could limit our ability to capitalize on future business opportunities and to react to competitive pressures or adverse changes. |
In addition, the indenture governing the Senior Notes and the credit agreements governing the Term Loan Facility, the U.S. ABL and the Asia ABL contain restrictive covenants that will limit our ability to engage in activities that may be in our long-term best interest. Our failure to comply with those covenants could result in an event of default which, if not cured or waived, could result in the acceleration of all our debt.
We have a significant amount of goodwill and other intangible assets on our consolidated balance sheet. If our goodwill or other intangible assets become impaired in the future, we would be required to record a non-cash charge to earnings, which may be material and would also reduce our stockholders’ equity.
As of December 30, 2019, our consolidated balance sheet included $1,106.8 million of goodwill and definite-lived intangible assets. We periodically evaluate whether events and circumstances have occurred, such that the potential for reduced expectations for future cash flows coupled with further decline in the market price of our stock and market capitalization may indicate that the remaining balance of goodwill and definite-lived intangible assets may not be recoverable. If factors indicate that assets are impaired, we would be required to reduce the carrying value of our goodwill and definite-lived intangible assets, which could harm our results during the periods in which such a reduction is recognized.
We rely on suppliers and equipment manufacturers for the timely delivery of raw materials, components, equipment and spare parts used in manufacturing our PCBs and E-M Solutions. If a raw material supplier or equipment manufacturer goes bankrupt, liquidates, consolidates out of existence or fails to satisfy our product quality standards, it could harm our ability to purchase new manufacturing equipment, service the equipment we have, or timely produce our products, thereby affecting our customer relationships.
Consolidations and restructuring in our supplier base and equipment fabricators related to our raw materials purchases or the manufacturing equipment we use to fabricate our products may result in adverse changes in pricing of materials due to reduction in competition among our raw material suppliers or an elimination or shortage of equipment and spare parts from our manufacturing equipment supply base. Suppliers and equipment manufacturers may be impacted by other events outside our control including macro-economic, financial instability, environmental occurrences, or supplier interruptions due to fire, natural catastrophes or otherwise. Suppliers and equipment manufacturers may extend lead times, limit supplies, or increase prices due to capacity constraints or other factors, which could harm our ability to deliver our products on a timely basis and negatively impact our financial results. In addition, in extreme circumstances, the suppliers we purchase from could cease production due to a fire, natural disaster, consolidation or liquidation of their businesses. As such, this may impact our ability to deliver our products on a timely basis and harm our customer relationships and negatively impact our financial results.
Our results of operations are often subject to demand fluctuations and seasonality. With a high level of fixed operating costs, even small revenue shortfalls would decrease our gross margins.
Our results of operations fluctuate for a variety of reasons, including:
|
|
• |
timing of orders from and shipments to major customers; |
|
|
• |
the levels at which we utilize our manufacturing capacity; |
|
|
• |
price competition; |
|
|
• |
changes in our mix of revenues generated from quick-turn versus standard delivery time services; |
|
|
• |
expenditures, charges or write-offs, including those related to acquisitions, facility restructurings, or asset impairments; and |
|
|
• |
expenses relating to expanding existing manufacturing facilities. |
A significant portion of our operating expenses is relatively fixed in nature, and planned expenditures are based in part on anticipated orders. Accordingly, unexpected revenue shortfalls may decrease our gross margins. In addition, we have experienced sales fluctuations due to seasonal patterns in the capital budgeting and purchasing cycles, as well as inventory management practices of our customers and the end markets we serve. In particular, the seasonality of the cellular phone and tablet industries and quick-turn ordering patterns affect the overall PCB industry. These seasonal trends have caused fluctuations in our operating results in the past and may continue to do so in the future. Results of operations in any period should not be considered indicative of the results that may be expected for any future period. In addition, our future quarterly operating results may fluctuate and may not meet the expectations of securities analysts or investors.
18
Despite our current level of indebtedness, we and our subsidiaries may decide to incur substantially more debt. This could further exacerbate the risks to our financial condition described above.
We and our subsidiaries may decide to incur significant additional indebtedness in the future. Although the indenture governing the Senior Notes and the credit agreements governing the Term Loan Facility, the U.S. ABL and the Asia ABL will contain restrictions on the incurrence of additional indebtedness, these restrictions are subject to a number of qualifications and exceptions, and the additional indebtedness incurred in compliance with these restrictions could be substantial. These restrictions also will not prevent us from incurring obligations that do not constitute indebtedness.
A lowering or withdrawal of the ratings assigned to our debt securities by rating agencies may increase our future borrowing costs and reduce our access to capital.
Our debt has a non-investment grade rating, and any rating assigned could be lowered or withdrawn entirely by a rating agency if, in that rating agency’s judgement, future circumstances relating to the basis of rating, such as adverse changes, so warrant. Any future lowering of our ratings likely would make it more difficult or more expensive for us to obtain additional debt financing.
Possible replacement of the LIBOR benchmark interest rate may have an impact on our financial condition or results of operations.
On July 27, 2017, the Financial Conduct Authority (FCA), a regulator of financial services firms in the United Kingdom, announced that it intends to stop persuading or compelling banks to submit LIBOR rates after 2021. The FCA and the submitting LIBOR banks have indicated they will support the LIBOR indices through 2021 to allow for an orderly transition to an alternative reference rate. In the United States, efforts to identify a set of alternative U.S. dollar reference interest rates include proposals by the Alternative Reference Rates Committee of the Federal Reserve Board. Other financial service regulators and industry groups are evaluating the possible phase-out of LIBOR and the development of alternate reference rate indices or reference rates. Many of our assets and liabilities are indexed to LIBOR. We are evaluating the potential impact of the possible replacement of the LIBOR benchmark interest rate, but are not able to predict whether LIBOR will cease to be available after 2021, whether the alternative rates the Federal Reserve Board proposes to publish will become market benchmarks in place of LIBOR, or what the impact of such a transition will have on our financial condition or results of operations.
We are exposed to the credit risk of some of our customers and to credit exposures in weakened markets.
Most of our sales are on an “open credit” basis, with standard industry payment terms. We monitor individual customer payment capability in granting such open credit arrangements, seek to limit such open credit to amounts we believe the customers can pay, and maintain reserves we believe are adequate to cover exposure for doubtful accounts. During periods of economic downturn in the electronics industry and the global economy, our exposure to credit risks from our customers increases. Although we have programs in place to monitor and mitigate the associated risks, such programs may not be effective in reducing our credit risks.
Additionally, our OEM customers often direct a significant portion of their purchases through a relatively limited number of EMS companies. Sales to EMS companies represented approximately 36%, 37% and 32% of our net sales for the years ended December 30, 2019, December 31, 2018 and January 1, 2018, respectively. Our contractual relationship is often with the EMS companies, who are obligated to pay us for our products. Because we expect our OEM customers to continue to direct our sales to EMS companies, we expect to continue to be subject to this credit risk with a limited number of EMS customers. If one or more of our significant customers were to become insolvent or were otherwise unable to pay us, our business, financial condition, and results of operations would be materially adversely affected.
We depend upon a relatively small number of OEM customers for a large portion of our sales, and a decline in sales to major customers would materially adversely affect our business, financial condition, and results of operations.
A small number of customers are responsible for a significant portion of our sales. Our five largest OEM customers accounted for approximately 33%, 32% and 37% of our net sales for the years ended December 30, 2019, December 31, 2018 and January 1, 2018, respectively, and one customer represented 15% of our net sales for the year ended December 30, 2019. Sales attributed to OEMs include both direct sales as well as sales that the OEMs place through EMS providers. Our customer concentration could fluctuate, depending on future customer requirements, which will depend in large part on market conditions in the electronics industry segments in which our customers participate. The loss of one or more significant customers or a decline in sales to our significant customers would materially adversely affect our business, financial condition, and results of operations. In addition, we generate significant accounts receivable in connection with providing manufacturing services to our customers. If one or more of our significant customers were to become insolvent or were otherwise unable to pay for the manufacturing services provided by us, our business, financial condition, and results of operations would be materially adversely affected.
In addition, during industry downturns, we may need to reduce prices to limit the level of order losses, and we may be unable to collect payments from our customers. There can be no assurance that key customers would not cancel orders, that they would continue to place orders with us in the future at the same levels as experienced by us in prior periods, that they would be able to meet their payment obligations, or that the end-products that use our products would be successful. This concentration of customer base may materially adversely affect our business, financial condition, and results of operations due to the loss or cancellation of business from
19
any of these key customers, significant changes in scheduled deliveries to any of these customers, or decreases in the prices of the products sold to any of these customers.
We are heavily dependent upon the worldwide electronics industry, which is characterized by economic cycles and fluctuations in product demand. A downturn in the electronics industry or prolonged global economic crisis could result in decreased demand for our manufacturing services and materially adversely affect our business, financial condition, and results of operations.
A majority of our revenue is generated from the electronics industry, which is characterized by intense competition, relatively short product life cycles, and significant fluctuations in product demand. The industry is subject to economic cycles and recessionary periods. Due to the uncertainty in the end markets served by most of our customers, we have a low level of visibility with respect to future financial results. Consequently, our past operating results, earnings, and cash flows may not be indicative of our future operating results, earnings, and cash flows.
Our manufacturing processes depend on the collective industry experience of our employees. If a significant number of these employees were to leave us, it could limit our ability to compete effectively and could materially adversely affect our business, financial condition, and results of operations.
We have limited patent or trade secret protection for our manufacturing processes. We rely on the collective experience of our employees involved in our manufacturing processes to ensure that we continuously evaluate and adopt new technologies in our industry. Although we are not dependent on any one employee or a small number of employees, if a significant number of our employees involved in our manufacturing processes were to leave our employment, and we were not able to replace these people with new employees with comparable experience, our manufacturing processes might suffer as we might be unable to keep up with innovations in the industry. As a result, we may lose our ability to continue to compete effectively. For example, we have experienced a significant amount of employee attrition in our China operations each year, which has negatively impacted our yield, costs of production, and service times.
Changes in prices or availability of raw materials could have a material adverse effect on our business, financial condition, and results of operations and reduce our gross margins.
To manufacture PCBs, we use raw materials such as laminated layers of fiberglass, copper foil, chemical solutions, gold, copper and other commodity products, which we order from our suppliers. For RF components, we use various high performance materials such as ceramics and printed circuit board materials. In the case of backplane assemblies, components include connectors, sheet metal, capacitors, resistors and diodes, many of which are custom made and controlled by our customers’ approved vendors.
If raw material and component prices increase or if there is inflationary pressure on the cost of the metals that we use to produce our product, especially copper, it may reduce our gross margins. Should the supply of materials used in our above manufacturing processes become limited, our ability to obtain the quantities necessary to meet our customers’ demand may be impacted which could cause us to encounter reduced revenue levels or price increases which would impact our profit margins. If either of these situations occurs, our financial condition and results of operations could be negatively impacted.
We depend on the U.S. government for a significant portion of our business, which involves unique risks. Changes in government defense spending or regulations could have a material adverse effect on our business, financial condition, and results of operations.
A significant portion of our revenues is derived from products and services that are ultimately sold to the U.S. government by our OEM and EMS customers and is therefore affected by, among other things, the federal government budget process. We are a supplier, primarily as a subcontractor, to the U.S. government and its agencies, as well as foreign governments and agencies. The contracts between our direct customers and the government end user are subject to political and budgetary constraints and processes, changes in short-range and long-range strategic plans, the timing of contract awards, the congressional budget authorization and appropriation processes, the government’s ability to terminate contracts for convenience or for default, as well as other risks, such as contractor suspension or debarment in the event of certain violations of legal and regulatory requirements.
For the year ended December 30, 2019, aerospace and defense sales accounted for approximately 26% of our total net sales. The substantial majority of aerospace and defense sales are related to both U.S. and foreign military and defense programs. While we do not sell any significant volume of products directly to the U.S. government, we are a supplier to the U.S. government and its agencies, as well as foreign governments and agencies. Consequently, our sales are affected by changes in the defense budgets of the U.S. and foreign governments and may be affected by federal budget sequestration measures.
The domestic and international threat of terrorist activity, emerging nuclear states, and conventional military threats have led to an increase in demand for defense products and services and homeland security solutions in the recent past. Although a two-year budget agreement has recently been approved by the U.S. government and the budget agreement includes sustained spending on defense programs, the termination or failure to fund one or more significant contracts by the U.S. government could have a material adverse effect on our business, financial condition, and results of operations.
20
Future changes to the U.S. Munitions List could reduce or eliminate restrictions that currently apply to some of the products we produce. If these regulations or others are changed in a manner that reduces restrictions on products being manufactured overseas, we would likely face an increase in the number of competitors and increased price competition from overseas manufacturers, who are restricted by the current export laws from manufacturing products for U.S. defense systems.
We may be unable to hire and retain sufficient qualified personnel, and the loss of any of our key executive officers could materially adversely affect our business, financial condition, and results of operations.
We believe that our future success will depend in large part on our ability to attract and retain highly skilled, knowledgeable, sophisticated, and qualified managerial and professional personnel. We may not be able to retain our executive officers and key personnel or attract additional qualified management in the future. We can make no assurances that future changes in executive management will not have a material adverse effect on our business, financial condition, or results of operations. Our business also depends on our continuing ability to recruit, train, and retain highly qualified employees, particularly engineering and sales and marketing personnel. The competition for these employees is intense, and the loss of these employees could harm our business. Further, our ability to successfully integrate acquired companies depends in part on our ability to retain key management and existing employees at the time of the acquisition.
Increasingly, our customers are requesting that we enter into supply agreements with them that have restrictive terms and conditions. These agreements typically include provisions that increase our financial exposure, which could result in significant costs to us.
Increasingly, our customers are requesting that we enter into supply agreements with them. These agreements typically do not include volume commitments, but do include provisions that generally serve to increase our exposure for product liability and limited sales returns, which could result in higher costs to us as a result of such claims. In addition, these agreements typically contain provisions that seek to limit our operational and pricing flexibility and extend payment terms, which could materially adversely affect our cash flow, business, financial condition, and results of operations.
We may need additional capital in the future to fund investments in our operations, refinance our indebtedness, and to maintain and grow our business, and such capital may not be available on a timely basis, on acceptable terms, or at all.
Our business is capital-intensive, and our ability to increase revenue, profit, and cash flow depends upon continued capital spending. To the extent that the funds generated by our ongoing operations are insufficient to cover our liquidity requirements, we may need to raise additional funds through financings. If we are unable to fund our operations and make capital expenditures as currently planned or if we do not have sufficient liquidity to service the interest and principal payments on our debt, it would have a material adverse effect on our business, financial condition, and results of operations. If we do not achieve our expected operating results, we would need to reallocate our sources and uses of operating cash flows. This may include borrowing additional funds to service debt payments, which may impair our ability to make investments in our business. Looking ahead at long-term needs, we may need to raise additional funds for a number of purposes, including the following:
|
|
• |
to fund capital equipment purchases to increase production capacity, upgrade and expand our technological capabilities and replace aging equipment or introduce new products; |
|
|
• |
to refinance our existing indebtedness; |
|
|
• |
to fund our operations beyond 2020; |
|
|
• |
to fund working capital requirements for future growth that we may experience; |
|
|
• |
to enhance or expand the range of services we offer; |
|
|
• |
to increase our sales and marketing activities; or |
|
|
• |
to respond to competitive pressures or perceived opportunities, such as investment, acquisition, and international expansion activities. |
Should we need to raise funds through incurring additional debt, we may become subject to covenants even more restrictive than those contained in our current debt instruments. There can be no assurance that additional capital, including any future equity or debt financing, would be available on a timely basis, on favorable terms, or at all. If such funds are not available to us when required or on acceptable terms, our business, financial condition, and results of operations could be materially adversely affected.
The Company may experience cash flow volatility.
We experience fluctuations in our revenues and cost structure and the resulting cash flows and expect that this will continue to occur in the future. We experience fluctuations in our cash flows for reasons that include (i) the types and complexity, number, size, timing and duration of client engagements; (ii) the seasonality of our business; (iii) fluctuations in costs of labor; (iv) fluctuations in the cost and availability of raw materials; (v) fluctuations in demand for our products; (vi) the length of billing and collection cycles and changes in amounts that may become uncollectible; (vii) changes in the frequency and complexity of government regulatory and enforcement activities; (viii) timing of customer payments; (ix) fluctuations in the exchange rates of various currencies against the
21
U.S. dollar; and (x) economic factors beyond our control. Such fluctuations could affect our ability to meet our obligations including debt repayments. Any failure to meet our financial obligations could have a material adverse effect on our financial position and results of operations.
Our variable rate indebtedness subjects us to interest rate risk, which could cause our debt service obligations to increase significantly.
Borrowings under the Term Loan Facility, the U.S. ABL and the Asia ABL are at variable rates of interest and expose us to interest rate risk. If interest rates were to increase, our debt service obligations on the variable rate indebtedness would increase even though the amount borrowed remained the same, and our net income and cash flows, including cash available for servicing our indebtedness, will correspondingly decrease. On May 15, 2018, we entered into an interest rate swap arrangement with a notional amount of $400.0 million, which expires on June 1, 2022, in order to reduce interest rate volatility exposure. This arrangement effectively converts $400.0 million of our variable rate debt to fixed rate. Under the terms of the interest rate swap, we would pay a fixed rate of 2.84% and would receive floating 1-month LIBOR during the swap period.
For illustrative purposes and assuming all loans under the Term Loan Facility, the U.S. ABL and the Asia ABL were fully drawn, each quarter point change in interest rates would result in a $1.8 million change in annual interest expense on our indebtedness under the Term Loan Facility, the U.S. ABL and the Asia ABL, after giving effect to our interest rate swap.
We are subject to risks of currency fluctuations.
A portion of our cash, other current assets and current liabilities is held in currencies other than the U.S. dollar. Changes in exchange rates among other currencies and the U.S. dollar will affect the value of these assets or liabilities as re-measured to U.S. dollars on our balance sheet. To the extent that we ultimately decide to repatriate some portion of these funds to the United States, the actual value transferred could be impacted by movements in exchange rates. Any such type of movement could negatively impact the amount of cash available to fund operations or to repay debt. Additionally, we have revenues and costs denominated in currencies other than the U.S. dollar (primarily the RMB). Fluctuations in the exchange rates between the U.S. dollar and the RMB could result in increases or decreases in our costs or revenues which could negatively impact our business, financial condition, and results of operations. Significant inflation or disproportionate changes in foreign exchange rates could occur as a result of general economic conditions, acts of war or terrorism, changes in governmental monetary or tax policy, or changes in local interest rates Further, China’s government imposes controls over the convertibility of RMB into foreign currencies, which subjects us to further currency exchange risk.
If we are unable to respond to rapid technological change and process development, we may not be able to compete effectively.
The market for our manufacturing services is characterized by rapidly changing technology and continual implementation of new production processes. The future success of our business will depend in large part upon our ability to maintain and enhance our technological capabilities, to manufacture products that meet changing customer needs, and to successfully anticipate or respond to technological changes on a cost-effective and timely basis. We expect that the investment necessary to maintain our technological position will increase as customers make demands for products and services requiring more advanced technology on a quicker turnaround basis. For example, in 2020 we expect to continue to make significant capital expenditures to expand our HDI, mSAP, and other advanced manufacturing capabilities. We may not be able to obtain access to additional sources of funds in order to respond to technological changes as quickly as our competitors. In addition, failure to adopt and implement technological improvements quickly may cause inefficiencies as our product yields or quality may decrease, resulting in increased costs.
In addition, the PCB industry could encounter competition from new or revised manufacturing and production technologies that render existing manufacturing and production technology less competitive or obsolete. We may not respond effectively to the technological requirements of the changing market. If we need new technologies and equipment to remain competitive, the development, acquisition, and implementation of those technologies and equipment will require us to make significant capital investments.
Servicing our debt requires a significant amount of cash and we may not be able to generate sufficient cash to service all of our debt and may be forced to take other actions to satisfy our obligations under our debt, which may not be successful.
Based on certain parameters defined in the Term Loan Facility, including a First Lien Leverage Ratio, we may be required to make an additional principal payment on an annual basis beginning after fiscal year 2018, if our First Lien Leverage Ratio is greater than 2.0.
Our ability to make scheduled payments on or to refinance our debt obligations and to fund planned capital expenditures and expansion efforts depends on our ability to generate cash in the future and our financial condition and operating performance, which are subject to prevailing economic and competitive conditions and to certain regulatory, competitive, financial, business and other factors beyond our control. We cannot assure you that we will maintain a level of cash flows from operating activities sufficient to permit us to pay the principal, premium, if any, and interest on our debt.
If our cash flows and capital resources are insufficient to fund our debt service obligations, we could face substantial liquidity problems and could be forced to reduce or delay investments and capital expenditures or to dispose of material assets or operations,
22
seek additional capital (which could include obtaining additional equity capital on terms that may be onerous or highly dilutive) or restructure or refinance our indebtedness. We may not be able to effect any such alternative measures, if necessary, on commercially reasonable terms or at all and, even if successful, those alternative actions may not allow us to meet our scheduled debt service obligations. The credit agreements governing the Term Loan Facility, the U.S. ABL and the Asia ABL, the indenture governing the Senior Notes will restrict our ability to dispose of assets and use the proceeds from those dispositions and may also restrict our ability to raise debt or equity capital to be used to repay other indebtedness when it becomes due. We may not be able to consummate those dispositions or to obtain proceeds in an amount sufficient to meet any debt service obligations then due.
In addition, we conduct certain of our operations through our subsidiaries. Accordingly, repayment of our indebtedness may be dependent on the generation of cash flow by our subsidiaries and their ability to make such cash available to us, by dividend, debt repayment or otherwise. Unless they are guarantors of the Senior Notes or our other indebtedness, our subsidiaries do not have any obligation to pay amounts due on our indebtedness or to make funds available for that purpose. Our subsidiaries may not be able to, or may not be permitted to, make distributions to enable us to make payments in respect of our indebtedness. Each subsidiary is a distinct legal entity, and under certain circumstances, legal and contractual restrictions may limit our ability to obtain cash from our subsidiaries. While the indenture governing the Senior Notes and the credit agreements governing the Term Loan Facility, the U.S. ABL and the Asia ABL will limit the ability of our subsidiaries to incur consensual restrictions on their ability to pay dividends or make other intercompany payments to us, these limitations are subject to qualifications and exceptions. In the event that we do not receive distributions from our subsidiaries, we may be unable to make required principal and interest payments on our indebtedness.
Our inability to generate sufficient cash flows to satisfy our debt obligations, or to refinance our indebtedness on commercially reasonable terms or at all, would materially and adversely affect our financial position and results of operations and our ability to satisfy our obligations under our indebtedness.
If we cannot make scheduled payments on our debt, we will be in default and holders of the Senior Notes could declare all outstanding principal and interest to be due and payable, the lenders under the Term Loan Facility, the U.S. ABL and the Asia ABL could terminate their commitments to loan money, the lenders could foreclose against the assets securing their borrowings and we could be forced into bankruptcy or liquidation.
Products we manufacture may contain design or manufacturing defects, which could result in reduced demand for our services and liability claims against us.
We manufacture products to our customers’ specifications, which are highly complex and may contain design or manufacturing errors or failures, despite our quality control and quality assurance efforts. Defects in the products we manufacture, whether caused by a design, manufacturing, or materials failure or error, may result in delayed shipments, customer dissatisfaction, a reduction or cancellation of purchase orders, or liability claims against us. If these defects occur either in large quantities or too frequently, our business reputation may be impaired. Since our products are used in products that are integral to our customers’ businesses, errors, defects, or other performance problems could result in financial or other damages to our customers beyond the cost of the PCB, for which we may be liable. Although our invoices and sales arrangements generally contain provisions designed to limit our exposure to product liability and related claims, existing or future laws or unfavorable judicial decisions could negate these limitation of liability provisions. In addition, we manufacture products for a range of automotive customers. If any of our products are or are alleged to be defective, we may be required to participate in a recall of such products. As suppliers become more integral to the vehicle design process and assume more of the vehicle assembly functions, vehicle manufacturers are increasingly looking to their suppliers for contributions when faced with product liability claims or recalls. In addition, vehicle manufacturers, which have traditionally borne the costs associated with warranty programs offered on their vehicles, are increasingly requiring suppliers to guarantee or warrant their products and may seek to hold us responsible for some or all of the costs related to the repair and replacement of parts supplied by us to the vehicle manufacturer.
Our results can be adversely affected by rising labor costs.
There is uncertainty with respect to rising labor costs, particularly within China, where we have most of our manufacturing facilities. In recent periods, there have been regular and significant increases in the minimum wage payable in various provinces of China. In addition, we have experienced very high employee turnover in our manufacturing facilities in China, generally after the Chinese New Year, and we are experiencing ongoing difficulty in recruiting employees for these facilities. Furthermore, labor disputes and strikes based partly on wages have in the past slowed or stopped production by certain manufacturers in China. In some cases, employers have responded by significantly increasing the wages of workers at such plants. Any increase in labor costs due to minimum wage laws or customer requirements about scheduling and overtime that we are unable to recover in our pricing to our customers could materially adversely affect our business, financial condition, and results of operations. In addition, the high turnover rate and our difficulty in recruiting and retaining qualified employees and the other labor trends we are noting in China could result in a potential for defects in our products, production disruptions or delays, or the inability to ramp production to meet increased customer orders, resulting in order cancellation or imposition of customer penalties if we are unable to deliver products in a timely manner.
23
To respond to competitive pressures and customer requirements, we may further expand internationally in lower-cost locations. If we pursue such expansions, we may be required to make additional capital expenditures. In addition, the cost structure in certain countries that are now considered to be favorable may increase as economies develop or as such countries join multinational economic communities or organizations, causing local wages to rise. As a result, we may need to continue to seek new locations with lower costs and the employee and infrastructure base to support PCB manufacturing. We cannot assure investors that we will realize the anticipated strategic benefits of our international operations or that our international operations will contribute positively to our operating results.
In North America, low unemployment rates are making it difficult to recruit and retain employees and we are experiencing wage inflation pressures, some of which are mandated by local and state governments. Further, we are experiencing rising health care costs. While we strive to manage these challenges, there can be no assurance that our efforts will succeed which would result in higher costs and lower profits.
Unanticipated changes in our tax rates or in our assessment of the realizability of our deferred income tax assets or exposure to additional income tax liabilities could affect our business, financial condition, and results of operations.
We are subject to income taxes in the United States and various foreign jurisdictions. Significant judgment is required in determining our provision for income taxes and, in the ordinary course of business, there are many transactions and calculations in which the ultimate tax determination is uncertain. Our effective tax rates could be materially adversely affected by changes in the mix of earnings in countries and states with differing statutory tax rates, changes in the valuation of deferred income tax assets and liabilities, changes in tax laws, as well as other factors. Our tax determinations are regularly subject to audit by tax authorities, and developments in those audits could adversely affect our income tax provision. Although we believe that our tax estimates are reasonable, the final determination of tax audits or tax disputes may be different from what is reflected in our historical income tax provisions, which could materially adversely affect our business, financial condition, and results of operations.
Issues arising during the upgrade of our enterprise resource planning system could affect our operating results and ability to manage our business effectively.
We are continuing the process of upgrading our enterprise resource planning, or ERP, management system to enhance operating efficiencies and provide more effective management of our business operations. We are investing significant financial and personnel resources into this project. However, there is no assurance that the system upgrade will meet our current or future business needs or that it will operate as designed. The transition to the new ERP system will affect numerous systems necessary for our operation. If we fail to correctly implement one or more components of the ERP system, we could experience significant disruption to our operations. Such disruptions could include, among other things, temporary loss of data, inability to process certain orders, failure of systems to communicate with each other and the inability to track or reconcile key data. We are heavily dependent on automated management systems, and any significant failure or delay in the system upgrade could cause a substantial interruption to our business and additional expense, which could result in an adverse impact on our operating results, cash flows or financial condition.
Adverse judgments or settlements resulting from legal proceedings in which we may be involved in the normal course of our business could reduce our profitability or limit our ability to operate our business.
In the normal course of our business, we have been, and may in the future be subject to employee claims based on, among other things, discrimination, minimum wage, overtime pay and other employment related matters. We cannot predict with certainty the cost of defense, the cost of prosecution or the ultimate outcome of these legal proceedings. Any significant adverse determinations, judgments or settlements could reduce our profitability and could materially adversely affect our business, financial condition and results of operations, limit our ability to operate our business or harm our reputation.
Our failure to comply with the requirements of environmental laws could result in litigation, fines, revocation of permits necessary to our manufacturing processes, or debarment from our participation in federal government contracts.
Our operations are regulated under a number of domestic and foreign environmental and safety laws and regulations that govern, among other things, the discharge of hazardous materials into the air and water, as well as the handling, storage, recycling, and disposal of such materials. These laws and regulations include the Clean Air Act, the Clean Water Act, the Resource Conservation and Recovery Act, the Superfund Amendment and Reauthorization Act, the Comprehensive Environmental Response, Compensation and Liability Act, the Toxic Substances Control Act, and the Federal Motor Carrier Safety Improvement Act, as well as analogous state, local, and foreign laws. Compliance with these environmental laws is a major consideration for us because our manufacturing processes use and generate materials classified as hazardous. Because we use hazardous materials and generate hazardous wastes in our manufacturing processes, we may be subject to potential financial liability for costs associated with the investigation and remediation of our own sites, or sites at which we have arranged for the disposal of hazardous wastes, if such sites become contaminated. Even if we fully comply with applicable environmental laws and are not directly at fault for the contamination, we may still be liable. The wastes we generate include spent ammoniacal and cupric etching solutions, metal stripping solutions, waste acid solutions, waste alkaline cleaners, waste oil, and waste waters that contain heavy metals such as copper, tin, lead, nickel, gold, silver, cyanide, and fluoride, and both filter cake and spent ion exchange resins from equipment used for on-site waste treatment.
24
Environmental law violations, including the failure to maintain required environmental permits, could subject us to fines, penalties, and other sanctions, including the revocation of our effluent discharge permits. This could require us to cease or limit production at one or more of our facilities and could have a material adverse effect on our business, financial condition, and results of operations. Even if we ultimately prevail, environmental lawsuits against us would be time consuming and costly to defend.
Environmental laws have generally become more stringent and we expect this trend to continue over time, especially in developing countries, imposing greater compliance costs and increasing risks and penalties associated with violation. We operate in environmentally sensitive locations, and we are subject to potentially conflicting and changing regulatory agendas of political, business, and environmental groups. Changes or restrictions on discharge limits, emissions levels, material storage, handling, or disposal might require a high level of unplanned capital investment or relocation to another global location where prohibitive regulations do not exist. It is possible that environmental compliance costs and penalties from new or existing regulations may materially adversely affect our business, financial condition, and results of operations.
We are increasingly required to certify compliance with various material content restrictions in our products based on laws of various jurisdictions or territories such as the Restriction of Hazardous Substances (RoHS) and Registration, Evaluation, Authorization and Restriction of Chemicals, or REACH directives in the European Union and China’s RoHS legislation. Similar laws have been adopted in other jurisdictions and may become increasingly prevalent. In addition, we must also certify as to the non-applicability of the EU’s Waste Electrical and Electronic Equipment directive for certain products that we manufacture. The REACH directive requires the identification of Substances of Very High Concern, or SVHCs periodically. We must survey our supply chain and certify to the non-presence or presence of SVHCs to our customers. As with other types of product certifications that we routinely provide, we may incur liability and pay damages if our products do not conform to our certifications.
We are also subject to an increasing variety of environmental laws and regulations in China, which impose limitations on the discharge of pollutants into the air and water and establish standards for the treatment, storage, and disposal of solid and hazardous wastes for us and our vendors that assist us in managing the waste generated by our manufacturing processes. The manufacturing of our products generates gaseous chemical wastes, liquid wastes, waste water, and other industrial wastes from various stages of the manufacturing process. Production sites, waste collectors, and vendors in China are subject to increasing regulation and periodic monitoring by the relevant environmental protection authorities. Environmental claims or the failure to comply with current or future regulations could result in the assessment of damages or imposition of fines against us, suspension of production, or cessation of operations.
The process to manufacture PCBs requires adherence to city, county, state, federal, and foreign environmental laws and regulations regarding the storage, use, handling, and disposal of chemicals, solid wastes, and other hazardous materials, as well as compliance with wastewater and air quality standards. We rely on our vendors for the transportation and disposal of our solid and hazardous wastes generated by our manufacturing processes. If we are not able to find such services, our ability to conduct our business and our results of operations may be adversely impacted. In China, the government has a history of changing legal requirements with no or minimal notice. We believe that our facilities in China comply in all material respects with current applicable environmental laws and regulations and has resources in place to maintain compliance to them. The capital expenditure costs expected for environmental improvement initiatives are included in our annual capital expenditure projections.
Employee strikes and other labor-related disruptions may materially adversely affect our business, financial condition, and results of operations.
Our business is labor intensive, utilizing large numbers of engineering and manufacturing personnel. Strikes or labor disputes with our unionized employees, primarily in China, may adversely affect our ability to conduct our business. If we are unable to reach agreement with any of our unionized work groups on future negotiations regarding the terms of their collective bargaining agreements, we may be subject to work interruptions or stoppages. Any of these events could be disruptive to our operations and could result in negative publicity, loss of contracts, and a decrease in revenues. We may also become subject to additional collective bargaining agreements in the future if more employees or segments of our workforce become unionized, including any of our employees in the United States.
We are subject to the requirements of the National Industrial Security Program Operating Manual for our facility security clearance, which is a prerequisite to our ability to perform on classified contracts for the U.S. government.
A facility security clearance is required in order to be awarded and perform on classified contracts for the Department of Defense and certain other agencies of the U.S. government. As a cleared entity, we must comply with the requirements of the National Industrial Security Program Operating Manual (NISPOM), and any other applicable U.S. government industrial security regulations. Further, due to the fact that a portion of our voting equity is owned by a non-U.S. entity, we are required to be governed by and operate in accordance with the terms and requirements of the Special Security Agreement (SSA). The terms of the SSA have been previously disclosed in our SEC filings.
If we were to violate the terms and requirements of the SSA, the NISPOM, or any other applicable U.S. government industrial security regulations (which may apply to us under the terms of classified contracts), we could lose our security clearance. We cannot be certain that we will be able to maintain our security clearance. If for some reason our security clearance is invalidated or
25
terminated, we may not be able to continue to perform on classified contracts and would not be able to enter into new classified contracts, which could materially adversely affect our business, financial condition, and results of operations.
Competition in the PCB market is intense, and we could lose market share if we are unable to maintain our current competitive position in end markets using our quick-turn, high technology, and high-mix manufacturing services.
The PCB industry is intensely competitive, highly fragmented, and rapidly changing. We expect competition to continue, which could result in price reductions, reduced gross margins, and loss of market share. Our principal PCB and substrate competitors include AT&S (Austria Technologie & Systemtechnik Aktiengesellschaft), BoardTek Electronics Corporation, Chin-Poon Industrial Co., Ltd., Compeq Manufacturing Co., Ltd., IBIDEN Co., Ltd., ISU Petasys Co., Ltd., Suzhou Dongshan Precision Manufacturing Co., Ltd., Sanmina Corporation, Tripod Technology Corporation, Unimicron Technology Corporation, and WUS Printed Circuit Co., Ltd. Our principal E-M Solutions competitors include Amphenol Corporation, Flex Ltd., Jabil Inc., and Sanmina Corporation. Our competition for RF products include Cobham plc, Crane Aerospace & Electronics, TRM Microwave, Mercury Systems, Inc., AVX Corporation, Molex, and Smiths Group plc. In addition, we increasingly compete on an international basis, and new and emerging technologies may result in new competitors entering our markets.
Some of our competitors and potential competitors have advantages over us, including:
|
|
• |
greater financial and manufacturing resources that can be devoted to the development, production, and sale of their products; |
|
|
• |
more established and broader sales and marketing channels; |
|
|
• |
more manufacturing facilities worldwide, some of which are closer in proximity to OEMs; |
|
|
• |
manufacturing facilities that are located in countries with lower production costs; |
|
|
• |
lower capacity utilization, which in peak market conditions can result in shorter lead times to customers; |
|
|
• |
ability to add additional capacity faster or more efficiently; |
|
|
• |
preferred vendor status with existing and potential customers; |
|
|
• |
greater name recognition; and |
|
|
• |
larger customer bases. |
In addition, these competitors may respond more quickly to new or emerging technologies or adapt more quickly to changes in customer requirements than we do. We must continually develop improved manufacturing processes to meet our customers’ needs for complex products, and our manufacturing process technology is generally not subject to significant proprietary protection. During recessionary periods in the electronics industry, our strategy of providing quick-turn services, an integrated manufacturing solution, and responsive customer service may take on reduced importance to our customers. As a result, we may need to compete more on the basis of price, which would cause our gross margins to decline.
If we are unable to provide our customers with high-end technology, high-quality products, and responsive service, or if we are unable to deliver our products to our customers in a timely manner, our business, financial condition, and results of operations may be materially adversely affected.
In order to maintain our existing customer base and obtain business from new customers, we must demonstrate our ability to produce our products at the level of technology, quality, responsiveness of service, timeliness of delivery, and cost that our customers require. If our products are of substandard quality, if they are not delivered on time, if we are not responsive to our customers’ demands, or if we cannot meet our customers’ technological requirements, our reputation as a reliable supplier of our products would likely be damaged. If we are unable to meet anticipated product and service standards, we may be unable to obtain new contracts or keep our existing customers, and this would have a material adverse effect on our business, financial condition, and results of operations.
Outages, computer viruses, break-ins, and similar events could disrupt our operations, and breaches of our security systems may cause us to incur significant legal and financial exposure.
We rely on information technology networks and systems, some of which are owned and operated by third parties, to collect, process, transmit, and store electronic information. In particular, we depend on our information technology infrastructure for a variety of functions, including worldwide financial reporting, inventory management, procurement, invoicing, and email communications. Any of these systems may be susceptible to outages due to fire, floods, power loss, telecommunications failures, hacking, terrorist attacks, and similar events. In addition, in the ordinary course of our business, we collect and store sensitive data in our data centers and on our networks, including intellectual property, our proprietary and confidential business information and that of our customers, suppliers and business partners, and personally identifiable information of our employees. The secure collection, processing, storage, maintenance and transmission of this information is critical to our operations. Despite the implementation of network security measures, our systems and those of third parties on which we rely may also be vulnerable to computer viruses, break-ins, cyber-
26
attacks, attacks by hackers or breaches due to employee or third party (including suppliers and business partners) error, malfeasance or other disruptions. If we or our vendors are unable to prevent such outages and breaches, our operations could be disrupted. If unauthorized parties gain access to our information systems or such information is used in an unauthorized manner, misdirected, altered, lost, or stolen during transmission, any theft or misuse of such information could result in, among other things, unfavorable publicity, governmental inquiry and oversight, difficulty in marketing our services, allegations by our customers that we have not performed our contractual obligations, loss of customers, litigation by affected parties, and possible financial obligations for damages related to the theft or misuse of such information, any of which could have a material adverse effect on our business, financial condition, and results of operations.
Damage to our manufacturing facilities due to fire, natural disaster, or other events could materially adversely affect our business, financial condition, and results of operations.
The destruction or closure of any of our facilities for a significant period of time as a result of fire, explosion, blizzard, act of war or terrorism, flood, tornado, earthquake, lightning, other natural disasters, required maintenance, or other events could harm us financially, increasing our costs of doing business and limiting our ability to deliver our manufacturing services on a timely basis.
Our insurance coverage with respect to damages to our facilities or our customers’ products caused by natural disasters is limited and is subject to deductibles and coverage limits. Such coverage may not be adequate or continue to be available at commercially reasonable rates and terms.
In the event one or more of our facilities is closed on a temporary or permanent basis as a result of a natural disaster, required maintenance or other event, our operations could be significantly disrupted. Such events could delay or prevent product manufacturing and shipment for the time required to transfer production or repair, rebuild or replace the affected manufacturing facilities. This time frame could be lengthy and result in significant expenses for repair and related costs. While we have disaster recovery plans in place, there can be no assurance that such plans will be sufficient to allow our operations to continue in the event of every natural or man-made disaster, required repair or other extraordinary event. Any extended inability to continue our operations at unaffected facilities following such an event would reduce our revenue and potentially damage our reputation as a reliable supplier.
We face constant pricing pressure from our customers and competitors, which may decrease our profit margins.
Competition in the PCB market is intense, and we expect that competition will continue to increase, thereby creating a highly aggressive pricing environment. We and some of our competitors have reduced average selling prices in the past. In addition, competitors may reduce their average selling prices faster than our ability to reduce costs, which can also accelerate the rate of decline of our selling prices. When prices decline, we may also be required to write down the value of our inventory.
The effects of such pricing pressures on our business may be exacerbated by inflationary pressures that affect our costs of supply. When we are unable to extract comparable concessions from our suppliers on prices they charge us, this in turn reduces gross profit if we are unable to raise prices. Further, uncertainty or adverse changes in the economy could also lead to a significant decline in demand for our products and pressure to reduce our prices. Recently, many businesses have taken a more conservative stance in ordering inventory. Any decrease in demand for our products, coupled with pressure from the market and our customers to decrease our prices, would materially adversely affect our business, financial condition, and results of operations.
The pricing pressure we face on our products requires us to introduce new and more advanced technology products to maintain average selling prices or reduce any declines in average selling prices. As we shift production to more advanced, higher-density PCBs, we tend to make significant investments in plants and other capital equipment and incur higher costs of production, which may not be recovered.
The prominence of EMS companies as our customers could reduce our gross margins, potential sales, and customers.
Sales to EMS companies represented approximately 36%, 37% and 32% of our net sales for the years ended December 30, 2019, December 31, 2018 and January 1, 2018, respectively. Sales to EMS providers include sales directed by OEMs as well as orders placed with us at the EMS providers’ discretion. EMS providers source on a global basis to a greater extent than OEMs. The growth of EMS providers increases the purchasing power of such providers and has in the past, and could in the future, result in increased price competition or the loss of existing OEM customers. In addition, some EMS providers, including some of our customers, have the ability to directly manufacture PCBs and create backplane assemblies. If a significant number of our other EMS customers were to acquire these abilities, our customer base might shrink, and our sales might decline substantially. Moreover, if any of our OEM customers outsource the production of PCBs and creation of backplane assemblies to these EMS providers, our business, financial condition, and results of operations may be materially adversely affected.
27
If we are unable to manage our growth effectively, our business, financial condition, and results of operations could be materially adversely affected.
We have experienced, and expect to continue to experience, growth in the scope and complexity of our operations. This growth may strain our managerial, financial, manufacturing, and other resources. In order to manage our growth, we may be required to continue to implement additional operating and financial controls and hire and train additional personnel. There can be no assurance that we will be able to do so in the future, and failure to do so could jeopardize our expansion plans and seriously harm our operations. In addition, growth in our capacity could result in reduced capacity utilization and a corresponding decrease in gross margins.
If our net earnings do not remain at or above recent levels, or we are not able to predict with a reasonable degree of probability that they will continue, we may have to record a valuation allowance against our net deferred income tax assets.
Our U.S. entities and certain of our foreign subsidiaries have deferred income tax assets. Based on our forecast for future taxable earnings, we believe we will utilize the deferred income tax assets in future periods except with respect to certain amounts where we have recorded valuation allowances. If our estimates of future earnings decline, we may have to increase our valuation allowance against our net deferred income tax assets, resulting in a higher income tax provision, which would reduce our results of operations.
Our international sales are subject to laws and regulations relating to corrupt practices, trade, and export controls and economic sanctions. Any non-compliance could have a material adverse effect on our business, financial condition, and results of operations.
We operate on a global basis and are subject to anti-corruption, anti-bribery, and anti-kickback laws and regulations, including restrictions imposed by the Foreign Corrupt Practices Act (FCPA). The FCPA and similar anti-corruption, anti-bribery, and anti-kickback laws in other jurisdictions generally prohibit companies and their intermediaries and agents from making improper payments to government officials or any other persons for the purpose of obtaining or retaining business. We operate and sell our products in many parts of the world that have experienced governmental corruption to some degree and, in certain circumstances, strict compliance with anti-corruption, anti-bribery, and anti-kickback laws may conflict with local customs and practices. We also, from time to time, undertake business ventures with state-owned companies or enterprises.
Our global business operations must also comply with all applicable domestic and foreign export control laws, including International Traffic In Arms Regulations (ITAR) and Export Administration Regulations (EAR). Some items we manufacture are controlled for export by the U.S. Department of Commerce’s Bureau of Industry and Security under EAR.
We train our employees concerning anti-corruption, anti-bribery, and anti-kickback laws and compliance with international regulations regarding trades and exports, and we have policies in place that prohibit employees from making improper payments. We cannot provide assurances that our internal controls and procedures will guarantee compliance by our employees or third parties with whom we work. If we are found to be liable for violations of the FCPA or similar anti-corruption, anti-bribery, or anti-kickback laws in international jurisdictions or for violations of ITAR, EAR, or other similar regulations regarding trades and exports, either due to our own acts or out of inadvertence, or due to the inadvertence of others, we could suffer criminal or civil fines or penalties or other repercussions, including reputational harm, which could have a material adverse effect on our business, financial condition, and results of operations.
Our global business operations also must be conducted in compliance with applicable economic sanctions laws and regulations, such as laws administered by the U.S. Department of the Treasury’s Office of Foreign Asset Control, the U.S. State Department, and the U.S. Department of Commerce. We must comply with all applicable economic sanctions laws and regulations of the United States and other countries. Imposition of economic sanction laws and regulations on a company or country could impact our revenue levels. Violations of these laws or regulations could result in significant additional sanctions including criminal or civil fines or penalties, more onerous compliance requirements, more extensive debarments from export privileges, or loss of authorizations needed to conduct aspects of our international business.
In certain countries, we may engage third-party agents or intermediaries, such as customs agents, to act on our behalf, and if these third-party agents or intermediaries violate applicable laws, their actions may result in criminal or civil fines or penalties or other sanctions being assessed against us. We take specific measures designed to ensure our compliance with U.S. export and economic sanctions laws, anti-corruption laws and regulations, and export control laws. However, it is possible that some of our products were sold or will be sold to distributors or other parties, without our knowledge or consent, in violation of applicable law. There can be no assurances that we will be in compliance in the future. Any such violation could result in significant criminal or civil fines, penalties, or other sanctions and repercussions, including reputational harm, which could have a material adverse effect on our business, financial condition, and results of operations.
Employee theft or fraud could result in loss.
Certain of our employees have access to, or signature authority with respect to, bank accounts or other company assets, which could expose us to fraud or theft. In addition, certain employees have access to certain precious metals used in connection with our manufacturing and key information technology infrastructure and to customer and other information that is commercially valuable. Should any employee, for any reason, steal any such precious metals (which has occurred from time to time), compromise our information technology systems, or misappropriate customer or other information, we could incur losses, including losses relating to
28
claims by our customers against us, and the willingness of customers to do business with us may be damaged. Additionally, in the case of our defense business, we could be barred from future participation in government programs. Any such losses may not be fully covered by insurance.
Because we sell on a purchase order basis, we are subject to uncertainties and variability in demand by our customers that could decrease revenues and harm our operating results.
Although we have long-term contracts with many customers, those contracts generally do not contain volume commitments. We generally sell to customers on a purchase order basis. Our quick-turn orders are subject to particularly short lead times. Consequently, our sales are subject to short-term variability in demand by our customers. Customers submitting purchase orders may cancel, reduce, or delay their orders for a variety of reasons, subject to negotiations. The level and timing of orders placed by our customers may vary due to:
|
|
• |
customer attempts to manage inventory; |
|
|
• |
changes in customers’ manufacturing strategies, such as a decision by a customer to either diversify or consolidate the number of PCB manufacturers or backplane assembly service providers used or to manufacture or assemble its own products internally; |
|
|
• |
variation in demand for our customers’ products; and |
|
|
• |
changes in new product introductions. |
We have periodically experienced terminations, reductions, and delays in our customers’ orders. Further terminations, reductions, or delays in our customers’ orders could materially adversely affect our business, financial condition, and results of operations.
Our business has benefited from OEMs deciding to outsource their PCB manufacturing and backplane assembly needs to us. If OEMs choose to provide these services in-house or select other providers, our business could suffer.
Our future revenue growth partially depends on new outsourcing opportunities from OEMs. Current and prospective customers continuously evaluate our performance against other providers. They also evaluate the potential benefits of manufacturing their products themselves. To the extent that outsourcing opportunities are not available either due to OEM decisions to produce these products themselves or to use other providers, our financial results and future growth could be materially adversely affected.
Consolidation among our customers could materially adversely affect our business, financial condition, and results of operations.
Recently, some of our large customers have consolidated, and further consolidation of customers may occur. Depending on which organization becomes the controller of the supply chain function following the consolidation, we may not be retained as a preferred or approved supplier. In addition, product duplication could result in the termination of a product line that we currently support. While there is potential for increasing our position with the combined customer, there does exist the potential for decreased revenue if we are not retained as a continuing supplier. We also face the risk of increased pricing pressure from the combined customer because of its increased market share.
Our operations could be materially adversely affected by a shortage of utilities or a discontinuation of priority supply status offered for such utilities.
The manufacturing of PCBs requires significant quantities of electricity and water. Our operations in Asia have historically purchased substantially all of the electrical power for their manufacturing plants in China from local power plants. Because China’s economy has recently been in a state of growth, the strain on the nation’s power plants is increasing, which has led to continuing power outages in various parts of the country. There may be times when our operations in China may be unable to obtain adequate sources of electricity to meet production requirements. Various regions in China have in the past experienced shortages of both electricity and water and unexpected interruptions of power supply. From time to time, the Chinese government rations electrical power, which can lead to unscheduled production interruptions at our manufacturing facilities.
In addition, certain areas in which our North America operations have manufacturing facilities, particularly in California, have experienced power and resource shortages from time to time, including mandatory periods without electrical power, changes to water availability, and significant increases in utility and resource costs.
29
We do not generally maintain any back-up power generation facilities or reserves of water for our operations, so if we were to lose supplies of power or water at any of our facilities, we would be required to cease operations until such supply was restored. Any resulting cessation of operations could materially adversely affect our ability to meet our customers’ orders in a timely manner, thus potentially resulting in a loss of business, along with increased costs of manufacturing, and under-utilization of capacity. In addition, the sudden cessation of our power or water supply could damage our equipment, resulting in the need for costly repairs or maintenance, as well as damage to products in production, resulting in an increase in scrapped products.
Infringement of our intellectual property rights could negatively affect us, and we may be exposed to intellectual property infringement claims from third parties that could be costly to defend, could divert management’s attention and resources, and if successful, could result in liability.
We rely on a combination of copyright, patent, trademark, and trade secret laws, confidentiality procedures, contractual provisions, and other measures to establish and protect our proprietary and confidential information. All of these measures afford only limited protection. These measures may be invalidated, circumvented, breached, or challenged, and others may develop intellectual property, technologies or processes that are similar, or superior to, our intellectual property or technology. We may not have adequate controls and procedures in place to protect our proprietary and confidential information. Despite our efforts to protect our intellectual property and proprietary rights, unauthorized parties may attempt to copy, and succeed in, copying, our products or may obtain or use information that we regard as proprietary or confidential. If it becomes necessary for us to resort to litigation to protect our intellectual property rights, any proceedings could be burdensome, costly, and distracting to management, and we may not prevail. Further, adequate remedies may not be available in the event of an unauthorized use or disclosure of our proprietary or confidential information. Failure to successfully establish or enforce our intellectual property rights could materially and adversely affect our business, financial condition, and results of operations. Furthermore, there is a risk that we may infringe on the intellectual property rights of others. As is the case with many other companies in the PCB industry, we from time to time receive communications from third parties asserting patent rights over our products and enter into discussions with such third parties. Irrespective of the validity or the successful assertion of such claims, we could incur costs in either defending or settling any intellectual property disputes alleging infringement. If any claims, whether or not they have merit, are brought against our customers for such infringement, we could be required to expend significant resources in defending such claims. In the event we are subject to any infringement claims, we may be required to spend a significant amount of money to develop non-infringing alternatives or obtain licenses. We may not be successful in developing such alternatives or in obtaining such licenses on reasonable terms, or at all, and may be required to modify or cease marketing our products or services, which could disrupt the production processes, damage our reputation, and materially and adversely affect our business, financial condition, and results of operations.
Our business, financial condition, and results of operations could be materially adversely affected by climate change initiatives.
Our manufacturing processes require that we purchase significant quantities of energy from third parties, which results in the generation of greenhouse gases, either directly on-site or indirectly at electric utilities. Both domestic and international legislation to address climate change by reducing greenhouse gas emissions could create increases in energy costs and price volatility. Considerable international attention is now focused on development of an international policy framework to guide international action to address climate change. Proposed and existing legislative efforts to control or limit greenhouse gas emissions could affect our energy sources and supply choices, as well as increase the cost of energy and raw materials that are derived from sources that generate greenhouse gas emissions.
Our ability to use net operating loss carryforwards to offset future taxable income for U.S. federal, state and foreign income tax purposes is subject to limitations, and future transfers of shares of our common stock could cause us to experience an “ownership change” that could further limit our ability to utilize our net operating losses.
Under U.S. federal income tax law, a corporation’s ability to utilize its net operating losses (NOL’s) to offset future taxable income may be significantly limited if it experiences an “ownership change” as defined in Section 382 of the Internal Revenue Code of 1986, as amended (the Code). In general, an ownership change will occur if there is a cumulative change in a corporation’s ownership by “5-percent shareholders” that exceeds 50 percentage points over a rolling three-year period.
A corporation that experiences an ownership change will generally be subject to an annual limitation on its pre-ownership change NOLs equal to the value of the corporation immediately before the ownership change, multiplied by the long-term tax-exempt rate (subject to certain adjustments). The annual limitation for a taxable year is generally increased by the amount of any “recognized built-in gains” for such year and the amount of any unused annual limitation in a prior year. As a result of our acquisition of Viasystems, the NOLs acquired were subject to this limitation. Future transfers or sales of our common stock during a rolling three-year period by any of our “5-percent shareholders” could cause us to experience an ownership change under Section 382, which could further limit our use of NOLs.
30
Foreign laws may not afford us sufficient protections for our intellectual property, and we may not be able to obtain patent protection outside of the United States.
Certain nations that we operate in may not grant us certain intellectual property rights that are customarily granted in more developed legal systems. Patent law reform in the United States and other countries may also weaken our ability to enforce our patent rights or make such enforcement financially unattractive. For example, despite continuing international pressure on the Chinese government, intellectual property rights protection continues to present significant challenges to foreign investors and, increasingly, Chinese companies. Chinese commercial law is relatively undeveloped compared to the commercial law in our other major markets and only limited protection of intellectual property is available in China as a practical matter. Although we have taken precautions in the operations of our Chinese subsidiaries and in our joint venture agreements to protect our intellectual property, any local design or manufacture of products that we undertake in China could subject us to an increased risk that unauthorized parties will be able to copy or otherwise obtain or use our intellectual property, which could harm our business. We may also have limited legal recourse in the event we encounter patent or trademark infringement. Uncertainties with respect to the Chinese legal system may adversely affect the operations of our Chinese subsidiaries. China has put in place a comprehensive system of intellectual property laws however, incidents of infringement are common, and enforcement of rights can, in practice, be difficult. If we are unable to manage our intellectual property rights, our business and operating results may be seriously harmed.
We are subject to risks for the use of certain metals from “conflict minerals” originating in the Democratic Republic of the Congo.
During the third quarter of 2012, the SEC adopted rules implementing the Dodd-Frank Wall Street Reform and Consumer Protection Act (Dodd-Frank). These rules impose diligence and disclosure requirements regarding the use of “conflict minerals” mined from the Democratic Republic of Congo and neighboring countries. While these new rules continue to be the subject of ongoing litigation and, as a result, uncertainty, we submitted a conflict minerals report on Form SD with the SEC for the past five years, most recently on May 24, 2019. Compliance with these rules results in additional costs and expenses, including costs and expenses incurred for due diligence to determine and verify the sources of any conflict minerals used in our products, in addition to the costs and expenses of remediation and other changes to products, processes, or sources of supply as a consequence of such verification efforts. These rules may also affect the sourcing and availability of minerals used in the manufacture of our PCBs, as there may be only a limited number of suppliers offering “conflict free” minerals that can be used in our products. There can be no assurance that we will be able to obtain such minerals in sufficient quantities or at competitive prices. Also, since our supply chain is complex, we may, at a minimum, face reputational challenges with our customers, stockholders, and other stakeholders if we are unable to sufficiently verify the origins of the minerals used in our products. We may also encounter customers who require that all of the components of our products be certified as conflict free. If we are not able to meet customer requirements, such customers may choose to disqualify us as a supplier, which could impact our sales and the value of portions of our inventory.
|
ITEM 1B. |
UNRESOLVED STAFF COMMENTS |
None.
31
|
ITEM 2. |
PROPERTIES |
The following table describes our headquarters, our principal manufacturing facilities and our drilling and tooling process facility.
|
U.S. Locations |
|
Operating Segment |
|
Leased Square Feet |
|
|
Owned Square Feet |
|
|
Total Square Feet |
|
|||
|
Anaheim, CA (ANA) |
|
PCB |
|
|
— |
|
|
|
96,000 |
|
|
|
96,000 |
|
|
Chippewa Falls, WI (CF) |
|
PCB |
|
|
4,980 |
|
|
|
281,000 |
|
|
|
285,980 |
|
|
Forest Grove, OR (FG) |
|
PCB |
|
|
12,774 |
|
|
|
218,300 |
|
|
|
231,074 |
|
|
Littleton, CO (DEN) (2) |
|
PCB |
|
|
54,590 |
|
|
|
53,502 |
|
|
|
108,092 |
|
|
Logan, UT (LG) |
|
PCB |
|
|
12,000 |
|
|
|
129,300 |
|
|
|
141,300 |
|
|
North Jackson, OH (NJ) |
|
PCB |
|
|
2,970 |
|
|
|
66,276 |
|
|
|
69,246 |
|
|
San Diego, CA (SD) |
|
PCB |
|
|
43,336 |
|
|
|
— |
|
|
|
43,336 |
|
|
San Jose, CA (SJ) |
|
PCB |
|
|
42,434 |
|
|
|
— |
|
|
|
42,434 |
|
|
Santa Ana, CA (1) |
|
Headquarters |
|
|
14,472 |
|
|
|
— |
|
|
|
14,472 |
|
|
Santa Ana, CA (SA) |
|
PCB |
|
|
9,416 |
|
|
|
82,550 |
|
|
|
91,966 |
|
|
Santa Clara, CA (SC) |
|
PCB |
|
|
18,536 |
|
|
|
49,115 |
|
|
|
67,651 |
|
|
Salem, NH (SAL) |
|
PCB |
|
|
43,700 |
|
|
|
— |
|
|
|
43,700 |
|
|
Stafford, CT (ST) |
|
PCB |
|
|
— |
|
|
|
126,924 |
|
|
|
126,924 |
|
|
Stafford Springs, CT (SS) |
|
PCB |
|
|
30,251 |
|
|
|
85,328 |
|
|
|
115,579 |
|
|
Sterling, VA (STE) |
|
PCB |
|
|
100,896 |
|
|
|
— |
|
|
|
100,896 |
|
|
Syracuse, NY (SYR) |
|
PCB |
|
|
37,639 |
|
|
|
156,000 |
|
|
|
193,639 |
|
|
Total |
|
|
|
|
427,994 |
|
|
|
1,344,295 |
|
|
|
1,772,289 |
|
|
Foreign Locations |
|
Operating Segment |
|
Leased Square Feet |
|
|
Owned Square Feet |
|
|
Total Square Feet |
|
|||
|
Canada |
|
|
|
|
|
|
|
|
|
|
|
|
|
|
|
Toronto (TOR) |
|
PCB |
|
|
15,500 |
|
|
|
99,960 |
|
|
|
115,460 |
|
|
China |
|
|
|
|
|
|
|
|
|
|
|
|
|
|
|
Dongguan (DMC) |
|
PCB |
|
|
— |
|
|
|
1,069,129 |
|
|
|
1,069,129 |
|
|
Guangzhou (GME) (4) |
|
PCB |
|
|
— |
|
|
|
1,468,372 |
|
|
|
1,468,372 |
|
|
Guangzhou (GZ) |
|
PCB |
|
|
— |
|
|
|
2,237,318 |
|
|
|
2,237,318 |
|
|
Hong Kong (1) |
|
Asia Headquarters |
|
|
— |
|
|
|
24,640 |
|
|
|
24,640 |
|
|
Hong Kong (OPCM) |
|
PCB |
|
|
— |
|
|
|
128,432 |
|
|
|
128,432 |
|
|
Huiyang (HY) |
|
PCB |
|
|
— |
|
|
|
503,935 |
|
|
|
503,935 |
|
|
Shanghai (SH) |
|
E-M Solutions |
|
|
85,745 |
|
|
|
— |
|
|
|
85,745 |
|
|
Shanghai (SH E-MS) |
|
E-M Solutions |
|
|
— |
|
|
|
402,200 |
|
|
|
402,200 |
|
|
Shanghai (SME) (4) |
|
PCB |
|
|
— |
|
|
|
316,750 |
|
|
|
316,750 |
|
|
Shanghai (SMST/SP) (4) |
|
PCB |
|
|
— |
|
|
|
760,502 |
|
|
|
760,502 |
|
|
Shanghai (SKE) (3) (4) |
|
PCB |
|
|
— |
|
|
|
110,971 |
|
|
|
110,971 |
|
|
Shenzhen (SZ) |
|
E-M Solutions |
|
|
430,000 |
|
|
|
— |
|
|
|
430,000 |
|
|
Suzhou (SUZ) |
|
PCB |
|
|
68,030 |
|
|
|
— |
|
|
|
68,030 |
|
|
Zhongshan (ZS) |
|
PCB |
|
|
— |
|
|
|
1,198,368 |
|
|
|
1,198,368 |
|
|
Total |
|
|
|
|
599,275 |
|
|
|
8,320,577 |
|
|
|
8,919,852 |
|
We maintain our properties in good operating condition. We believe that our properties are suitable and adequate for us to operate at present levels, and the productive capacity and extent of utilization of the facilities are appropriate for our existing manufacturing requirements.
|
(1) |
Location of our headquarters and not a manufacturing facility |
|
(2) |
Location includes two manufacturing facilities |
|
(3) |
Drilling and tooling process facility |
|
(4) |
On January 19, 2020, we entered into a definitive equity interests purchase agreement for the sale of these facilities – see Note 22 of the Notes to the Consolidated Financial Statements for further details. |
32
|
ITEM 3. |
LEGAL PROCEEDINGS |
From time to time, we may become a party to various legal proceedings arising in the ordinary course of our business. There can be no assurance that we will prevail in any such litigation. We believe that the amount of any reasonably possible loss for known matters would not be material to our financial statements; however, the outcome of these actions is inherently difficult to predict. In the event of an adverse outcome, the ultimate potential loss could have a material adverse effect on our financial condition, results of operations, or cash flows in a particular period.
|
ITEM 4. |
MINE SAFETY DISCLOSURES |
Not applicable.
33
PART II
|
ITEM 5. |
MARKET FOR REGISTRANT’S COMMON EQUITY, RELATED STOCKHOLDER MATTERS AND ISSUER PURCHASES OF EQUITY SECURITIES |
Market Information
Our common stock has been listed on the Nasdaq Global Select Market under the symbol “TTMI” since September 21, 2000.
As of February 19, 2020, there were approximately 281 holders of record of our common stock. The closing sale price of our common stock on the Nasdaq Global Select Market on February 19, 2020 was $13.64.
STOCK PRICE PERFORMANCE GRAPH
The performance graph below compares, for the period from December 29, 2014 to December 30, 2019, the cumulative total stockholder return on our common stock against the cumulative total return of:
|
|
• |
the NASDAQ Composite Index; and |
|
|
• |
the Dow Jones U.S. Electrical Components & Equipment Index. |
The graph assumes $100 was invested in our common stock on December 29, 2014, and an investment in NASDAQ Composite Index and the Dow Jones US Electrical Components & Equipment Index. The stock performance shown on the graph below represents historical stock performance and is not necessarily indicative of future stock performance.
COMPARISON OF 5 YEAR CUMULATIVE TOTAL RETURN*
Among TTM Technologies, Inc., the NASDAQ Composite Index
and the Dow Jones US Electrical Components & Equipment Index
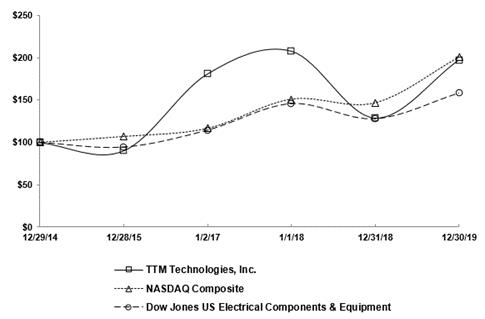
|
|
* |
$100 invested on December 29, 2014 in stock or index, including reinvestment of dividends. |
|
|
12/29/2014 |
|
|
12/28/2015 |
|
|
1/2/2017 |
|
|
1/1/2018 |
|
|
12/31/2018 |
|
|
12/30/2019 |
|
||||||
|
TTM Technologies, Inc. |
|
100.00 |
|
|
|
90.20 |
|
|
|
180.53 |
|
|
|
207.55 |
|
|
|
128.87 |
|
|
|
197.09 |
|
|
NASDAQ Composite |
|
100.00 |
|
|
|
106.96 |
|
|
|
116.45 |
|
|
|
150.96 |
|
|
|
146.67 |
|
|
|
200.49 |
|
|
Dow Jones US Electrical Components & Equipment |
|
100.00 |
|
|
|
94.44 |
|
|
|
114.27 |
|
|
|
145.64 |
|
|
|
127.77 |
|
|
|
158.04 |
|
The performance graph above shall not be deemed “filed” for purposes of Section 18 of the Exchange Act, or otherwise subject to the liability of that section. The performance graph above will not be deemed incorporated by reference into any filing of our company under the Securities Act of 1933, as amended, or the Exchange Act.
34
|
ITEM 6. |
SELECTED FINANCIAL DATA |
The selected historical financial data presented below are derived from our consolidated financial statements. The selected financial data should be read in conjunction with “Item 7. Management’s Discussion and Analysis of Financial Condition and Results of Operations” and our consolidated financial statements and the notes thereto included elsewhere in this report.
|
|
|
For the Year Ended |
|
|||||||||||||||||
|
|
|
December 30, 2019 |
|
|
December 31, 2018 (2) |
|
|
January 1, 2018 |
|
|
January 2, 2017 |
|
|
December 28, 2015 (3) |
|
|||||
|
|
|
(In thousands, except per share data) |
|
|||||||||||||||||
|
Consolidated Statements of Operations Data (1): |
|
|
|
|
|
|
|
|
|
|
|
|
|
|
|
|
|
|
|
|
|
Net sales |
|
$ |
2,689,308 |
|
|
$ |
2,847,261 |
|
|
$ |
2,658,592 |
|
|
$ |
2,533,359 |
|
|
$ |
2,095,488 |
|
|
Cost of goods sold |
|
|
2,287,625 |
|
|
|
2,390,227 |
|
|
|
2,229,011 |
|
|
|
2,109,744 |
|
|
|
1,785,351 |
|
|
Gross profit |
|
|
401,683 |
|
|
|
457,034 |
|
|
|
429,581 |
|
|
|
423,615 |
|
|
|
310,137 |
|
|
Operating expenses: |
|
|
|
|
|
|
|
|
|
|
|
|
|
|
|
|
|
|
|
|
|
Selling and marketing |
|
|
74,011 |
|
|
|
73,313 |
|
|
|
65,856 |
|
|
|
66,366 |
|
|
|
57,361 |
|
|
General and administrative |
|
|
152,096 |
|
|
|
159,437 |
|
|
|
126,141 |
|
|
|
147,247 |
|
|
|
167,669 |
|
|
Amortization of definite-lived intangibles |
|
|
48,474 |
|
|
|
59,681 |
|
|
|
23,634 |
|
|
|
24,252 |
|
|
|
18,888 |
|
|
Restructuring charges |
|
|
6,981 |
|
|
|
5,518 |
|
|
|
1,190 |
|
|
|
8,951 |
|
|
|
7,381 |
|
|
Impairment of long-lived assets |
|
|
— |
|
|
|
— |
|
|
|
— |
|
|
|
3,346 |
|
|
|
— |
|
|
Gain on sale of assets |
|
|
— |
|
|
|
— |
|
|
|
— |
|
|
|
— |
|
|
|
(2,504 |
) |
|
Total operating expenses |
|
|
281,562 |
|
|
|
297,949 |
|
|
|
216,821 |
|
|
|
250,162 |
|
|
|
248,795 |
|
|
Operating income |
|
|
120,121 |
|
|
|
159,085 |
|
|
|
212,760 |
|
|
|
173,453 |
|
|
|
61,342 |
|
|
Other income (expense): |
|
|
|
|
|
|
|
|
|
|
|
|
|
|
|
|
|
|
|
|
|
Interest expense |
|
|
(83,234 |
) |
|
|
(78,958 |
) |
|
|
(53,898 |
) |
|
|
(76,008 |
) |
|
|
(59,753 |
) |
|
Loss on extinguishment of debt |
|
|
— |
|
|
|
— |
|
|
|
(768 |
) |
|
|
(47,767 |
) |
|
|
(802 |
) |
|
Other, net |
|
|
9,297 |
|
|
|
9,641 |
|
|
|
(18,136 |
) |
|
|
17,324 |
|
|
|
8,189 |
|
|
Total other expense, net |
|
|
(73,937 |
) |
|
|
(69,317 |
) |
|
|
(72,802 |
) |
|
|
(106,451 |
) |
|
|
(52,366 |
) |
|
Income before income taxes |
|
|
46,184 |
|
|
|
89,768 |
|
|
|
139,958 |
|
|
|
67,002 |
|
|
|
8,976 |
|
|
Income tax (provision) benefit |
|
|
(4,883 |
) |
|
|
83,816 |
|
|
|
(15,231 |
) |
|
|
(31,427 |
) |
|
|
(34,594 |
) |
|
Net income (loss) |
|
|
41,301 |
|
|
|
173,584 |
|
|
|
124,727 |
|
|
|
35,575 |
|
|
|
(25,618 |
) |
|
Less: Net income attributable to the non-controlling interest |
|
— |
|
|
— |
|
|
|
(513 |
) |
|
|
(714 |
) |
|
|
(264 |
) |
||
|
Net income (loss) attributable to TTM Technologies, Inc. stockholders |
|
$ |
41,301 |
|
|
$ |
173,584 |
|
|
$ |
124,214 |
|
|
$ |
34,861 |
|
|
$ |
(25,882 |
) |
|
Earnings (loss) per common share attributable to TTM Technologies, Inc. stockholders: |
|
|
|
|
|
|
|
|
|
|
|
|
|
|
|
|
|
|
|
|
|
Basic |
|
$ |
0.39 |
|
|
$ |
1.68 |
|
|
$ |
1.22 |
|
|
$ |
0.35 |
|
|
$ |
(0.28 |
) |
|
Diluted |
|
$ |
0.39 |
|
|
$ |
1.38 |
|
|
$ |
1.04 |
|
|
$ |
0.34 |
|
|
$ |
(0.28 |
) |
|
Weighted average common shares: |
|
|
|
|
|
|
|
|
|
|
|
|
|
|
|
|
|
|
|
|
|
Basic |
|
|
105,195 |
|
|
|
103,355 |
|
|
101,580 |
|
|
100,099 |
|
|
|
92,675 |
|
||
|
Diluted |
|
|
106,332 |
|
|
|
134,036 |
|
|
132,476 |
|
|
101,482 |
|
|
|
92,675 |
|
||
|
Other Financial Data: |
|
|
|
|
|
|
|
|
|
|
|
|
|
|
|
|
|
|
|
|
|
Depreciation of property, plant and equipment |
|
$ |
166,574 |
|
|
$ |
162,708 |
|
|
$ |
150,809 |
|
|
$ |
156,229 |
|
|
$ |
133,508 |
|
|
(1) |
We operate on a 52 or 53 week year ending on the Monday nearest December 31. Fiscal year 2019, 2018, 2017 and 2015 were 52 weeks ended December 30, 2019, December 31, 2018, January 1, 2018, and December 28, 2015, respectively. Fiscal year 2016 consisted of 53 weeks ended on January 2, 2017 with the additional week included in the fourth quarter. We estimate the additional week contributed approximately $29.2 million of additional revenue and approximately $1.1 million of additional operating income for the year ended January 2, 2017. |
|
(2) |
Our results for the year ended December 31, 2018 include activity of Anaren, which we acquired on April 28, 2018. Additionally, our results include $13.3 million of bank fees and legal, accounting, and other professional service costs primarily associated with the acquisition of Anaren. |
|
(3) |
Our results for the year ended December 28, 2015 include activity of Viasystems, which we acquired on May 31, 2015. Additionally, our results include $34.4 million of bank fees and legal, accounting, and other professional service costs associated with the acquisition of Viasystems. |
35
|
|
|
As of |
|
|||||||||||||||||
|
|
|
December 30, 2019 (1) |
|
|
December 31, 2018 (1) |
|
|
January 1, 2018 (1) |
|
|
January 2, 2017 (1) |
|
|
December 28, 2015 (1) |
|
|||||
|
|
|
(In thousands) |
|
|||||||||||||||||
|
Consolidated Balance Sheet Data: |
|
|
|
|
|
|
|
|
|
|
|
|
|
|
|
|
|
|
|
|
|
Working capital |
|
$ |
396,018 |
|
|
$ |
533,700 |
|
|
$ |
500,951 |
|
|
$ |
323,776 |
|
|
$ |
277,526 |
|
|
Total assets |
|
|
3,560,933 |
|
|
|
3,457,503 |
|
|
|
2,781,882 |
|
|
|
2,500,076 |
|
|
|
2,640,133 |
|
|
Long-term debt, including current maturities |
|
|
1,475,937 |
|
|
|
1,492,425 |
|
|
|
980,057 |
|
|
|
1,019,682 |
|
|
|
1,170,786 |
|
|
TTM Technologies, Inc. stockholders’ equity |
|
|
1,279,037 |
|
|
|
1,227,087 |
|
|
|
1,011,380 |
|
|
|
820,847 |
|
|
|
819,105 |
|
|
|
|
For the Year Ended |
|
|||||||||||||||||
|
|
|
December 30, 2019 |
|
|
December 31, 2018 |
|
|
January 1, 2018 |
|
|
January 2, 2017 |
|
|
December 28, 2015 |
|
|||||
|
|
|
(In thousands) |
|
|||||||||||||||||
|
Supplemental Data: |
|
|
|
|
|
|
|
|
|
|
|
|
|
|
|
|
|
|
|
|
|
Adjusted EBITDA (2) |
|
$ |
376,244 |
|
|
$ |
438,838 |
|
|
$ |
388,566 |
|
|
$ |
395,445 |
|
|
$ |
285,673 |
|
|
Net cash provided by operating activities |
|
|
311,937 |
|
|
|
273,138 |
|
|
|
332,755 |
|
|
|
298,336 |
|
|
|
237,462 |
|
|
Net cash used in investing activities |
|
|
(135,972 |
) |
|
|
(746,192 |
) |
|
|
(124,090 |
) |
|
|
(77,968 |
) |
|
|
(247,660 |
) |
|
Net cash (used in) provided by financing activities |
|
|
(31,813 |
) |
|
|
321,056 |
|
|
|
(58,976 |
) |
|
|
(217,109 |
) |
|
|
(5,756 |
) |
|
(1) |
Reflects adoption of Financial Accounting Update 2015-03, Imputation of Interest, which requires that debt issuance costs related to debt be reported as a direct reduction from the face amount of the debt. Accordingly, as of December 30, 2019, December 31, 2018, January 1, 2018 and January 2, 2017, approximately $13.0 million, $16.3 million, $12.5 million and $4.7 million, respectively, of unamortized debt issuance costs were presented as a reduction of long-term debt on our balance sheet. Furthermore, we reclassified approximately $31.2 million of unamortized debt issuance costs that had been presented as other non-current assets as of December 28, 2015 as a reduction of long-term debt. |
|
(2) |
“EBITDA” means earnings before interest expense, income taxes, depreciation and amortization. Adjusted EBITDA means earnings before interest expense, income taxes, depreciation, amortization, stock-based compensation, gain on sale of assets, inventory markup, acquisition-related costs, loss on extinguishment of debt, and impairments, restructuring and other charges. This is a non-GAAP financial measurement used by us to enhance the understanding of our operating results. Adjusted EBITDA is a key measure we use to evaluate our operations. We provide our adjusted EBITDA because we believe that investors and securities analysts will find adjusted EBITDA to be a useful measure for evaluating our operating performance and comparing our operating performance with that of similar companies that have different capital structures and for evaluating our ability to meet our future debt service, capital expenditures, and working capital requirements. However, adjusted EBITDA should not be considered as an alternative to cash flows from operating activities as a measure of liquidity or as an alternative to net income as a measure of operating results in accordance with accounting principles generally accepted in the United States. The following provides a reconciliation of adjusted EBITDA to the financial information in our consolidated statements of operations. |
|
|
|
For the Year Ended |
|
|||||||||||||||||
|
|
|
December 30, 2019 |
|
|
December 31, 2018 |
|
|
January 1, 2018 |
|
|
January 2, 2017 |
|
|
December 28, 2015 |
|
|||||
|
|
|
(In thousands) |
|
|||||||||||||||||
|
Net income (loss) |
|
$ |
41,301 |
|
|
$ |
173,584 |
|
|
$ |
124,727 |
|
|
$ |
35,575 |
|
|
$ |
(25,618 |
) |
|
Add back items: |
|
|
|
|
|
|
|
|
|
|
|
|
|
|
|
|
|
|
|
|
|
Income tax provision (benefit) |
|
|
4,883 |
|
|
|
(83,816 |
) |
|
|
15,231 |
|
|
|
31,427 |
|
|
|
34,594 |
|
|
Interest expense |
|
|
83,234 |
|
|
|
78,958 |
|
|
|
53,898 |
|
|
|
76,008 |
|
|
|
59,753 |
|
|
Depreciation of property, plant and equipment |
|
|
166,574 |
|
|
|
162,708 |
|
|
|
150,809 |
|
|
|
156,229 |
|
|
|
133,508 |
|
|
Amortization of definite-lived intangible assets |
|
|
53,296 |
|
|
|
63,026 |
|
|
|
23,634 |
|
|
|
24,252 |
|
|
|
18,888 |
|
|
EBITDA |
|
|
349,288 |
|
|
|
394,460 |
|
|
|
368,299 |
|
|
|
323,491 |
|
|
|
221,125 |
|
|
Stock-based compensation |
|
|
16,816 |
|
|
|
20,681 |
|
|
|
18,290 |
|
|
|
11,090 |
|
|
|
9,661 |
|
|
Gain on sale of assets |
|
|
(3,743 |
) |
|
|
— |
|
|
|
(2,348 |
) |
|
|
(1,472 |
) |
|
|
(2,504 |
) |
|
Inventory markup |
|
|
— |
|
|
|
4,900 |
|
|
|
— |
|
|
|
— |
|
|
|
— |
|
|
Acquisition-related costs |
|
|
6,902 |
|
|
|
13,279 |
|
|
|
2,266 |
|
|
|
1,688 |
|
|
|
34,448 |
|
|
Loss on extinguishment of debt |
|
|
— |
|
|
|
— |
|
|
|
768 |
|
|
|
47,767 |
|
|
|
802 |
|
|
Impairments, restructuring, and other charges |
|
|
6,981 |
|
|
|
5,518 |
|
|
|
1,291 |
|
|
|
12,881 |
|
|
|
22,141 |
|
|
Adjusted EBITDA |
|
$ |
376,244 |
|
|
$ |
438,838 |
|
|
$ |
388,566 |
|
|
$ |
395,445 |
|
|
$ |
285,673 |
|
|
ITEM 7. |
MANAGEMENT’S DISCUSSION AND ANALYSIS OF FINANCIAL CONDITION AND RESULTS OF OPERATIONS |
This financial review presents our operating results for each of our three most recent fiscal years and our financial condition as of December 30, 2019. Except for historical information contained herein, the following discussion contains forward-looking statements which are subject to known and unknown risks, uncertainties and other factors that may cause our actual results to differ materially from those expressed or implied by such forward-looking statements. We discuss such risks, uncertainties and other factors throughout this report and specifically under Item 1A of Part I of this report, Risk Factors. In addition, the following discussion should be read in connection with the information presented in our consolidated financial statements and the related notes to our consolidated financial statements.
36
COMPANY OVERVIEW
We are a leading global printed circuit board (PCB) manufacturer, focusing on quick-turn and volume production of technologically complex PCBs, backplane assemblies and electro-mechanical solutions (E-M Solutions), as well as a global designer and manufacturer of radio-frequency (RF) and microwave components and assemblies. We focus on providing time-to-market and volume production of advanced technology products and offer a one-stop design, engineering and manufacturing solution to our customers. This one-stop design, engineering and manufacturing solution allows us to align technology development with the diverse needs of our customers and to enable them to reduce the time required to develop new products and bring them to market. We serve a diversified customer base consisting of approximately 1,900 customers in various markets throughout the world, including aerospace and defense, automotive components, smartphones and other mobile devices, high-end computing, medical, industrial and instrumentation related products, as well as networking/communications infrastructure products. Our customers include both original equipment manufacturers (OEMs) and electronic manufacturing services (EMS) providers.
RECENT DEVELOPMENTS
In December 2019, a strain of coronavirus surfaced in China. As a result, there have been numerous factory closures. While many factories were closed for a few days because of the Chinese New Year holiday, the Chinese government ordered that businesses in various areas extend the Chinese New Year holiday due to the coronavirus outbreak. Moreover, because of the current restrictions on travel in China, our employees have been affected and we experienced labor shortages and may continue to experience those shortages for some time. Also, it is possible that the Chinese government will announce new closures in the future. Some of our suppliers and customers in China have similarly been affected and experienced closures and risks of labor shortages. If our suppliers experience additional closures in the future, we may have difficulty sourcing materials necessary to fulfill production requirements and meet scheduled shipments, which will negatively affect our revenues. Even if we are able to find alternate sources for such materials, they may cost more, which will affect our profitability. If our customers in China experience additional closures in the future and are not able to accept orders or if they delay or cancel such orders, our revenues will be negatively affected. At this point in time, there is significant uncertainty relating to the potential effect of the coronavirus on our business. Infections may become more widespread and there might be additional factory closures in the future, all of which will have a negative impact on our business, financial condition and operating results. As a result of this disruption, our financial results for the first quarter of 2020 will be negatively affected.
On January 19, 2020, we entered into a definitive equity interests purchase agreement for the sale of the following subsidiaries of our Mobility business unit: Shanghai Kaiser Electronics Co., Ltd. (SKE), Shanghai Meadville Electronics Co., Ltd. (SME), Shanghai Meadville Science & Technology Co., Ltd. (SP) and Guangzhou Meadville Electronics Co., Ltd. (GME) for a base purchase price of $550.0 million in cash, subject to customary purchase price adjustments. The purchase agreement excludes from the sale certain accounts receivable related to the business, which we expect, based on the terms of the purchase agreement will result in an estimated $110.0 million in cash to us.
FINANCIAL OVERVIEW
For the fiscal year 2019, we experienced lower demand in our commercial (non-Aerospace and Defense related) end markets, partially offset by higher demand in our Aerospace and Defense end market.
While our customers include both OEMs and EMS providers, we measure customers based on OEM companies as they are the ultimate end customers. Sales to our five largest customers accounted for 33%, 32% and 37% of our net sales in fiscal years 2019, 2018 and 2017, respectively. We sell to OEMs both directly and indirectly through EMS providers.
The following table shows the percentage of our net sales attributable to each of the principal end markets we served for the periods indicated:
|
|
|
For the Year Ended |
|
|
|||||||||||
|
End Markets (1) |
|
December 30, 2019 |
|
|
|
December 31, 2018 (3) |
|
|
|
January 1, 2018 |
|
|
|||
|
Aerospace and Defense |
|
|
26 |
|
% |
|
|
21 |
|
% |
|
|
16 |
|
% |
|
Automotive |
|
|
16 |
|
|
|
|
18 |
|
|
|
|
19 |
|
|
|
Cellular Phone (2) |
|
|
13 |
|
|
|
|
14 |
|
|
|
|
18 |
|
|
|
Computing/Storage/Peripherals (2) |
|
|
13 |
|
|
|
|
14 |
|
|
|
|
13 |
|
|
|
Medical/Industrial/Instrumentation |
|
|
14 |
|
|
|
|
14 |
|
|
|
|
14 |
|
|
|
Networking/Communications |
|
|
15 |
|
|
|
|
17 |
|
|
|
|
18 |
|
|
|
Other (2) |
|
|
3 |
|
|
|
|
2 |
|
|
|
|
2 |
|
|
|
Total |
|
|
100 |
|
% |
|
|
100 |
|
% |
|
|
100 |
|
% |
|
(1) |
Sales to EMS companies are classified by the end markets of their OEM customers. |
|
(2) |
Smartphones are included in the Cellular Phone end market, tablets are included in the Computing/Storage/Peripherals end market and other consumer devices that include wearables, portable video devices and personal headphones are included in the Other end market. |
|
(3) |
Amended for Anaren integration and amounts include activity of Anaren since the acquisition which occurred on April 18, 2018. |
37
We derive revenues primarily from the sale of PCBs, custom electronic assemblies using customer-supplied engineering and design plans as well as our long-term contracts related to the design and manufacture of RF and microwave components, assemblies and subsystems. Orders for products generally correspond to the production schedules of our customers and are supported with firm purchase orders. Our customers have continuous control of the work in progress and finished goods throughout the PCB and custom electronic assemblies manufacturing process, as these are built to customer specifications with no alternative use, and there is an enforceable right of payment for work performed to date. As a result, beginning in the first quarter of 2018, we began recognizing revenue progressively over time based on the extent of progress towards completion of the performance obligation. We recognize revenue based on the cost-to-cost method as it best depicts the transfer of control to the customer which takes place as we incur costs. Under the cost-to-cost measure of progress, the extent of progress toward completion is measured based on the ratio of costs incurred to date to the total estimated costs at completion of the performance obligation. Revenues are recorded proportionally as costs are incurred.
We also manufacture certain components, assemblies, and subsystems which service our wireless communications customers. We recognize revenue at a point in time upon transfer of control of the products to our customer. Point in time recognition was determined as our customers do not simultaneously receive or consume the benefits provided by our performance and the asset being manufactured has alternative uses to us.
Net sales consist of gross sales less an allowance for returns, which typically have been approximately 2% of gross sales. We provide our customers a limited right of return for defective PCBs including components, subsystems and assemblies. We record an estimate for sales returns and allowances at the time of sale based on historical results and anticipated returns.
Cost of goods sold consists of materials, labor, outside services, and overhead expenses incurred in the manufacture and testing of our products. Shipping and handling fees and related freight costs and supplies associated with shipping products are also included as a component of cost of goods sold. Many factors affect our gross margin, including capacity utilization, product mix, production volume, and yield. While we have entered into supply assurance agreements with some of our key suppliers to maintain the continuity of supply of some of the key materials we use, we generally do not participate in any significant long-term contracts with suppliers, and we believe there are a number of potential suppliers for most of the raw materials we use.
Selling and marketing expenses consist primarily of salaries, labor related benefits, and commissions paid to our internal sales force, independent sales representatives, and our sales support staff, as well as costs associated with marketing materials and trade shows.
General and administrative costs primarily include the salaries for executive, finance, accounting, information technology, facilities, research and development, and human resources personnel, as well as expenses for accounting and legal assistance, incentive compensation expense, and gains or losses on the sale or disposal of property, plant and equipment.
CRITICAL ACCOUNTING POLICIES AND ESTIMATES
Our consolidated financial statements included in this report have been prepared in accordance with accounting principles generally accepted in the United States of America. The preparation of these financial statements requires us to make estimates and assumptions that affect the reported amounts of assets, liabilities, net sales and expenses, and related disclosure of contingent assets and liabilities.
A critical accounting policy is defined as one that is both material to the presentation of our consolidated financial statements and requires us to make judgments that could have a material effect on our financial condition or results of operations. These policies require us to make assumptions about matters that are highly uncertain at the time of the estimate. Different estimates we could reasonably have used, or changes in the estimates that are reasonably likely to occur, could have a material effect on our financial condition or results of operations.
We base our estimates on historical experience and on various other assumptions that are believed to be reasonable under the circumstances, the results of which form the basis for making judgments about the carrying values of assets and liabilities that are not readily apparent from other sources. Management has discussed the development, selection and disclosure of these estimates with the audit committee of our board of directors. Actual results may differ from these estimates under different assumptions or conditions.
Our critical accounting policies include impairment of goodwill and intangible assets and realizability of deferred tax assets.
Goodwill and Intangible Assets
We have significant goodwill and definite-lived intangibles. We review these assets for impairment whenever events or changes in circumstances indicate that the carrying amount of such assets may not be recoverable. In addition, we perform an impairment test related to goodwill at least annually. As necessary, we make judgments regarding future cash flow forecasts in the assessment of impairment.
We have two reportable segments consisting of PCB and E-M Solutions. Goodwill is only attributable to our PCB reportable segment. Goodwill is allocated to our reporting units, which are our operating segments or one level below our operating segments (the component level). Reporting units are determined by the discrete financial information available for the component and whether it
38
is regularly reviewed by segment management. Components are aggregated into a single reporting unit if they share similar economic characteristics. Our PCB reportable segment is made up of five reporting units. The Company evaluates its goodwill on an annual basis in the fourth quarter or more frequently if it believes indicators of impairment exist. We assess qualitative factors to determine whether it is more likely than not that the fair value of a reporting unit is less than its carrying amount or perform its annual impairment test. When tested quantitatively, we compare the fair value of the applicable reporting unit with its carrying value. We estimate the fair values of our reporting units using a combination of the income and market approach. If the carrying amount of a reporting unit exceeds the reporting unit’s fair value, the amount by which the carrying value exceeds the fair value is recognized as an impairment loss.
During the third fiscal quarter, our Communications and Computing and Automotive and Medical/Industrial/Instrumentation reporting units had lower than anticipated results and continued declines in sales. We considered these factors to be indicators of potential impairment requiring us to test the related goodwill of $39.3 million for Communications and Computing reporting unit and $185.5 million for Automotive and Medical/Industrial/Instrumentation reporting unit for impairment. As of September 30, 2019, we completed a quantitative goodwill impairment analysis related to these reporting units by comparing the fair value of the reporting unit with its carrying amount. We determined the fair value of the reporting units by using discounted cash flow (DCF) and market analyses. Under the market approach, we used revenue and earnings multiples based on comparable industry multiples to estimate the fair value of the reporting units.
A DCF analysis requires us to estimate the future cash flows as well as to select a risk-adjusted discount rate to measure the present value of the anticipated cash flows. When determining future cash flow estimates, we consider historical results adjusted to reflect current and anticipated future operating conditions. We estimate cash flows for a reporting unit over a discrete period and a terminal period (considering expected long-term growth rates and trends).
Based on our analysis, we estimated that the fair value of the Communications and Computing and Automotive and Medical/Industrial/Instrumentation reporting units exceeded their respective carrying value by 19% and 8%, respectively. If our future cash flow projections and other fair value assumptions for our reporting unit change, we may be subject to potential impairment in subsequent quarters. Estimating the fair value of the reporting unit requires us to make assumptions and estimates in such areas as future economic conditions, industry-specific conditions, product pricing, and necessary capital expenditures. The use of different assumptions or estimates for future cash flows, discount rates, or terminal growth rates could produce substantially different estimates of the fair value of the reporting unit.
In the fourth quarter of 2019, we performed our annual impairment test qualitatively and concluded that it was more likely than not that goodwill was not impaired. Management will continue to monitor the reporting units for changes in the business environment that could impact recoverability. The recoverability of goodwill is dependent upon the continued growth of cash flows from our business activities. If the economy or business environment falter and we are unable to achieve our assumed revenue growth rates or profit margin percentages, our projections used would need to be re-measured, which could impact the carrying value of our goodwill in one or more of our reporting units.
We also assess definite-lived intangibles for potential impairment given similar impairment indicators. When indicators of impairment exist related to our definite-lived intangible assets, we use an estimate of the undiscounted cash flows in measuring whether the carrying amount of the assets is recoverable. Measurement of the amount of impairment, if any, is based upon the difference between the asset’s carrying value and estimated fair value. Fair value is determined through various valuation techniques, including cost-based, market and income approaches as considered necessary, which involve judgments related to future cash flows and the application of the appropriate valuation model.
Income Taxes
Deferred income tax assets are reviewed for recoverability, and valuation allowances are provided, when necessary, to reduce deferred income tax assets to the amounts that are more likely than not to be realized based on our estimate of future taxable income. As of December 30, 2019, we had a net non-current deferred income tax asset of $26.1 million, which is comprised of a net deferred tax asset of $164.9 million and a net deferred tax liability of $138.8 million. As of December 30, 2019, our deferred income tax asset of $164.9 million was net of a valuation allowance of approximately $25.9 million. Should our expectations of taxable income change in future periods, it may be necessary to adjust our valuation allowance, which could affect our results of operations in the period such a determination is made.
We are subject to income taxes in the United States and foreign jurisdictions. Significant judgment is required in determining our worldwide provision for income taxes. In the ordinary course of our business, there are many transactions for which the ultimate tax determination is uncertain. Additionally, our calculations of income taxes are based on our interpretations of applicable tax laws in the jurisdictions in which we file.
39
RESULTS OF OPERATIONS
We operate on a 52 or 53 week year ending on the Monday nearest December 31. Fiscal year 2019, 2018, and 2017 were 52 weeks ended December 30, 2019, December 31, 2018 and January 1, 2018, respectively.
The following table sets forth the relationship of various items to net sales in our consolidated statements of operations:
|
|
|
For the Year Ended |
|
|
|||||||||||
|
|
|
December 30, 2019 |
|
|
|
December 31, 2018 |
|
|
|
January 1, 2018 |
|
|
|||
|
Net sales |
|
|
100.0 |
|
% |
|
|
100.0 |
|
% |
|
|
100.0 |
|
% |
|
Cost of goods sold |
|
|
85.1 |
|
|
|
|
83.9 |
|
|
|
|
83.8 |
|
|
|
Gross profit |
|
|
14.9 |
|
|
|
|
16.1 |
|
|
|
|
16.2 |
|
|
|
Operating expenses: |
|
|
|
|
|
|
|
|
|
|
|
|
|
|
|
|
Selling and marketing |
|
|
2.8 |
|
|
|
|
2.6 |
|
|
|
|
2.5 |
|
|
|
General and administrative |
|
|
5.7 |
|
|
|
|
5.6 |
|
|
|
|
4.7 |
|
|
|
Amortization of definite-lived intangibles |
|
|
1.8 |
|
|
|
|
2.1 |
|
|
|
|
1.0 |
|
|
|
Restructuring charges |
|
|
0.3 |
|
|
|
|
0.2 |
|
|
|
|
— |
|
|
|
Total operating expenses |
|
|
10.6 |
|
|
|
|
10.5 |
|
|
|
|
8.2 |
|
|
|
Operating income |
|
|
4.3 |
|
|
|
|
5.6 |
|
|
|
|
8.0 |
|
|
|
Other income (expense): |
|
|
|
|
|
|
|
|
|
|
|
|
|
|
|
|
Interest expense |
|
|
(3.1 |
) |
|
|
|
(2.7 |
) |
|
|
|
(2.0 |
) |
|
|
Other, net |
|
|
0.3 |
|
|
|
|
0.3 |
|
|
|
|
(0.7 |
) |
|
|
Total other expense, net |
|
|
(2.8 |
) |
|
|
|
(2.4 |
) |
|
|
|
(2.7 |
) |
|
|
Income before income taxes |
|
|
1.5 |
|
|
|
|
3.2 |
|
|
|
|
5.3 |
|
|
|
Income tax (provision) benefit |
|
|
(0.2 |
) |
|
|
|
2.9 |
|
|
|
|
(0.6 |
) |
|
|
Net income |
|
|
1.3 |
|
% |
|
|
6.1 |
|
% |
|
|
4.7 |
|
% |
The Anaren acquisition occurred on April 18, 2018. Accordingly, our fiscal year 2018 only includes Anaren’s 2018 results of operations since the acquisition date.
We have two reportable segments: PCB and E-M Solutions. The PCB reportable segment is comprised of multiple operating segments. Factors considered in determining whether operating segments can be aggregated into reportable segments included similarity regarding economic characteristics, products, production process, type or class of customers, distribution methods and regulatory environments.
Net Sales
Total net sales decreased $158.0 million, or 5.5%, to $2,689.3 million for the year ended December 30, 2019 from $2,847.3 million for the year ended December 31, 2018. Net sales for the PCB reportable segment decreased $158.3 million, or 6.0%, to $2,463.0 million for the year ended December 30, 2019 from $2,621.3 million for the year ended December 31, 2018. The reduction in PCB net sales was primarily due to lower demand in our commercial (non-Aerospace and Defense related) end markets, partially offset by increased demand in our Aerospace and Defense end market, which was primarily the result of the impact in the fiscal year 2019 of our acquisition of Anaren (which occurred on April 18, 2018) and higher demand at our other Aerospace and Defense focused facilities. These changes resulted in a 16.7% decrease in the volume of PCB shipments partially offset by an average PCB selling price increase of 10.0%, driven mainly by product mix shift, as compared to the year ended December 31, 2018. Net sales for the E-M Solutions reportable segment increased $0.4 million, or 0.2%, to $226.3 million for the year ended December 30, 2019 from $225.9 million for the year ended December 31, 2018. The increase was primarily due to higher demand in our Automotive end market, partially offset by a lower demand in Medical/Industrial/Instrumentation and Networking/Communications end markets.
Total net sales increased $188.7 million, or 7.1%, to $2,847.3 million for the year ended December 31, 2018 from $2,658.6 million for the year ended January 1, 2018. Net sales for the PCB reportable segment increased $172.8 million, or 7.1%, to $2,621.3 million for the year ended December 31, 2018 from $2,448.5 million for the year ended January 1, 2018. This increase was primarily due to the acquisition of Anaren, which accounted for $191.0 million in net sales in 2018, as well as higher demand in the Aerospace and Defense, Computing/Storage/Peripherals and Medical/Industrial/Instrumentation end markets compared to the year ended January 1, 2018, partially offset by a decline in demand in our Cellular Phone, Networking/Communications and Automotive end markets. These changes resulted in an average PCB selling price increase of 8.1%, driven mainly by product mix shift, however the resulting increase in net sales was partially offset by a 6.9% decrease in the volume of PCB shipments as compared to the year ended January 1, 2018. Net sales for the E-M Solutions reportable segment increased $15.8 million, or 7.5%, to $225.9 million for the year ended December 31, 2018 from $210.1 million for the year ended January 1, 2018. The increase was primarily due to higher demand in our Automotive and Networking/Communications end markets.
For information regarding net sales by country, see Note 17 of the Notes to Consolidated Financial Statements.
40
Gross Margin
Overall gross margin decreased to 14.9% for the year ended December 30, 2019 from 16.1% for the year ended December 31, 2018. Gross margin for the PCB reportable segment decreased to 16.3% for the year ended December 30, 2019 from 17.2% for the year ended December 31, 2018, primarily due to lower volumes in our commercially focused facilities. Gross margin for the E-M Solutions reportable segment decreased to 7.2% for the year ended December 30, 2019 from 8.0% for the year ended December 31, 2018, primarily due to mix shift toward higher direct material content work.
Overall gross margin decreased to 16.1% for the year ended December 31, 2018 from 16.2% for the year ended January 1, 2018. Gross margin for the PCB reportable segment was 17.2% for both the years ended January 1, 2018 and December 31, 2018, primarily due to the acquisition of Anaren and higher capacity utilization at our Aerospace & Defense focused facilities, offset by decreased volumes at our Cellular Phone focused facilities. Gross margin for the PCB reportable segment included a charge of $4.9 million to cost of goods sold associated with inventory resulting from purchase accounting. Gross margin for the E-M Solutions reportable segment decreased to 8.0% for the year ended December 31, 2018 from 8.1% for the year ended January 1, 2018.
Capacity utilization is a key driver for us, which is measured by the actual production as a percentage of maximum capacity. This measure is particularly important in our high volume facilities in Asia, as a significant portion of our operating costs are fixed in nature. Capacity utilization for the year ended December 30, 2019 in our Asia and North America PCB facilities was 64% and 58%, respectively, compared to 75% and 60%, respectively, for the year ended December 31, 2018. The decline in capacity utilization in our Asia and North America PCB facilities was due to a decrease in sales in our commercial end markets.
Selling and Marketing Expenses
Selling and marketing expenses increased $0.7 million to $74.0 million for the year ended December 30, 2019 from $73.3 million for the year ended December 31, 2018. As a percentage of net sales, selling and marketing expenses were 2.8% for the year ended December 30, 2019 as compared to 2.6% for the year ended December 31, 2018. The increase in selling and marketing expenses in 2019 primarily relates to expenses associated with operations acquired in the Anaren acquisition.
Selling and marketing expenses increased $7.4 million to $73.3 million for the year ended December 31, 2018 from $65.9 million for the year ended January 1, 2018. As a percentage of net sales, selling and marketing expenses were 2.6% for the year ended December 31, 2018 as compared to 2.5% for the year ended January 1, 2018. The increase in selling and marketing expenses in 2018 was primarily related to the acquisition of Anaren on April 18, 2018.
General and Administrative Expenses
General and administrative expenses decreased $7.3 million to $152.1 million, or 5.7% of net sales, for the year ended December 30, 2019 from $159.4 million, or 5.6% of net sales, for the year ended December 31, 2018. The decrease in expense was primarily due to the decrease in acquisition-related costs of $6.4 million primarily associated with the acquisition of Anaren on April 18, 2018 and a decrease in stock-based compensation and incentive compensation expense of $4.1 million and $2.3 million, respectively, partially offset by $6.4 million for the additional three and a half months of general and administrative expense associated with operations acquired in the Anaren acquisition in 2019 (which occurred on April 18, 2018).
General and administrative expenses increased $33.3 million to $159.4 million, or 5.6% of net sales, for the year ended December 31, 2018 from $126.1 million, or 4.7% of net sales, for the year ended January 1, 2018. The increase in expense was primarily related to general and administrative expenses incurred by Anaren post acquisition and $13.3 million of acquisition-related costs during the year ended December 31, 2018 primarily associated with the acquisition of Anaren on April 18, 2018.
Restructuring Charges
For the years ended December 30, 2019, December 31, 2018 and January 1, 2018, we incurred restructuring charges of $7.0 million, $5.5 million, and $1.2 million, respectively, related to realignment of operations with anticipated market demand, integration and other efficiency and cost saving measures following the acquisition of Anaren on April 18, 2018 and closure of our facilities in Cleveland, Ohio, Milpitas, California, and Juarez, Mexico and other global realignment efforts following the acquisition of Viasystems on May 31, 2015.
For the year ended December 30, 2019, we recognized restructuring charges of $6.9 million and $0.1 million in our PCB reportable segment and Corporate, respectively. For the year ended December 31, 2018, we recognized restructuring charges of $2.0 million and $3.5 million in our PCB reportable segment and Corporate, respectively. For the year ended January 1, 2018, we recognized restructuring charges of $0.3 million and $0.5 million in our PCB and E-M Solutions reportable segments, respectively, and $0.4 million in Corporate. These charges primarily represent employee separation and contract termination and other costs associated with the restructuring plans.
41
Other Income (Expense)
Other expense, net increased $4.6 million to $73.9 million for the year ended December 30, 2019 from $69.3 million for the year ended December 31, 2018. The increase in other expense, net was primarily due to:
|
|
• |
an increase in expense of $4.9 million due to $1.4 million of foreign exchange losses for the year ended December 30, 2019 compared to $3.5 million foreign exchange gains for the year ended December 31, 2018, primarily resulting from a strengthening Chinese Renminbi relative to the U.S. dollar, |
|
|
• |
an increase in interest expense of $4.3 million, primarily related to the $600.0 million incremental debt incurred in conjunction with the Anaren acquisition, |
|
|
• |
partially offset by an increase in other income related to the sale of other assets of $3.7 million and an increase in government subsidies of $0.9 million. |
Other expense, net decreased $3.5 million to $69.3 million for the year ended December 31, 2018 from $72.8 million for the year ended January 1, 2018. The decrease in other expense, net was primarily due to:
|
|
• |
a decrease in expense of $26.3 million due to $3.5 million of foreign exchange gains for the year ended December 31, 2018 compared to $22.8 million foreign exchange losses for the year ended January 1, 2018, primarily resulting from a weakening Chinese Renminbi relative to the U.S. dollar, |
|
|
• |
partially offset by an increase in interest expense of $25.1 million, primarily related to the $600.0 million incremental borrowing in conjunction with the Anaren acquisition, $23.0 million draw on our U.S. Asset-Based Lending Credit (U.S. ABL), higher amortization of debt issuance costs and debt discount and additional interest expense from our interest rate swap. |
Income Taxes
The provision for income taxes increased $88.7 million to an income tax expense of $4.9 million for the year ended December 30, 2019 from an income tax benefit of $83.8 million for the year ended December 31, 2018. The increase in income tax expense in 2019 was primarily due to the absence of a $121.4 million release of the Company’s valuation allowance against its net deferred tax assets in 2018, partially offset by a reduction in the deferred tax liability related to unremitted foreign earnings and tax benefits resulting from the decreased income before income taxes.
Our effective tax rate is primarily impacted by tax rates in China and Hong Kong, the US federal income tax rate, apportioned state income tax rates, generation of other credits and deductions available to us, as well as changes in valuation allowances, certain non-deductible items, global intangible low taxed income, and an establishment of a deferred tax liability related to unremitted foreign earnings.
The provision for income taxes decreased $99.1 million to an income tax benefit of $83.9 million for the year ended December 31, 2018 from an income tax expense of $15.2 million for the year ended January 1, 2018. The decrease in income tax expense in 2018 was primarily due to a release of the valuation allowance in the U.S. and certain foreign entities and an increase in tax incentives in China, partially offset by an increase to tax expense for the establishment of a deferred tax liability related to unremitted foreign earnings.
Liquidity and Capital Resources
Our principal sources of liquidity have been cash provided by operations, the issuance of Convertible Senior Notes, Term Loan, Senior Notes, and borrowings under our Revolving Credit Facility. Our principal uses of cash have been to finance capital expenditures, finance acquisitions, meet debt service requirements, fund working capital requirements, and pay down existing debt. We anticipate that servicing debt, financing capital expenditures, financing acquisitions, and funding working capital requirements will continue to be the principal demands on our cash in the future.
Cash flow provided by operating activities during the year ended December 30, 2019 was $311.9 million as compared to $273.1 million in the same period in 2018. The increase in cash flow was primarily due to less investment in working capital, partially offset by decrease in net income of $132.3 million.
Net cash used in investing activities was approximately $136.0 million for the year ended December 30, 2019 primarily reflecting purchases of property, plant and equipment. Net cash used in investing activities was approximately $746.2 million for the year ended December 31, 2018 primarily reflecting $596.4 million for the acquisition of Anaren, net of debt assumed, and $150.1 million for purchases of property, plant and equipment.
Net cash used in financing activities was approximately $31.8 million for the year ended December 30, 2019, primarily reflecting repayment of long-term debt of $30.0 million and payment of debt issuance costs of $1.8 million. Net cash provided by financing activities was approximately $321.1 million for the year ended December 31, 2018, primarily reflecting proceeds of $623.0 million from the incremental term and revolving loan borrowings, offset by the repayment of assumed long-term debt related to the
42
acquisition of Anaren of $178.6 million, repayment of long-term debt of $114.4 million, and payment of debt issuance costs and original issue discount of $9.2 million associated with the Term Loan Facility and Senior Notes.
As of December 30, 2019, we had cash and cash equivalents of approximately $400.2 million, of which approximately $349.0 million was held by our foreign subsidiaries, primarily in China.
Our 2020 capital expenditure plan is expected to be in the range of $130.0 million to $140.0 million.
Long-term Debt and Letters of Credit
As of December 30, 2019, we had $1,475.9 million of outstanding debt, net of discount and debt issuance costs, composed of $797.2 million of Term Loan due September 2024, $369.7 million of Senior Notes due October 2025, $239.0 million of Convertible Senior Notes due December 2020, $40.0 million under the U.S. ABL, and $30.0 million under the Asia ABL.
Borrowings under the Term Loan Facility and Senior Notes Facility are subject to certain affirmative and negative covenants, including limitations on indebtedness, corporate transactions, investments, dispositions, and share payments. Under the occurrence of certain events, the ABL Revolving Loans are subject to various financial and operational covenants, including maintaining minimum fixed charge coverage ratios. As of December 30, 2019, we were in compliance with the covenants under the Term Loan Facility, Senior Notes Facility and ABL Revolving Loans.
Based on our current level of operations, we believe that cash generated from operations, cash on hand and cash from the issuance of term and revolving debt will be adequate to meet our currently anticipated capital expenditure, debt service, and working capital needs for the next twelve months. Additional information regarding our indebtedness, including information about availability under our credit facilities, interest rates and other key terms of our outstanding indebtedness, is included in Part I, Item 1, Note 7, Long-term Debt and Letters of Credit, of the Notes to Consolidated Financial Statements included in this Annual Report on Form 10-K.
Contractual Obligations and Commitments
The following table provides information on our contractual obligations as of December 30, 2019:
|
|
|
Total |
|
|
Less Than 1 Year |
|
|
1 - 3 Years |
|
|
4 - 5 Years |
|
|
After 5 Years |
|
|||||
|
Contractual Obligations (1) |
|
(In thousands) |
|
|||||||||||||||||
|
Long-term debt obligations |
|
$ |
1,250,879 |
|
|
$ |
— |
|
|
$ |
— |
|
|
$ |
875,879 |
|
|
$ |
375,000 |
|
|
Convertible debt obligations |
|
|
249,975 |
|
|
|
249,975 |
|
|
|
— |
|
|
|
— |
|
|
|
— |
|
|
Interest on debt obligations |
|
|
306,709 |
|
|
|
62,541 |
|
|
|
117,004 |
|
|
|
106,070 |
|
|
|
21,094 |
|
|
Derivative liabilities |
|
|
13,203 |
|
|
|
4,925 |
|
|
|
8,278 |
|
|
|
— |
|
|
|
— |
|
|
Purchase obligations |
|
|
1,469,067 |
|
|
|
1,318,437 |
|
|
|
141,967 |
|
|
|
675 |
|
|
|
7,988 |
|
|
Total contractual obligations |
|
$ |
3,289,833 |
|
|
$ |
1,635,878 |
|
|
$ |
267,249 |
|
|
$ |
982,624 |
|
|
$ |
404,082 |
|
|
(1) |
Unrecognized uncertain tax benefits of $39.3 million are not included in the table above as the settlement timing is uncertain. Operating leases are not included in the table above – see Note 2 of the Notes to Consolidated Financial Statements for further details. |
Off-Balance Sheet Arrangements
We do not have any relationships with unconsolidated entities or financial partnerships, such as entities often referred to as structured finance or special purpose entities, which would have been established for the purpose of facilitating off-balance sheet arrangements or other contractually narrow or limited purposes. In addition, we do not engage in trading activities involving non-exchange traded contracts. As a result, we are not materially exposed to any financing, liquidity, market, or credit risk that could arise if we had engaged in these relationships.
Seasonality
Orders for our products generally correspond to the production schedules of our customers. We historically experience higher net sales in the third and fourth quarters due to end customer demand in the fourth quarter for consumer electronics products. Seasonal fluctuations also include the Chinese New Year holidays in the first quarter, which typically results in lower net sales. We attribute this decline to shutdowns of our customers’ and our own China based manufacturing facilities surrounding the Chinese New Year public holidays, which normally occur in January or February of each year.
Recently Issued Accounting Standards
For a description of recently adopted and issued accounting standards, including the respective dates of adoption and expected effects on our results of operations and financial condition, see Note 1 of the Notes to Consolidated Financial Statements.
43
|
ITEM 7A. |
QUANTITATIVE AND QUALITATIVE DISCLOSURES ABOUT MARKET RISK |
Foreign currency risks
In the normal course of business we are exposed to risks associated with fluctuations in foreign currency exchange rates associated with transactions that are denominated in currencies other than our functional currencies, as well as the effects of translating amounts denominated in a foreign currency to the U.S. Dollar as a normal part of our financial reporting process. Most of our foreign operations have the U.S. Dollar as their functional currency, however, two of our China facilities utilize the Renminbi (RMB), which results in recognition of translation adjustments included as a component of other comprehensive income. Our foreign exchange exposure results primarily from employee-related and other costs of running our operations in foreign countries, foreign currency denominated purchases and translation of balance sheet accounts denominated in foreign currencies. Our primary foreign exchange exposure is to the RMB. Except for certain equipment purchases, we do not engage in hedging to manage foreign currency risk. However, we may consider the use of derivatives in the future. In general, our Chinese customers pay us in RMB, which partially mitigates this foreign currency exchange risk.
We enter into foreign currency forward contracts to mitigate the impact of changes in foreign currency exchange rates and to reduce the volatility of purchases and other obligations generated in currencies other than our functional currencies. Our foreign subsidiaries may at times purchase forward exchange contracts to manage foreign currency risks in relation to certain purchases of machinery denominated in foreign currencies other than our functional currencies. The notional amount of the foreign exchange contracts as of December 30, 2019 and December 31, 2018 was approximately $3.3 million and $4.3 million, respectively. We designated certain of these foreign exchange contracts as cash flow hedges.
The table below presents information about certain of the foreign currency forward contracts as of December 30, 2019 and
December 31, 2018:
|
|
|
As of December 30, 2019 |
|
|
As of December 31, 2018 |
|
||||||||||
|
|
|
Notional Amount |
|
|
Average Contract Rate or Strike Amount |
|
|
Notional Amount |
|
|
Average Contract Rate or Strike Amount |
|
||||
|
|
|
(In thousands) |
|
|||||||||||||
|
Receive foreign currency/pay USD |
|
|
|
|
|
|
|
|
|
|
|
|
|
|
|
|
|
Japanese Yen |
|
$ |
3,304 |
|
|
|
0.01 |
|
|
$ |
4,313 |
|
|
|
0.01 |
|
|
|
|
|
|
|
|
|
|
|
|
|
|
|
|
|
|
|
|
Estimated fair value, net liability |
|
$ |
(28 |
) |
|
|
|
|
|
$ |
(139 |
) |
|
|
|
|
Interest rate risk
Our business is exposed to risks resulting from fluctuations in interest rates. Our interest expense is more sensitive to fluctuations in the general level of LIBOR interest rates than to changes in rates in other markets. Increases in interest rates would increase interest expense relating to our outstanding variable rate borrowings and increase the cost of debt. Fluctuations in interest rates can also lead to significant fluctuations in the fair value of our debt obligations.
On May 15, 2018, we entered into a four-year pay-fixed, receive floating (1-month LIBOR), interest rate swap arrangement with a notional amount of $400.0 million for the period beginning June 1, 2018 and ending on June 1, 2022. At inception, we designated the interest rate swap as a cash flow hedge and the fair value of the interest rate swap was zero. As of December 30, 2019, the fair value of the interest rate swap was recorded as a liability and as a component of other long-term liabilities in the amount of $12.1 million. Under the terms of the interest rate swap, we pay a fixed rate of 2.84% against the first interest payments of a portion of our LIBOR-based debt and receive floating 1-month LIBOR during the swap period. No ineffectiveness was recognized for the year ended December 30, 2019. During the year ended December 30, 2019, the interest rate swap increased interest expense by $2.3 million.
As of December 30, 2019, approximately 68.3% of our long term debt was based on fixed rates. Based on our borrowings as of December 30, 2019, an assumed 100 basis point change in variable rates would cause our annual interest cost to change by $4.8 million.
On July 27, 2017, the Financial Conduct Authority announced the desire to phase out the use of LIBOR by the end of 2021, which may affect us adversely. If LIBOR is discontinued, we may need to renegotiate the terms of certain of our capital securities and credit instruments, which utilize LIBOR as a benchmark in determining the interest rate, to replace LIBOR with the new standard that is established. There is currently no definitive information regarding the future utilization of LIBOR or of any particular replacement rate. As such, the potential effect of any such event on our cost of capital and net investment income cannot yet be determined.
44
Debt Instruments
The table below presents the fiscal calendar maturities of long-term debt through 2024 and thereafter of our debt instruments as of December 30, 2019 and December 31, 2018:
|
|
As of December 30, 2019 |
|
||||||||||||||||||||||||||||||||||
|
|
|
2020 |
|
|
2021 |
|
|
2022 |
|
|
2023 |
|
|
2024 |
|
|
Thereafter (1) |
|
|
Total |
|
|
Fair Market Value |
|
|
Weighted Average Interest Rate |
|
|||||||||
|
|
|
(In thousands) |
|
|
|
|
|
|||||||||||||||||||||||||||||
|
US$ Variable Rate |
|
$ |
— |
|
|
$ |
— |
|
|
$ |
— |
|
|
$ |
— |
|
|
$ |
875,879 |
|
|
$ |
— |
|
|
$ |
875,879 |
|
|
$ |
878,901 |
|
|
4.19% |
|
|
|
US$ Fixed Rate |
|
|
249,975 |
|
|
|
— |
|
|
|
— |
|
|
|
— |
|
|
|
— |
|
|
|
375,000 |
|
|
|
624,975 |
|
|
|
781,829 |
|
|
4.08% |
|
|
|
Total |
|
$ |
249,975 |
|
|
$ |
— |
|
|
$ |
— |
|
|
$ |
— |
|
|
$ |
875,879 |
|
|
$ |
375,000 |
|
|
$ |
1,500,854 |
|
|
$ |
1,660,730 |
|
|
|
|
|
|
|
|
|
|
|
|
|
|
|
|
|
|
|
|
|
|
|
|
|
|
|
|
|
|
|
|
|
|
|
|
|
|
|
|
|
|
|
|
|
As of December 31, 2018 |
|
||||||||||||||||||||||||||||||||||
|
|
|
2019 |
|
|
2020 |
|
|
2021 |
|
|
2022 |
|
|
2023 |
|
|
Thereafter (1) |
|
|
Total |
|
|
Fair Market Value |
|
|
Weighted Average Interest Rate |
|
|||||||||
|
|
|
(In thousands) |
|
|
|
|
|
|||||||||||||||||||||||||||||
|
US$ Variable Rate |
|
$ |
30,000 |
|
|
$ |
70,000 |
|
|
$ |
— |
|
|
$ |
— |
|
|
$ |
— |
|
|
$ |
805,879 |
|
|
$ |
905,879 |
|
|
$ |
852,592 |
|
|
4.92% |
|
|
|
US$ Fixed Rate |
|
|
— |
|
|
|
249,985 |
|
|
|
— |
|
|
|
— |
|
|
|
— |
|
|
|
375,000 |
|
|
|
624,985 |
|
|
|
641,738 |
|
|
4.08% |
|
|
|
Total |
|
$ |
30,000 |
|
|
$ |
319,985 |
|
|
$ |
— |
|
|
$ |
— |
|
|
$ |
— |
|
|
$ |
1,180,879 |
|
|
$ |
1,530,864 |
|
|
$ |
1,494,330 |
|
|
|
|
|
|
(1) |
Interest rate swap effectively fixed $400,000 of variable rate debt. |
Interest Rate Swap Contracts
The table below presents information regarding our interest rate swaps as of December 30, 2019:
|
|
|
2019 |
|
|
Fair Market Value |
|
||
|
|
|
(In thousands, except interest rates) |
|
|||||
|
Average interest payout rate |
|
|
2.84 |
% |
|
|
|
|
|
Interest payout amount |
|
$ |
(11,482 |
) |
|
|
|
|
|
Average interest received rate |
|
|
2.27 |
% |
|
|
|
|
|
Interest received amount |
|
|
9,167 |
|
|
|
|
|
|
Fair value loss as of December 30, 2019 |
|
|
|
|
|
$ |
(12,067 |
) |
45
|
ITEM 8. |
FINANCIAL STATEMENTS AND SUPPLEMENTARY DATA |
Reference is made to our consolidated financial statements, the notes thereto, and the report thereon, commencing on page 54 of this report, which consolidated financial statements, notes and report are incorporated herein by reference.
We operate on a 52 or 53 week year ending on the Monday nearest December 31. Fiscal years 2019 and 2018 were 52 weeks and ended December 30, 2019 and December 31, 2018, respectively, and each quarter of both fiscal years 2019 and 2018 contained 91 days.
|
|
|
First Quarter |
|
|
Second Quarter |
|
|
Third Quarter |
|
|
Fourth Quarter |
|
||||
|
|
|
(In thousands, except per share data) |
|
|||||||||||||
|
Year Ended December 30, 2019: |
|
|
|
|
|
|
|
|
|
|
|
|
|
|
|
|
|
Net sales |
|
$ |
620,200 |
|
|
$ |
633,038 |
|
|
$ |
716,817 |
|
|
|
719,253 |
|
|
Gross profit |
|
|
88,685 |
|
|
|
84,615 |
|
|
|
103,834 |
|
|
|
124,549 |
|
|
(Loss) income before income taxes |
|
|
(4,728 |
) |
|
|
594 |
|
|
|
23,919 |
|
|
|
26,399 |
|
|
Net (loss) income |
|
|
(3,252 |
) |
|
|
3,424 |
|
|
|
15,870 |
|
|
|
25,259 |
|
|
Net (loss) income attributable to TTM Technologies, Inc. stockholders |
|
|
(3,252 |
) |
|
|
3,424 |
|
|
|
15,870 |
|
|
|
25,259 |
|
|
(Loss) earnings per share attributable to TTM Technologies, Inc. stockholders: |
|
|
|
|
|
|
|
|
|
|
|
|
|
|
|
|
|
Basic |
|
$ |
(0.03 |
) |
|
$ |
0.03 |
|
|
$ |
0.15 |
|
|
$ |
0.24 |
|
|
Diluted |
|
$ |
(0.03 |
) |
|
$ |
0.03 |
|
|
$ |
0.14 |
|
|
$ |
0.21 |
|
|
Year Ended December 31, 2018: |
|
|
|
|
|
|
|
|
|
|
|
|
|
|
|
|
|
Net sales |
|
$ |
663,582 |
|
|
$ |
716,887 |
|
|
$ |
755,837 |
|
|
$ |
710,955 |
|
|
Gross profit |
|
|
88,678 |
|
|
|
116,140 |
|
|
|
129,584 |
|
|
|
122,632 |
|
|
Income before income taxes |
|
|
15,147 |
|
|
|
17,459 |
|
|
|
34,538 |
|
|
|
22,624 |
|
|
Net income |
|
|
10,097 |
|
|
|
84,004 |
|
|
|
27,001 |
|
|
|
52,482 |
|
|
Net income attributable to TTM Technologies, Inc. stockholders |
|
|
10,097 |
|
|
|
84,004 |
|
|
|
27,001 |
|
|
|
52,482 |
|
|
Earnings per share attributable to TTM Technologies, Inc. stockholders: |
|
|
|
|
|
|
|
|
|
|
|
|
|
|
|
|
|
Basic |
|
$ |
0.10 |
|
|
$ |
0.81 |
|
|
$ |
0.26 |
|
|
$ |
0.51 |
|
|
Diluted |
|
$ |
0.09 |
|
|
$ |
0.65 |
|
|
$ |
0.22 |
|
|
$ |
0.42 |
|
46
|
ITEM 9. |
CHANGES IN AND DISAGREEMENTS WITH ACCOUNTANTS ON ACCOUNTING AND FINANCIAL DISCLOSURE |
Not applicable.
|
ITEM 9A. |
CONTROLS AND PROCEDURES |
Evaluation of Disclosure Controls and Procedures
Our management, under the supervision and with the participation of our Chief Executive Officer (CEO) and Chief Financial Officer (CFO), has evaluated the effectiveness of the design and operation of our disclosure controls and procedures (as defined in Exchange Act Rules 13a-15(e) and 15d-15(e)) as of the end of the period covered by this Report. Based on this evaluation, our CEO and CFO have concluded that, as of December 30, 2019, such disclosure controls and procedures were effective to provide reasonable assurance that information we are required to disclose in reports that we file or submit under the Exchange Act is (i) recorded, processed, summarized and reported within the time periods specified in the SEC’s rules and forms and (ii) accumulated and communicated to our management, including our CEO and CFO, as appropriate to allow timely decisions regarding required disclosures.
Management’s Report on Internal Control over Financial Reporting
Our management is responsible for establishing and maintaining adequate internal control over financial reporting, (as defined in Exchange Act Rules 13a-15(f) and 15d-15(f)) to provide reasonable assurance regarding the reliability of our financial reporting and the preparation of financial statements for external purposes in accordance with accounting principles generally accepted in the United States of America (U.S. GAAP). Under the supervision of and with the participation of our CEO and CFO, management conducted an assessment of the effectiveness of our internal control over financial reporting as of December 30, 2019 based on the criteria established in Internal Control — Integrated Framework (2013) issued by the Committee of Sponsoring Organizations of the Treadway Commission (COSO). Based on this assessment, management concluded that our internal control over financial reporting was effective as of December 30, 2019.
The effectiveness of our internal control over financial reporting as of December 30, 2019 has been audited by KPMG LLP, an independent registered public accounting firm, as stated in their report, which appears under the heading “Report of Independent Registered Public Accounting Firm” on page 55 of this Report.
Inherent Limitations on Effectiveness of Controls
A control system, no matter how well designed and operated, can provide only reasonable, not absolute, assurance that the control system’s objectives will be met. The design of a control system must reflect the fact that there are resource constraints, and the benefits of controls must be considered relative to their costs. Further, because of the inherent limitations in all control systems, no evaluation of controls can provide absolute assurance that misstatements due to error or fraud will not occur or that all control issues and instances of fraud, if any, have been detected. In addition, the design of any system of controls is based in part on certain assumptions about the likelihood of future events.
Changes in Internal Control over Financial Reporting
There were no changes in our internal control over financial reporting (as defined in Rules 13a-15(f) and 15d-15(f) under the Exchange Act) during the quarter ended December 30, 2019 that have materially affected, or are reasonably likely to materially affect, our internal control over financial reporting.
|
ITEM 9B. |
OTHER INFORMATION |
Not applicable.
47
PART III
|
ITEM 10. |
DIRECTORS, EXECUTIVE OFFICERS AND CORPORATE GOVERNANCE |
The information required by this Item is incorporated herein by reference to the definitive Proxy Statement to be filed pursuant to Regulation 14A of the Exchange Act for our 2020 Annual Meeting of Stockholders.
|
ITEM 11. |
EXECUTIVE COMPENSATION. |
The information required by this Item is incorporated herein by reference to the definitive Proxy Statement to be filed pursuant to Regulation 14A of the Exchange Act for our 2020 Annual Meeting of Stockholders.
|
ITEM 12. |
SECURITY OWNERSHIP OF CERTAIN BENEFICIAL OWNERS AND MANAGEMENT AND RELATED STOCKHOLDER MATTERS. |
The information required by this Item is incorporated herein by reference to the definitive Proxy Statement to be filed pursuant to Regulation 14A of the Exchange Act for our 2020 Annual Meeting of Stockholders.
|
ITEM 13. |
CERTAIN RELATIONSHIPS AND RELATED TRANSACTIONS, AND DIRECTOR INDEPENDENCE. |
The information required by this Item is incorporated herein by reference to the definitive Proxy Statement to be filed pursuant to Regulation 14A of the Exchange Act for our 2020 Annual Meeting of Stockholders.
|
ITEM 14. |
PRINCIPAL ACCOUNTING FEES AND SERVICES. |
The information required by this Item is incorporated herein by reference to the definitive Proxy Statement to be filed pursuant to Regulation 14A of the Exchange Act for our 2020 Annual Meeting of Stockholders.
48
PART IV
|
ITEM 15. |
EXHIBITS, FINANCIAL STATEMENT SCHEDULES |
|
|
(a) |
Financial Statements |
Financial Statements are listed in the Index to Consolidated Financial Statements on page 54 of this Report.
|
|
(b) |
Exhibits |
|
Exhibit Number |
Exhibits |
|
|
|
|
2.1 |
|
|
|
|
|
2.4 |
|
|
|
|
|
3.1 |
Registrant’s Certificate of Incorporation, as amended May 12,2016(1) |
|
|
|
|
3.2 |
Registrant’s Fourth Amended and Restated Bylaws, as amended March 2, 2016(2) |
|
|
|
|
4.1 |
|
|
|
|
|
4.3 |
|
|
|
|
|
4.4 |
|
|
|
|
|
4.8 |
|
|
|
|
|
4.9 |
|
|
|
|
|
4.10* |
|
|
|
|
|
10.13‡ |
|
|
|
|
|
10.15 |
Form of Director and Officer Indemnification Agreement, dated December 10, 2014(8) |
|
|
|
|
10.16 |
|
|
|
|
|
10.20 |
|
|
|
|
|
10.22‡ |
|
|
|
|
|
10.24 |
|
|
|
|
|
10.25 |
|
|
|
|
|
10.26 |
|
|
|
|
|
10.27 |
|
|
|
|
|
10.28 |
|
|
|
|
|
10.29 |
|
|
|
|
|
10.30 |
|
|
|
|
49
|
10.31 |
|
|
|
|
|
10.32 |
|
|
|
|
|
10.33 |
|
|
|
|
|
10.34 |
|
|
|
|
|
10.35 |
|
|
|
|
|
10.40 |
|
|
|
|
|
10.41 |
|
|
|
|
|
10.42 |
|
|
|
|
|
10.43 |
Form of Executive Change in Control Severance Agreement and schedule of agreements(13) |
|
|
|
|
10.44 |
|
|
|
|
|
10.45 |
|
|
|
|
|
10.46 |
|
|
|
|
|
10.47 |
|
|
|
|
|
10.48 |
Amendment to TTM Technologies, Inc. 2014 Incentive Compensation Plan(16) |
|
|
|
|
10.49 |
|
|
|
|
|
10.50 |
Commitment Letter from Barclays Bank PLC dated December 1, 2017(20) |
|
|
|
|
10.51 |
|
|
|
|
|
10.52 |
|
|
|
|
|
10.53 |
TTM Technologies, Inc. Executive Compensation Recoupment Policy(23) |
|
|
|
|
10.54 |
|
50
|
|
|
|
10.55 |
|
|
|
|
|
10.56 |
|
|
|
|
|
10.57 |
|
|
|
|
|
10.58 |
|
|
|
|
|
21.1* |
|
|
|
|
|
23.1* |
Consent of KPMG LLP, independent registered public accounting firm |
|
|
|
|
31.1* |
CEO Certification Pursuant to Section 302 of the Sarbanes-Oxley Act of 2002 |
|
|
|
|
31.2* |
CFO Certification Pursuant to Section 302 of the Sarbanes-Oxley Act of 2002 |
|
|
|
|
32.1* |
CEO Certification Pursuant to Section 906 of the Sarbanes-Oxley Act of 2002 |
|
|
|
|
32.2* |
CFO Certification Pursuant to Section 906 of the Sarbanes-Oxley Act of 2002 |
|
|
|
|
101.INS |
Inline XBRL Instance Document – the instance document does not appear in the Interactive Data File because its XBRL tags are embedded within the inline XBRL document. |
|
|
|
|
101.SCH |
Inline XBRL Taxonomy Extension Schema Document |
|
|
|
|
101.CAL |
Inline XBRL Taxonomy Extension Calculation Linkbase Documents |
|
|
|
|
101.DEF |
Inline XBRL Taxonomy Extension Definition Linkbase Documents |
|
|
|
|
101.LAB |
Inline XBRL Taxonomy Extension Label Linkbase Documents |
|
|
|
|
101.PRE |
Inline XBRL Taxonomy Extension Presentation Linkbase Documents |
|
|
|
|
104 |
Cover Page Interactive Data File (formatted as inline XBRL and contained in Exhibit 101) |
|
(1) |
Incorporated by reference to the Registrant’s Form 8-K as filed with the Commission on June 6, 2011 and to the Registrant’s Form 8-K as filed with the commission on May 18, 2016. |
|
(2) |
Incorporated by reference to the Registrant’s Form 8-K as filed with the Commission on March 8, 2016. |
|
(3) |
Incorporated by reference to the Registrant’s Form 8-K as filed with the Commission on May 15, 2008. |
|
(4) |
Incorporated by reference to the Registrant’s Form 8-K as filed with the Commission on August 30, 2005. |
|
(5) |
Incorporated by reference to the Registrant’s Form 8-K as filed with the Commission on December 23, 2009. |
|
(6) |
Incorporated by reference to the Registrant’s Form 8-K as filed with the Commission on December 20, 2013. |
|
(7) |
Incorporated by reference to the Registrant’s Form S-8 as filed with the Commission on August 13, 2014. |
|
(8) |
Incorporated by reference to the Registrant’s Form 8-K as filed with the Commission on December 15, 2014. |
|
(9) |
Incorporated by reference to the Registrant’s Form 8-K as filed with the Commission on November 16, 2009. |
|
(10) |
Incorporated by reference to the Registrant’s Form 8-K as filed with the Commission on October 22, 2010. |
|
(11) |
Incorporated by reference to the Registrant’s Form 8-K as filed with the Commission on September 19, 2011. |
|
(12) |
Incorporated by reference to the Registrant’s Form 8-K as filed with the Commission on January 14, 2014. |
|
(13) |
Incorporated by reference to the Registrant’s Form 10-Q as filed with the Commission on May 5, 2015. |
|
(14) |
Incorporated by reference to the Registrant’s Form 8-K as filed with the Commission on May 29, 2015. |
|
(15) |
Incorporated by reference to the Registrant’s Form 10-Q as filed with the Commission on August 10, 2015. |
|
(16) |
Incorporated by reference to the Registrant’s Form S-8 as filed with the Commission on June 1, 2016. |
|
(17) |
Incorporated by reference to the Registrant’s Form 10-Q as filed with the Commission on August 4, 2016. |
|
(18) |
Incorporated by reference to the Registrant’s Form 10-Q as filed with the Commission on November 3, 2016. |
51
|
(19) |
Incorporated by reference to the Registrant’s Form 8-K filed with the Commission on September 29, 2017. |
|
(20) |
Incorporated by reference to the Registrant’s Form 8-K filed with the Commission on December 4, 2017. |
|
(21) |
Incorporated by reference to the Registrant’s Form 8-K filed with the Commission on December 14, 2017. |
|
(22) |
Incorporated by reference to the Registrant’s Form 8-K filed with the Commission on April 18, 2018. |
|
(23) |
Incorporated by reference to the Registrant’s Form 10-K filed with the Commission on February 26, 2019. |
|
(24) |
Incorporated by reference to the Registrant’s Form 8-K filed with the Commission on June 6, 2019. |
|
(25) |
Incorporated by reference to the Registrant’s Form 10-Q filed with the Commission on August 7, 2019. |
|
(26) |
Incorporated by reference to the Registrant’s Form 8-K filed with the Commission on January 22, 2020. |
|
‡ |
Management contract or Compensation Plan |
|
* |
Filed herewith |
|
|
(c) |
Financial Statement Schedules |
None.
|
ITEM 16. |
FORM 10-K SUMMARY |
None.
52
SIGNATURES
Pursuant to the requirements of Section 13 or 15(d) of the Securities Exchange Act of 1934, the registrant has duly caused this Report to be signed on its behalf by the undersigned, thereunto duly authorized.
|
TTM TECHNOLOGIES, INC. |
||
|
|
|
|
|
By: |
|
/s/ Thomas T. Edman |
|
|
|
Thomas T. Edman President and Chief Executive Officer |
Date: February 25, 2020
Pursuant to the requirements of the Securities Exchange Act of 1934, this Report has been signed below by the following persons on behalf of the registrant and in the capacities and on the dates indicated.
|
|
|
|
|
|
|
Name |
|
Title |
|
Date |
|
|
|
|
|
|
|
/s/ Thomas T. Edman
Thomas T. Edman |
|
President, Chief Executive Officer and Director (Principal Executive Officer) |
|
February 25, 2020 |
|
|
|
|
|
|
|
/s/ Todd B. Schull
Todd B. Schull |
|
Executive Vice President and |
|
February 25, 2020 |
|
|
|
|
|
|
|
/s/ Robert E. Klatell
Robert E. Klatell |
|
Chairman of the Board |
|
February 25, 2020 |
|
|
|
|
|
|
|
/s/ Kenton K. Alder
Kenton K. Alder |
|
Director |
|
February 25, 2020 |
|
|
|
|
|
|
|
/s/ Julie S. England
Julie S. England |
|
Director |
|
February 25, 2020 |
|
|
|
|
|
|
|
/s/ Philip G. Franklin
Philip G. Franklin |
|
Director |
|
February 25, 2020 |
|
|
|
|
|
|
|
/s/ Rex D. Geveden
Rex D. Geveden |
|
Director |
|
February 25, 2020 |
|
|
|
|
|
|
|
/s/ Chantel E. Lenard
Chantel E. Lenard |
|
Director |
|
February 25, 2020 |
|
|
|
|
|
|
|
/s/ John G. Mayer
John G. Mayer |
|
Director |
|
February 25, 2020 |
|
|
|
|
|
|
|
/s/ Tang Chung Yen, Tom
Tang Chung Yen, Tom |
|
Director |
|
February 25, 2020 |
|
|
|
|
|
|
|
/s/ Dov S. Zakheim
Dov S. Zakheim |
|
Director |
|
February 25, 2020 |
53
TTM TECHNOLOGIES, INC.
Index to Consolidated Financial Statements
|
55 |
|
|
Consolidated Balance Sheets as of December 30, 2019 and December 31, 2018 |
58 |
|
59 |
|
|
60 |
|
|
61 |
|
|
62 |
|
|
63 |
54
Report of Independent Registered Public Accounting Firm
To the Stockholders and Board of Directors
TTM Technologies, Inc.:
Opinions on the Consolidated Financial Statements and Internal Control Over Financial Reporting
We have audited the accompanying consolidated balance sheets of TTM Technologies, Inc. and subsidiaries (the Company) as of December 30, 2019 and December 31, 2018, the related consolidated statements of operations, comprehensive income, stockholders’ equity, and cash flows for each of the years in the three-year period ended December 30, 2019, and the related notes (collectively, the consolidated financial statements). We also have audited the Company’s internal control over financial reporting as of December 30, 2019, based on criteria established in Internal Control – Integrated Framework (2013) issued by the Committee of Sponsoring Organizations of the Treadway Commission.
In our opinion, the consolidated financial statements referred to above present fairly, in all material respects, the financial position of the Company as of December 30, 2019 and December 31, 2018, and the results of its operations and its cash flows for each of the years in the three-year period ended December 30, 2019, in conformity with U.S. generally accepted accounting principles. Also in our opinion, the Company maintained, in all material respects, effective internal control over financial reporting as of December 30, 2019, based on criteria established in Internal Control – Integrated Framework (2013) issued by the Committee of Sponsoring Organizations of the Treadway Commission.
Change in Accounting Principle
As discussed in Note 1 to the consolidated financial statements, the Company changed its method of accounting for leases in fiscal 2019 due to the adoption of the Financial Accounting Standards Board’s (FASB) Accounting Standards Codification (ASC) Topic 842, Leases.
As discussed in Note 1 to the consolidated financial statements, the Company changed its method of accounting for revenue in fiscal 2018 due to the adoption of the FASB’s ASC Topic 606, Revenue from Contracts with Customers.
Basis for Opinions
The Company’s management is responsible for these consolidated financial statements, for maintaining effective internal control over financial reporting, and for its assessment of the effectiveness of internal control over financial reporting, included in the accompanying Management’s Report on Internal Control over Financial Reporting appearing under Item 9A. Our responsibility is to express an opinion on the Company’s consolidated financial statements and an opinion on the Company’s internal control over financial reporting based on our audits. We are a public accounting firm registered with the Public Company Accounting Oversight Board (United States) (PCAOB) and are required to be independent with respect to the Company in accordance with the U.S. federal securities laws and the applicable rules and regulations of the Securities and Exchange Commission and the PCAOB.
We conducted our audits in accordance with the standards of the PCAOB. Those standards require that we plan and perform the audits to obtain reasonable assurance about whether the consolidated financial statements are free of material misstatement, whether due to error or fraud, and whether effective internal control over financial reporting was maintained in all material respects.
Our audits of the consolidated financial statements included performing procedures to assess the risks of material misstatement of the consolidated financial statements, whether due to error or fraud, and performing procedures that respond to those risks. Such procedures included examining, on a test basis, evidence regarding the amounts and disclosures in the consolidated financial statements. Our audits also included evaluating the accounting principles used and significant estimates made by management, as well as evaluating the overall presentation of the consolidated financial statements. Our audit of internal control over financial reporting included obtaining an understanding of internal control over financial reporting, assessing the risk that a material weakness exists, and testing and evaluating the design and operating effectiveness of internal control based on the assessed risk. Our audits also included performing such other procedures as we considered necessary in the circumstances. We believe that our audits provide a reasonable basis for our opinions.
55
Definition and Limitations of Internal Control Over Financial Reporting
A company’s internal control over financial reporting is a process designed to provide reasonable assurance regarding the reliability of financial reporting and the preparation of financial statements for external purposes in accordance with generally accepted accounting principles. A company’s internal control over financial reporting includes those policies and procedures that (1) pertain to the maintenance of records that, in reasonable detail, accurately and fairly reflect the transactions and dispositions of the assets of the company; (2) provide reasonable assurance that transactions are recorded as necessary to permit preparation of financial statements in accordance with generally accepted accounting principles, and that receipts and expenditures of the company are being made only in accordance with authorizations of management and directors of the company; and (3) provide reasonable assurance regarding prevention or timely detection of unauthorized acquisition, use, or disposition of the company’s assets that could have a material effect on the financial statements.
Because of its inherent limitations, internal control over financial reporting may not prevent or detect misstatements. Also, projections of any evaluation of effectiveness to future periods are subject to the risk that controls may become inadequate because of changes in conditions, or that the degree of compliance with the policies or procedures may deteriorate.
Critical Audit Matters
The critical audit matters communicated below are matters arising from the current period audit of the consolidated financial statements that were communicated or required to be communicated to the audit committee and that: (1) relate to accounts or disclosures that are material to the consolidated financial statements and (2) involved our especially challenging, subjective, or complex judgments. The communication of critical audit matters does not alter in any way our opinion on the consolidated financial statements, taken as a whole, and we are not, by communicating the critical audit matters below, providing separate opinions on the critical audit matters or on the accounts or disclosures to which they relate.
Assessment of the goodwill impairment test for the AMI&I and C&C reporting units
As discussed in Note 5 to the consolidated financial statements, the goodwill balance as of December 30, 2019 was $775 million. Of that amount, $186 million related to the Automotive, Medical, Industrial and Instrumentation (AMI&I) reporting unit and $39 million related to the Communications and Computing (C&C) reporting unit. The Company performs goodwill impairment testing on an annual basis and whenever events or changes in circumstances indicate that the carrying value of a reporting unit might exceed its fair value.
We identified the assessment of the goodwill impairment test for the AMI&I and C&C reporting units as a critical audit matter. The estimated fair values of the AMI&I and C&C reporting units were 8% and 19%, respectively, above their carrying values, indicating a higher risk that goodwill may be impaired. This resulted in the application of greater auditor judgment. The revenue growth rate and the discount rate assumptions used to estimate the fair values of the reporting units were challenging to test. This is because minor changes to those assumptions could have a significant effect on the Company’s assessment of the carrying value of the goodwill.
The primary procedures we performed to address this critical audit matter included the following. We tested certain internal controls over the Company’s goodwill impairment assessment process, including controls related to the determination of the fair values of the reporting units. We also tested controls related to revenue growth rates and the assumptions used to develop the discount rates. We performed sensitivity analyses over the revenue growth rate and discount rate assumptions. This was done to assess their impact on the Company’s determination that the fair values of the AM&I and C&C reporting units exceeded their carrying values. We evaluated the Company’s forecasted revenue growth rates for the AMI&I and C&C reporting units, by comparing the growth rate assumptions to forecasted growth rates in analyst reports. We compared the Company’s historical revenue forecasts to actual results to assess the Company’s ability to accurately forecast. In addition, we involved a valuation professional with specialized skill and knowledge, who assisted in:
|
|
• |
comparing the Company’s discount rates against discount rate ranges that were independently developed using publicly available market data for comparable entities; |
|
|
• |
developing estimates of the AMI&I and C&C reporting units’ fair values using the Company’s cash flow forecasts for those reporting units and independently developed discount rates; and |
|
|
• |
comparing the results of our estimates of fair value to the Company’s fair value estimates. |
56
Evaluation of the sufficiency of audit evidence over net sales
As discussed in Note 1 to the consolidated financial statements, the Company recorded approximately $2.7 billion of net sales in 2019. Net sales are recognized primarily from the manufacture and distribution of printed circuit boards, backplane assemblies, electro-mechanical solutions, radio-frequency and microwave components and assemblies from numerous locations around the world.
We identified the evaluation of the sufficiency of audit evidence over net sales as a critical audit matter. Evaluating the sufficiency of audit evidence obtained required especially subjective auditor judgment because of the geographical dispersion and decentralized nature of the Company’s net sales generating activities and related control environment. This included determining the Company locations at which procedures were performed and the supervision and review of the procedures performed at those locations. It also included the involvement of IT professionals with specialized skills and knowledge, who assisted in the performance of certain procedures.
The primary procedures we performed to address this critical audit matter included the following. We applied auditor judgment to determine the nature and extent of procedures to be performed over net sales, including determining the locations at which those procedures were to be performed. At each location where procedures were performed, we (1) tested certain internal controls over the Company’s net sales processes, including the Company’s controls over the accurate recording of sales amounts; (2) involved IT professionals, who assisted in testing certain IT applications used by the Company in its revenue recognition processes; and (3) tested the recorded net sales by selecting a sample of transactions and comparing the amounts recognized to underlying documentation, including contracts with customers and shipping documentation. In addition, we evaluated the overall sufficiency of audit evidence obtained over net sales.
/s/ KPMG LLP
We have served as the Company’s auditor since 2014.
Irvine, California
February 25, 2020
57
TTM TECHNOLOGIES, INC.
Consolidated Balance Sheets
|
|
|
As of |
|
|||||
|
|
|
December 30, |
|
|
December 31, |
|
||
|
|
|
2019 |
|
|
2018 |
|
||
|
|
|
(In thousands, except par value) |
|
|||||
|
ASSETS |
|
|
|
|
|
|
|
|
|
Current assets: |
|
|
|
|
|
|
|
|
|
Cash and cash equivalents |
|
$ |
|
|
|
$ |
|
|
|
Accounts receivable, net |
|
|
|
|
|
|
|
|
|
Contract assets |
|
|
|
|
|
|
|
|
|
Inventories |
|
|
|
|
|
|
|
|
|
Prepaid expenses and other current assets |
|
|
|
|
|
|
|
|
|
Total current assets |
|
|
|
|
|
|
|
|
|
Property, plant and equipment, net |
|
|
|
|
|
|
|
|
|
Operating lease right-of-use assets |
|
|
|
|
|
|
— |
|
|
Goodwill |
|
|
|
|
|
|
|
|
|
Definite-lived intangibles, net |
|
|
|
|
|
|
|
|
|
Deposits and other non-current assets |
|
|
|
|
|
|
|
|
|
|
|
$ |
|
|
|
$ |
|
|
|
LIABILITIES AND EQUITY |
|
|
|
|
|
|
|
|
|
Current liabilities: |
|
|
|
|
|
|
|
|
|
Short-term debt, including current portion of long-term debt |
|
$ |
|
|
|
$ |
|
|
|
Accounts payable |
|
|
|
|
|
|
|
|
|
Contract liabilities |
|
|
|
|
|
|
|
|
|
Accrued salaries, wages and benefits |
|
|
|
|
|
|
|
|
|
Other |
|
|
|
|
|
|
|
|
|
Total current liabilities |
|
|
|
|
|
|
|
|
|
Long-term debt, net of discount and issuance costs |
|
|
|
|
|
|
|
|
|
Operating lease liabilities |
|
|
|
|
|
|
— |
|
|
Other long-term liabilities |
|
|
|
|
|
|
|
|
|
Total long-term liabilities |
|
|
|
|
|
|
|
|
|
Commitments and contingencies (Note 13) |
|
|
|
|
|
|
|
|
|
Equity: |
|
|
|
|
|
|
|
|
|
Common stock, $ shares issued and outstanding as of December 30, 2019 and December 31, 2018, respectively |
|
|
|
|
|
|
|
|
|
Additional paid-in capital |
|
|
|
|
|
|
|
|
|
Retained earnings |
|
|
|
|
|
|
|
|
|
Accumulated other comprehensive loss |
|
|
( |
) |
|
|
( |
) |
|
Total stockholders’ equity |
|
|
|
|
|
|
|
|
|
|
|
$ |
|
|
|
$ |
|
|
See accompanying notes to consolidated financial statements.
58
TTM TECHNOLOGIES, INC.
Consolidated Statements of Operations
|
|
|
For the Year Ended |
|
|||||||||
|
|
|
December 30, |
|
|
December 31, |
|
|
January 1, |
|
|||
|
|
|
2019 |
|
|
2018 |
|
|
2018 |
|
|||
|
|
|
(In thousands, except per share data) |
|
|||||||||
|
Net sales |
|
$ |
|
|
|
$ |
|
|
|
$ |
|
|
|
Cost of goods sold |
|
|
|
|
|
|
|
|
|
|
|
|
|
Gross profit |
|
|
|
|
|
|
|
|
|
|
|
|
|
Operating expenses: |
|
|
|
|
|
|
|
|
|
|
|
|
|
Selling and marketing |
|
|
|
|
|
|
|
|
|
|
|
|
|
General and administrative |
|
|
|
|
|
|
|
|
|
|
|
|
|
Amortization of definite-lived intangibles |
|
|
|
|
|
|
|
|
|
|
|
|
|
Restructuring charges |
|
|
|
|
|
|
|
|
|
|
|
|
|
Total operating expenses |
|
|
|
|
|
|
|
|
|
|
|
|
|
Operating income |
|
|
|
|
|
|
|
|
|
|
|
|
|
Other income (expense): |
|
|
|
|
|
|
|
|
|
|
|
|
|
Interest expense |
|
|
( |
) |
|
|
( |
) |
|
|
( |
) |
|
Loss on extinguishment of debt |
|
|
— |
|
|
|
— |
|
|
|
( |
) |
|
Other, net |
|
|
|
|
|
|
|
|
|
|
( |
) |
|
Total other expense, net |
|
|
( |
) |
|
|
( |
) |
|
|
( |
) |
|
Income before income taxes |
|
|
|
|
|
|
|
|
|
|
|
|
|
Income tax (provision) benefit |
|
|
( |
) |
|
|
|
|
|
|
( |
) |
|
Net income |
|
|
|
|
|
|
|
|
|
|
|
|
|
Less: Net income attributable to the non-controlling interest |
|
|
— |
|
|
|
— |
|
|
|
( |
) |
|
Net income attributable to TTM Technologies, Inc. stockholders |
|
$ |
|
|
|
$ |
|
|
|
$ |
|
|
|
|
|
|
|
|
|
|
|
|
|
|
|
|
|
Earnings per share attributable to TTM Technologies, Inc. stockholders: |
|
|
|
|
|
|
|
|
|
|
|
|
|
Basic earnings per share |
|
$ |
|
|
|
$ |
|
|
|
$ |
|
|
|
Diluted earnings per share |
|
$ |
|
|
|
$ |
|
|
|
$ |
|
|
See accompanying notes to consolidated financial statements.
59
TTM TECHNOLOGIES, INC.
Consolidated Statements of Comprehensive Income
|
|
|
For the Year Ended |
|
|||||||||
|
|
|
December 30, |
|
|
December 31, |
|
|
January 1, |
|
|||
|
|
|
2019 |
|
|
2018 |
|
|
2018 |
|
|||
|
|
|
(In thousands) |
|
|||||||||
|
Net income |
|
$ |
|
|
|
$ |
|
|
|
$ |
|
|
|
Other comprehensive (loss) income, net of tax: |
|
|
|
|
|
|
|
|
|
|
|
|
|
Foreign currency translation adjustments, net |
|
|
( |
) |
|
|
( |
) |
|
|
|
|
|
Pension obligation adjustments, net |
|
|
( |
) |
|
|
( |
) |
|
|
— |
|
|
Net unrealized (losses) gains on cash flow hedges: |
|
|
|
|
|
|
|
|
|
|
|
|
|
Unrealized (loss) gain on effective cash flow hedges during the year, net |
|
|
( |
) |
|
|
( |
) |
|
|
|
|
|
Loss realized in the statement of operations |
|
|
|
|
|
|
|
|
|
|
|
|
|
Net |
|
|
( |
) |
|
|
( |
) |
|
|
|
|
|
Other comprehensive (loss) income, net of tax |
|
|
( |
) |
|
|
( |
) |
|
|
|
|
|
Comprehensive income, net of tax |
|
|
|
|
|
|
|
|
|
|
|
|
|
Less: Comprehensive income attributable to the non-controlling interest |
|
|
— |
|
|
|
— |
|
|
|
( |
) |
|
Comprehensive income attributable to TTM Technologies, Inc. stockholders |
|
$ |
|
|
|
$ |
|
|
|
$ |
|
|
See accompanying notes to consolidated financial statements.
60
TTM TECHNOLOGIES, INC.
Consolidated Statements of Stockholders’ Equity
|
|
|
Common Stock |
|
|
Additional Paid-In |
|
|
Retained |
|
|
Accumulated Other Comprehensive |
|
|
Total TTM Technologies, Inc. Stockholders’ |
|
|
Non-controlling |
|
|
Total |
|
|||||||||||
|
|
|
Shares |
|
|
Amount |
|
|
Capital |
|
|
Earnings |
|
|
(Loss) Income |
|
|
Equity |
|
|
Interest |
|
|
Equity |
|
||||||||
|
|
|
(In thousands) |
|
|||||||||||||||||||||||||||||
|
Balance, January 2, 2017 |
|
|
|
|
|
$ |
|
|
|
$ |
|
|
|
$ |
|
|
|
$ |
( |
) |
|
$ |
|
|
|
$ |
|
|
|
$ |
|
|
|
Net income |
|
|
— |
|
|
|
— |
|
|
|
— |
|
|
|
|
|
|
|
— |
|
|
|
|
|
|
|
|
|
|
|
|
|
|
Other comprehensive income |
|
|
— |
|
|
|
— |
|
|
|
— |
|
|
|
— |
|
|
|
|
|
|
|
|
|
|
|
— |
|
|
|
|
|
|
Purchase of non-controlling equity interest |
|
|
— |
|
|
|
— |
|
|
|
|
|
|
|
— |
|
|
|
— |
|
|
|
|
|
|
|
( |
) |
|
|
( |
) |
|
Exercise of stock options |
|
|
|
|
|
|
— |
|
|
|
|
|
|
|
— |
|
|
|
— |
|
|
|
|
|
|
|
— |
|
|
|
|
|
|
Issuance of common stock for performance-based restricted stock units |
|
|
|
|
|
|
|
|
|
|
( |
) |
|
|
— |
|
|
|
— |
|
|
|
— |
|
|
|
— |
|
|
|
— |
|
|
Issuance of common stock for restricted stock units |
|
|
|
|
|
|
|
|
|
|
( |
) |
|
|
— |
|
|
|
— |
|
|
|
— |
|
|
|
— |
|
|
|
— |
|
|
Stock-based compensation |
|
|
— |
|
|
|
— |
|
|
|
|
|
|
|
— |
|
|
|
— |
|
|
|
|
|
|
|
— |
|
|
|
|
|
|
Balance, January 1, 2018 |
|
|
|
|
|
$ |
|
|
|
$ |
|
|
|
$ |
|
|
|
$ |
|
|
|
$ |
|
|
|
$ |
— |
|
|
$ |
|
|
|
New revenue standard adjustment |
|
|
— |
|
|
|
— |
|
|
|
— |
|
|
|
|
|
|
|
— |
|
|
|
|
|
|
|
— |
|
|
|
|
|
|
Net income |
|
|
— |
|
|
|
— |
|
|
|
— |
|
|
|
|
|
|
|
— |
|
|
|
|
|
|
|
— |
|
|
|
|
|
|
Other comprehensive loss |
|
|
— |
|
|
|
— |
|
|
|
— |
|
|
|
— |
|
|
|
( |
) |
|
|
( |
) |
|
|
— |
|
|
|
( |
) |
|
Exercise of stock options |
|
|
|
|
|
|
— |
|
|
|
|
|
|
|
— |
|
|
|
— |
|
|
|
|
|
|
|
— |
|
|
|
|
|
|
Issuance of common stock for performance-based restricted stock units |
|
|
|
|
|
|
|
|
|
|
( |
) |
|
|
— |
|
|
|
— |
|
|
|
— |
|
|
|
— |
|
|
|
— |
|
|
Issuance of common stock for restricted stock units |
|
|
|
|
|
|
|
|
|
|
( |
) |
|
|
— |
|
|
|
— |
|
|
|
— |
|
|
|
— |
|
|
|
— |
|
|
Stock-based compensation |
|
|
— |
|
|
|
— |
|
|
|
|
|
|
|
— |
|
|
|
— |
|
|
|
|
|
|
|
— |
|
|
|
|
|
|
Balance, December 31, 2018 |
|
|
|
|
|
$ |
|
|
|
$ |
|
|
|
$ |
|
|
|
$ |
( |
) |
|
$ |
|
|
|
$ |
— |
|
|
$ |
|
|
|
Net income |
|
|
— |
|
|
|
— |
|
|
|
— |
|
|
|
|
|
|
|
— |
|
|
|
|
|
|
|
— |
|
|
|
|
|
|
Other comprehensive loss |
|
|
— |
|
|
|
— |
|
|
|
— |
|
|
|
— |
|
|
|
( |
) |
|
|
( |
) |
|
|
— |
|
|
|
( |
) |
|
Redemption of convertible notes, net |
|
|
— |
|
|
|
— |
|
|
|
( |
) |
|
|
— |
|
|
|
— |
|
|
|
( |
) |
|
|
— |
|
|
|
( |
) |
|
Issuance of common stock for performance-based restricted stock units |
|
|
|
|
|
|
|
|
|
|
( |
) |
|
|
— |
|
|
|
— |
|
|
|
— |
|
|
|
— |
|
|
|
— |
|
|
Issuance of common stock for restricted stock units |
|
|
|
|
|
|
|
|
|
|
( |
) |
|
|
— |
|
|
|
— |
|
|
|
— |
|
|
|
— |
|
|
|
— |
|
|
Stock-based compensation |
|
|
— |
|
|
|
— |
|
|
|
|
|
|
|
— |
|
|
|
— |
|
|
|
|
|
|
|
— |
|
|
|
|
|
|
Balance, December 30, 2019 |
|
|
|
|
|
$ |
|
|
|
$ |
|
|
|
$ |
|
|
|
$ |
( |
) |
|
$ |
|
|
|
$ |
— |
|
|
$ |
|
|
See accompanying notes to consolidated financial statements.
61
TTM TECHNOLOGIES, INC.
Consolidated Statements of Cash Flows
|
|
|
For the Year Ended |
|
|||||||||
|
|
|
December 30, 2019 |
|
|
December 31, 2018 |
|
|
January 1, 2018 |
|
|||
|
|
|
(In thousands) |
|
|||||||||
|
Cash flows from operating activities: |
|
|
|
|
|
|
|
|
|
|
|
|
|
Net income |
|
$ |
|
|
|
$ |
|
|
|
$ |
|
|
|
Adjustments to reconcile net income to net cash provided by operating activities: |
|
|
|
|
|
|
|
|
|
|
|
|
|
Depreciation of property, plant and equipment |
|
|
|
|
|
|
|
|
|
|
|
|
|
Amortization of definite-lived intangible assets |
|
|
|
|
|
|
|
|
|
|
|
|
|
Amortization of debt discount and issuance costs |
|
|
|
|
|
|
|
|
|
|
|
|
|
Deferred income taxes |
|
|
( |
) |
|
|
( |
) |
|
|
( |
) |
|
Stock-based compensation |
|
|
|
|
|
|
|
|
|
|
|
|
|
Loss on extinguishment of debt |
|
|
— |
|
|
|
— |
|
|
|
|
|
|
Other |
|
|
( |
) |
|
|
( |
) |
|
|
|
|
|
Changes in operating assets and liabilities, net of acquisition: |
|
|
|
|
|
|
|
|
|
|
|
|
|
Accounts receivable, net |
|
|
|
|
|
|
|
|
|
|
( |
) |
|
Contract assets |
|
|
( |
) |
|
|
( |
) |
|
|
— |
|
|
Inventories |
|
|
( |
) |
|
|
|
|
|
|
( |
) |
|
Prepaid expenses and other current assets |
|
|
|
|
|
|
|
|
|
|
( |
) |
|
Accounts payable |
|
|
|
|
|
|
( |
) |
|
|
|
|
|
Contract liabilities |
|
|
|
|
|
|
( |
) |
|
|
— |
|
|
Accrued salaries, wages and benefits and other current liabilities |
|
|
( |
) |
|
|
( |
) |
|
|
|
|
|
Net cash provided by operating activities |
|
|
|
|
|
|
|
|
|
|
|
|
|
Cash flows from investing activities: |
|
|
|
|
|
|
|
|
|
|
|
|
|
Acquisition of Anaren, net of cash acquired |
|
|
— |
|
|
|
( |
) |
|
|
— |
|
|
Purchase of property, plant and equipment and other assets |
|
|
( |
) |
|
|
( |
) |
|
|
( |
) |
|
Proceeds from sale of property, plant and equipment and assets held for sale |
|
|
|
|
|
|
|
|
|
|
|
|
|
Net cash used in investing activities |
|
|
( |
) |
|
|
( |
) |
|
|
( |
) |
|
Cash flows from financing activities: |
|
|
|
|
|
|
|
|
|
|
|
|
|
Proceeds from long-term debt borrowings |
|
|
— |
|
|
|
|
|
|
|
|
|
|
Repayment of long-term debt borrowing |
|
|
( |
) |
|
|
( |
) |
|
|
( |
) |
|
Repayment of assumed long-term debt in acquisition |
|
|
— |
|
|
|
( |
) |
|
|
— |
|
|
Proceeds (repayment) from borrowings of revolving loan |
|
|
— |
|
|
|
|
|
|
|
( |
) |
|
Payment of debt issuance costs |
|
|
( |
) |
|
|
( |
) |
|
|
( |
) |
|
Payment of original issue discount |
|
|
— |
|
|
|
( |
) |
|
|
( |
) |
|
Proceeds from exercise of stock options |
|
|
— |
|
|
|
|
|
|
|
|
|
|
Payment for purchase of non-controlling interest |
|
|
— |
|
|
|
— |
|
|
|
( |
) |
|
Redemption of convertible notes |
|
|
( |
) |
|
|
— |
|
|
|
( |
) |
|
Net cash (used in) provided by financing activities |
|
|
( |
) |
|
|
|
|
|
|
( |
) |
|
Effect of foreign currency exchange rates on cash and cash equivalents |
|
|
( |
) |
|
|
( |
) |
|
|
|
|
|
Net increase (decrease) in cash and cash equivalents |
|
|
|
|
|
|
( |
) |
|
|
|
|
|
Cash and cash equivalents at beginning of year |
|
|
|
|
|
|
|
|
|
|
|
|
|
Cash and cash equivalents at end of year |
|
$ |
|
|
|
$ |
|
|
|
$ |
|
|
|
Supplemental cash flow information: |
|
|
|
|
|
|
|
|
|
|
|
|
|
Cash paid, net for interest |
|
$ |
|
|
|
$ |
|
|
|
$ |
|
|
|
Cash paid, net for income taxes |
|
|
|
|
|
|
|
|
|
|
|
|
|
Supplemental disclosure of noncash investing activities: |
|
|
|
|
|
|
|
|
|
|
|
|
|
Property, plant and equipment recorded in accounts payable |
|
$ |
|
|
|
$ |
|
|
|
$ |
|
|
See accompanying notes to consolidated financial statements.
62
TTM TECHNOLOGIES, INC.
Notes to Consolidated Financial Statements
(Dollars and shares in thousands, except per share data)
|
(1) |
Nature of Operations and Summary of Significant Accounting Policies |
Nature of Operations
TTM Technologies, Inc. (the Company or TTM) is a leading global printed circuit board (PCB) manufacturer, focusing on quick-turn and volume production of technologically complex PCBs, backplane assemblies and electro-mechanical solutions (E-M Solutions) as well as a global designer and manufacturer of radio-frequency (RF) and microwave components and assemblies. The Company provides time-to-market and volume production of advanced technology products and offers a one-stop design, engineering and manufacturing solution to customers. This one-stop design and manufacturing solution enables the Company to align technology developments with the diverse needs of the Company’s customers and to enable them to reduce the time required to develop new products and bring them to market.
The Company serves a diversified customer base in various markets throughout the world, including aerospace and defense, automotive components, smartphones and other mobile devices, high-end computing, medical, industrial and instrumentation related products, as well as networking/communications infrastructure products. The Company’s customers include both original equipment manufacturers (OEMs) and electronic manufacturing services (EMS) providers.
The Company operates on a 52 or 53 week year ending on the Monday nearest December 31. Fiscal 2019, 2018, and 2017 were 52 weeks ended on December 30, 2019, December 31, 2018 and January 1, 2018, respectively. All references to years relate to fiscal years unless otherwise noted.
Reclassifications
Certain amounts in the prior period financial statements have been reclassified to conform to the presentation of the current period financial statements. These reclassifications had no effect on the previously reported net income. An adjustment has been made to combine the statutory surplus reserve with retained earnings on the consolidated statements of stockholders’ equity.
Use of Estimates
The preparation of financial statements in conformity with accounting principles generally accepted in the United States of America (U.S. GAAP) requires management to make estimates and assumptions that affect the reported amounts of assets and liabilities and disclosure of contingent assets and liabilities at the date of the financial statements and the reported amount of revenues and expenses during the reporting period. Such estimates include the sales return reserve; accounts receivable; inventories; goodwill; intangible assets and other long-lived assets; product warranty liabilities; legal contingencies; income taxes; pension obligations; and fair values of financial instruments. These estimates and assumptions are based on management’s best estimates and judgment. Management evaluates its estimates and assumptions on an ongoing basis using historical experience and other factors, including the economic environment, which management believes to be reasonable under the circumstances. Management adjusts such estimates and assumptions when facts and circumstances dictate. The actual results we experienced may differ materially and adversely from our estimates. To the extent there are material differences between the estimates and actual results, our future result of operations will be affected.
Principles of Consolidation
The consolidated financial statements include the accounts of TTM and its subsidiaries. All intercompany accounts and transactions have been eliminated in consolidation.
Foreign Currency Translation and Transactions
The functional currency of certain of the Company’s subsidiaries is the Chinese Renminbi (RMB). Accordingly, assets and liabilities are translated into U.S. dollars using period-end exchange rates. Sales and expenses are translated at the average exchange rates in effect during the period. The resulting translation gains or losses are recorded as a component of accumulated other comprehensive (loss) income in the consolidated statement of stockholders’ equity and the consolidated statement of comprehensive income. Net gains and losses resulting from foreign currency remeasurements and transactions are included in income as a component of other, net in the consolidated statements of operations and totaled $
Cash Equivalents
The Company considers highly liquid investments with insignificant interest rate risk and original maturities to the Company of three months or less to be cash equivalents. Cash equivalents consist primarily of interest-bearing bank accounts.
The Company considers highly liquid investments with an effective maturity to the Company of more than three months and less than one year to be short-term investments.
63
TTM TECHNOLOGIES, INC.
Notes to Consolidated Financial Statements — (Continued)
Accounts Receivable and Allowance for Doubtful Accounts
Accounts receivable are reflected at estimated net realizable value, do not bear interest and do not generally require collateral. The Company performs credit evaluations of its customers and adjusts credit limits based upon payment history and the customer’s current creditworthiness. The Company maintains an allowance for doubtful accounts based upon a variety of factors. The Company reviews all open accounts and provides specific reserves for customer collection issues when it believes the loss is probable, considering such factors as the length of time receivables are past due, the financial condition of the customer, and historical experience. The Company also records a reserve for all customers, excluding those that have been specifically reserved for, based upon evaluation of historical losses.
The Company’s allowance for doubtful accounts was $
Inventories
Inventories are stated at the lower of cost (determined on a first-in, first-out and weighted average basis) or net realizable value. Assessments to value the inventory at the lower of the actual cost to purchase and / or manufacture the inventory, or net realizable value of the inventory, are based upon assumptions about future demand and market conditions. As a result of the Company’s assessments, when the net realizable value of inventory is less than the carrying value, the inventory cost is written down to the net realizable value and the write down is recorded as a charge to cost of goods sold.
Property, Plant and Equipment, Net
Property, plant and equipment are recorded at cost. Depreciation expense is computed using the straight-line method over the estimated useful lives of the assets. Assets recorded under leasehold improvements are amortized using the straight-line method over the lesser of their useful lives or the related lease term.
|
Land use rights |
|
|
|
Buildings and improvements |
|
|
|
Machinery and equipment |
|
|
|
Furniture and fixtures |
|
|
Upon retirement or other disposition of property, plant and equipment, the cost and related accumulated depreciation are removed from the accounts. The resulting gain or loss is included in the determination of operating income in the period incurred. Depreciation and amortization expense on property, plant and equipment was $
The Company capitalizes interest on borrowings during the active construction period of major capital projects. Capitalized interest is amortized over the average useful lives of such assets, which primarily consist of buildings and machinery and equipment. The Company capitalized interest costs of $
Major renewals and betterments are capitalized and depreciated over their estimated useful lives while minor expenditures for maintenance and repairs are included in operating income as incurred.
Goodwill
Goodwill represents the excess of purchase price of an acquisition over the fair value of net assets acquired. Goodwill is not amortized but instead is assessed for impairment, at a reporting unit level, annually and when events and circumstances warrant an evaluation. In making this assessment, management relies on a number of factors, including expected future operating results, business plans, economic projections, anticipated future cash flows, business trends and declines in the Company’s market capitalization.
The Company has
64
TTM TECHNOLOGIES, INC.
Notes to Consolidated Financial Statements — (Continued)
fourth quarter of 2019, the Company performed its annual impairment test qualitatively and concluded that goodwill was not impaired. See Note 5 for further details.
Intangible Assets
Intangible assets include customer relationships and technology, which are being amortized over their estimated useful lives on a straight-line basis. The estimated useful lives of such intangibles range from
Impairment of Long-lived Assets
Long-lived tangible assets, including property, plant and equipment, assets held for sale, and definite-lived intangible assets, are reviewed for impairment whenever events or changes in circumstances indicate that the carrying value of the asset or asset groups may not be recoverable. The Company regularly evaluates whether events or circumstances have occurred that indicate possible impairment and relies on a number of factors, including expected future operating results, business plans, economic projections, and anticipated future cash flows. The Company uses an estimate of the future undiscounted net cash flows of the related asset or asset group over the remaining life in measuring whether the assets are recoverable. Measurement of the amount of impairment, if any, is based upon the difference between the asset’s carrying value and estimated fair value. Fair value is determined through various valuation techniques, including cost-based, market and income approaches as considered necessary.
The Company classifies assets to be sold as assets held for sale when (i) Company management has approved and commits to a plan to sell the asset; (ii) the asset is available for immediate sale in its present condition and is ready for sale; (iii) an active program to locate a buyer and other actions required to sell the asset have been initiated; (iv) the sale of the asset is probable; (v) the asset is being actively marketed for sale at a price that is reasonable in relation to its current fair value; and (vi) it is unlikely that significant changes to the plan will be made or that the plan will be withdrawn. Assets classified as held for sale are recorded at the lower of the carrying amount or fair value less the cost to sell and are included as a component of prepaid expenses and other current assets in the consolidated balance sheets.
The Company classifies assets held for use when a decision to dispose of an asset or a business is made and the held for sale criteria are not met. Assets of the business are evaluated for recoverability in the following order: (i) assets other than goodwill, property and intangibles; (ii) property and intangibles subject to amortization; and (iii) goodwill. In evaluating the recoverability of property and intangible assets subject to amortization, in a held for use business, the carrying value is first compared to the sum of the undiscounted cash flows expected to result from the use and eventual disposition. If the carrying value exceeds the undiscounted expected cash flows, then a fair value analysis is performed. An impairment charge is recognized if the carrying value exceeds the fair value.
Leases
The Company adopted the new lease standard as of January 1, 2019 under the retrospective cumulative effect adjustment transition method. Therefore, the consolidated financial statements for the years ended December 31, 2018 and January 1, 2018 have not been adjusted and continued to be reported under previous U.S. GAAP guidance. As a result, beginning in the first quarter of 2019, the Company determines if an arrangement is a lease at inception. Operating leases are included in operating lease right-of-use (ROU) assets, and lease liabilities are included in other current liabilities and operating lease liabilities on the consolidated balance sheets.
ROU assets represent the Company’s right to use an underlying asset for the lease term and lease liabilities represent the Company’s obligation to make lease payments arising from the lease. Operating lease ROU assets and liabilities are recognized at commencement date based on the present value of lease payments over the lease term. As most of the Company’s leases do not provide an implicit rate, the Company uses its incremental borrowing rate based on the information available at the commencement date in determining the present value of lease payments. The operating lease ROU asset also includes any lease payments made and excludes lease incentives. Lease terms may include options to extend or terminate the lease when it is reasonably certain that the Company will exercise that option. Lease expense for lease payments is recognized on a straight-line basis over the lease term.
The Company has lease agreements with lease and non-lease components and accounts for the lease and non-lease components as a single lease component.
65
TTM TECHNOLOGIES, INC.
Notes to Consolidated Financial Statements — (Continued)
Revenue Recognition
The Company adopted the new revenue standard on January 2, 2018, using the cumulative effect transition method with adjustment to the opening balance of retained earnings at January 2, 2018 for all open contracts as of January 1, 2018. Therefore, comparative information has not been adjusted and continues to be reported under previous U.S. GAAP guidance for the consolidated statement of operations for the year ended January 1, 2018. The impact of the adoption of the new revenue standard on the Company’s statement of operations for the years ended December 30, 2019 and December 31, 2018 were an additional revenue of $
The Company derives revenues primarily from the sale of PCBs, custom electronic assemblies using customer-supplied engineering and design plans as well as the design and manufacture of RF and microwave components and assemblies. In the absence of a sales agreement, the Company’s standard terms and conditions apply. Revenue is recognized when control of the promised goods or services is transferred to the Company’s customers, in an amount that reflects the consideration to which it expects to be entitled in exchange for those goods or services. The Company applies a five-step approach as defined in the new standard in determining the amount and timing of revenue to be recognized: (1) identifying the contract with a customer; (2) identifying the performance obligations in the contract; (3) determining the transaction price; (4) allocating the transaction price to the performance obligations in the contract; and (5) recognizing revenue when the corresponding performance obligation is satisfied.
Revenue Streams
For PCBs and custom electronic assemblies, including pursuant to the Company’s long-term contracts related to the manufacture of components, assemblies and subsystems, orders for products generally correspond to the production schedules of the Company’s customers and are supported with firm purchase orders. The Company’s customers have continuous control of the work in progress and finished goods throughout the PCB and custom electronic assemblies manufacturing process, as these are built to customer specifications with no alternative use, and there is an enforceable right to payment for work performed to date. As a result, beginning in the first quarter of 2018, the Company began recognizing revenue over time based on the extent of progress towards completion of the performance obligation. Revenue recognized is based on the cost-to-cost method as it best depicts the transfer of control to the customer which takes place as we incur costs. Under the cost-to-cost measure of progress, the extent of progress toward completion is measured based on the ratio of costs incurred to date to the total estimated costs at completion of the performance obligation. Revenues are recorded proportionally as costs are incurred.
In addition, the Company manufactures components, assemblies, and subsystems which service its wireless communications customers. The Company recognizes revenue at a point in time upon transfer of control of the products to the customer. Point in time recognition was determined as the customer does not simultaneously receive or consume the benefits provided by the Company’s performance and the asset being manufactured has alternative uses to the Company.
Performance Obligations
Each distinct promise to transfer products is considered to be an identified performance obligation for which revenue is recognized upon transfer of control of the products to the customer. A contract’s transaction price is allocated to each distinct performance obligation and recognized as revenue when, or as, the performance obligation is satisfied. The majority of the Company's contracts have a single performance obligation as the promise to transfer the individual good or service is not separately identifiable from other promises in the contract and is, therefore, not distinct. As of December 30, 2019, the aggregate amount of the transaction price allocated to remaining performance obligations for the Company’s long-term contracts was $
66
TTM TECHNOLOGIES, INC.
Notes to Consolidated Financial Statements — (Continued)
Transaction Price
The Company provides customers a limited right of return for defective PCBs including components, subsystems and assemblies. Estimates of returns are treated as variable consideration for purposes of determining the transaction price. The Company accrues an estimate for sales returns and allowances progressively over time based on the extent of progress towards completion of the performance obligation using the Company’s judgment based on historical results and anticipated returns. To the extent actual experience varies from its historical experience, revisions to the sales returns and allowances accrual may be required. Sales returns and allowances are recorded as a reduction of revenue and included as a component of accrued expenses on the consolidated balance sheets. Shipping and handling fees and related freight costs and supplies associated with shipping products to customers are included as a component of cost of goods sold. Warranty-related services are not considered a separate performance obligation. Incremental warranty costs that are not related to sales returns are recorded in accrued expenses on the consolidated balance sheets and cost of goods sold on the consolidated statements of operations.
|
|
|
For the Year Ended |
|
|||||||||
|
|
|
December 30, |
|
|
December 31, |
|
|
January 1, |
|
|||
|
|
|
2019 |
|
|
2018 |
|
|
2018 |
|
|||
|
|
|
(In thousands) |
|
|||||||||
|
Balance at beginning of year |
|
$ |
|
|
|
$ |
|
|
|
$ |
|
|
|
Addition charged as a reduction of sales (1) |
|
|
|
|
|
|
|
|
|
|
|
|
|
Deductions |
|
|
( |
) |
|
|
( |
) |
|
|
( |
) |
|
Effect of foreign currency exchange rates |
|
|
|
|
|
|
( |
) |
|
|
|
|
|
Balance at end of year |
|
$ |
|
|
|
$ |
|
|
|
$ |
|
|
|
|
(1) |
|
Contract Balances
Accounts receivable represents the Company’s unconditional right to receive consideration from its customer. Payments are generally due within 90 days or less of invoicing and do not include a significant financing component. To date, there have been no material impairment losses on accounts receivable.
A contract asset is recognized when the Company has recognized revenue, but not issued an invoice for payment. Contract assets are classified as current assets and are transferred to receivables when the entitlement to payment becomes unconditional. The Company’s contract assets are generally converted to trade account receivables within
A contract liability is recognized when the Company has received payment in advance for the future transfer of goods or services. The Company’s contract liabilities are generally converted to revenue within
The Company has elected to account for shipping and handling activities as a fulfillment cost as permitted by the standard. All incremental customer contract acquisition costs are expensed as they are incurred as the amortization period of the asset that the Company otherwise would have recognized is one year or less in duration.
Disaggregated Revenue
Revenue from products and services transferred to customers over time and at a point in time accounted for
67
TTM TECHNOLOGIES, INC.
Notes to Consolidated Financial Statements — (Continued)
The following tables represent a disaggregation of revenue by principal end markets with the reportable segments:
|
|
|
For the Year Ended December 30, 2019 |
|
|
|||||||||
|
|
|
PCB |
|
|
E-M Solutions |
|
|
Total |
|
|
|||
|
End Markets |
|
(In thousands) |
|
|
|||||||||
|
Aerospace and Defense |
|
$ |
|
|
|
$ |
|
|
|
$ |
|
|
|
|
Automotive |
|
|
|
|
|
|
|
|
|
|
|
|
|
|
Cellular Phone |
|
|
|
|
|
|
— |
|
|
|
|
|
|
|
Computing/Storage/Peripherals |
|
|
|
|
|
|
|
|
|
|
|
|
|
|
Medical/Industrial/Instrumentation |
|
|
|
|
|
|
|
|
|
|
|
|
|
|
Networking/Communications |
|
|
|
|
|
|
|
|
|
|
|
|
|
|
Other |
|
|
|
|
|
|
( |
) |
|
|
|
|
|
|
Total |
|
$ |
|
|
|
$ |
|
|
|
$ |
|
|
|
|
|
|
For the Year Ended December 31, 2018 (1) |
|
|
|||||||||
|
|
|
PCB |
|
|
E-M Solutions |
|
|
Total |
|
|
|||
|
End Markets |
|
(In thousands) |
|
|
|||||||||
|
Aerospace and Defense |
|
$ |
|
|
|
$ |
|
|
|
$ |
|
|
|
|
Automotive |
|
|
|
|
|
|
|
|
|
|
|
|
|
|
Cellular Phone |
|
|
|
|
|
|
— |
|
|
|
|
|
|
|
Computing/Storage/Peripherals |
|
|
|
|
|
|
|
|
|
|
|
|
|
|
Medical/Industrial/Instrumentation |
|
|
|
|
|
|
|
|
|
|
|
|
|
|
Networking/Communications |
|
|
|
|
|
|
|
|
|
|
|
|
|
|
Other |
|
|
|
|
|
|
( |
) |
|
|
|
|
|
|
Total |
|
$ |
|
|
|
$ |
|
|
|
$ |
|
|
|
|
|
|
For the Year Ended January 1, 2018 (2) |
|
|
|||||||||
|
|
|
PCB |
|
|
E-M Solutions |
|
|
Total |
|
|
|||
|
End Markets |
|
(In thousands) |
|
|
|||||||||
|
Aerospace and Defense |
|
$ |
|
|
|
$ |
|
|
|
$ |
|
|
|
|
Automotive |
|
|
|
|
|
|
|
|
|
|
|
|
|
|
Cellular Phone |
|
|
|
|
|
|
— |
|
|
|
|
|
|
|
Computing/Storage/Peripherals |
|
|
|
|
|
|
|
|
|
|
|
|
|
|
Medical/Industrial/Instrumentation |
|
|
|
|
|
|
|
|
|
|
|
|
|
|
Networking/Communications |
|
|
|
|
|
|
|
|
|
|
|
|
|
|
Other |
|
|
|
|
|
|
|
|
|
|
|
|
|
|
Total |
|
$ |
|
|
|
$ |
|
|
|
$ |
|
|
|
|
(1) |
Amended for Anaren integration. |
|
(2) |
The Company adopted ASC Topic 606, Revenue from Contracts with Customers, under the modified retrospective method on January 2, 2018. Accordingly, the consolidated financial statements for the year ended January 1, 2018 have not been adjusted. |
Stock-Based Compensation
The Company recognizes stock-based compensation expense in its consolidated financial statements for its incentive compensation plan awards. The incentive compensation plan awards include performance-based restricted stock units, restricted stock units, and stock options. The associated compensation expense for all awards is based on the grant date fair value of the awards. For performance-based restricted stock units, compensation expense also includes management’s periodic assessment of annual financial performance goals to be achieved. Compensation expense for the incentive compensation plan awards is recognized on a straight line basis over the vesting period of the awards. The fair value of performance-based restricted stock units is estimated on the grant date using a Monte Carlo simulation model based on the underlying common stock closing price as of the date of grant, the expected term, stock price volatility, and risk-free interest rates. The fair value of restricted stock units is measured on the grant date based on the quoted closing market price of the Company’s common stock. The fair value of the stock options is estimated on the grant date using the Black-Scholes option pricing model based on the underlying common stock closing price as of the date of grant, the expected term, stock price volatility, and risk-free interest rates.
68
TTM TECHNOLOGIES, INC.
Notes to Consolidated Financial Statements — (Continued)
Income Taxes
Income taxes are accounted for under the asset and liability method. Deferred income tax assets or liabilities are recognized for the future tax consequences attributable to differences between the financial statement carrying amounts of assets and liabilities and their respective tax bases and operating loss and tax credit carryforwards. Deferred income tax assets and liabilities are measured using enacted tax rates expected to apply to taxable income in the years in which those temporary differences are expected to be settled or realized. The effect on deferred income tax assets and liabilities of a change in tax rates is recognized in income in the period that includes the enactment date. Deferred income tax assets are reviewed for recoverability, and the Company records a valuation allowance to reduce its deferred income tax assets when it is more likely than not that all or some portion of the deferred income tax assets will not be realized.
The Company has various foreign subsidiaries formed or acquired to conduct or support its business outside the United States. The Company expects its earnings attributable to foreign subsidiaries will be indefinitely reinvested except for our material Chinese and Canadian plants and the respective holding companies where a deferred tax liability has been recorded for foreign withholding and estimated federal/state tax impact. For those other companies with earnings currently being reinvested outside of the U.S., no deferred tax liabilities on undistributed earnings are recorded.
The Company recognizes the effect of income tax positions only if those positions are more likely than not to be sustained. Recognized income tax positions are measured at the largest amount that is greater than
Convertible Debt
The accounting standards for convertible debt instruments that may be fully or partially settled in cash upon conversion require the debt and equity components to be separately accounted for in a manner that reflects the Company’s nonconvertible borrowing rate when interest expense is recognized in subsequent periods. The amount recorded as debt is based on the fair value of the debt component as a standalone instrument, determined using an average interest rate for similar nonconvertible debt issued by entities with credit ratings comparable to the Company’s at the time of issuance. The difference between the debt recorded at inception and its principal amount is accreted to principal through interest expense during the estimated life of the note.
Value Added and Sales Tax Collected from Customers
As a part of the Company’s normal course of business, value added and sales taxes are collected from customers. Such taxes collected are remitted, in a timely manner, to the appropriate governmental tax authority on behalf of the customer. Value added and sales taxes are excluded from reported revenues and costs of goods sold presented in the consolidated statements of operations and comprehensive income.
Fair Value Measures
The Company measures at fair value certain of its financial and non-financial assets and liabilities by using a fair value hierarchy that prioritizes the inputs to valuation techniques used to measure fair value. Fair value is the price that would be received to sell an asset or paid to transfer a liability in an orderly transaction between market participants at the measurement date, essentially an exit price, based on the highest and best use of the asset or liability. The levels of the fair value hierarchy are:
Level 1 — Quoted market prices in active markets for identical assets or liabilities;
Level 2 — Significant other observable inputs (e.g., quoted prices for similar items in active markets, quoted prices for identical or similar items in markets that are not active, inputs other than quoted prices that are observable, such as interest rate and yield curves, and market-corroborated inputs); and
Level 3 — Unobservable inputs in which there is little or no market data, which require the reporting unit to develop its own assumptions.
Earnings Per Share
Basic earnings per common share excludes dilution and is computed by dividing net income attributable to TTM Technologies, Inc. stockholders by the weighted average number of common shares outstanding during the period. Diluted earnings per common share reflect the potential dilution that could occur if stock options, Convertible Senior Notes or other common stock equivalents were exercised or converted into common stock. The dilutive effect of stock options or other common stock equivalents is calculated using the treasury stock method, while the dilutive effect of Convertible Senior Notes is calculated using the if-converted method.
69
TTM TECHNOLOGIES, INC.
Notes to Consolidated Financial Statements — (Continued)
Comprehensive Income
Comprehensive income includes changes to equity accounts that were not the result of transactions with stockholders. Comprehensive income is comprised of net income, changes in the cumulative foreign currency translation adjustments, pension obligation adjustments, and realized and unrealized gains or losses on hedged derivative instruments.
Non-controlling Interest Holdings
Non-controlling interest consisted of a
Loss Contingencies
The Company establishes an accrual for an estimated loss contingency when it is both probable that an asset has been impaired or that a liability has been incurred and the amount of the loss can be reasonably estimated. Any legal fees expected to be incurred in connection with a contingency are expensed as incurred.
Accounting for Retirement Benefit Plans
The Company accounts for its retirement benefit plans and postretirement and postemployment benefit obligations in accordance with ASC Topic 715, Compensation—Retirement Benefits. ASC Topic 715 requires the Company to recognize the overfunded or underfunded status of a defined benefit plan, measured as the difference between the fair value of plan assets and the plan's benefit obligation, as an asset or liability in its consolidated balance sheets and to recognize changes to that funded status in the year in which the changes occur through accumulated other comprehensive loss. ASC Topic 715 also requires measurement of the funded status of a plan as of the Company's consolidated balance sheet dates.
Recently Adopted and Issued Accounting Standards
Recently Adopted Accounting Standards
In February 2016, the Financial Accounting Standards Board (FASB) issued ASU 2016-02, Leases (Topic 842) which supersedes the existing lease recognition requirements in the current accounting standard for leases. The core principal of the new standard is that an entity should recognize ROU assets and lease liabilities arising from a lease for both financing and operating leases, along with additional qualitative and quantitative disclosures.
In July 2018, the FASB issued ASU 2018-11, Leases (Topic 842): Targeted Improvements. ASU 2018-11 provides additional guidance to Topic 842 including providing preparers an additional optional retrospective adoption method which allows entities to initially apply the new leases standard at the adoption date and recognize a cumulative effect adjustment to the opening balance of retained earnings. ASU 2018-11 also provides lessors a practical expedient to not separate lease from non-lease components, in certain situations.
The Company adopted the new lease standard as of January 1, 2019 and utilized the retrospective cumulative effect adjustment transition method with a cumulative effect adjustment being recorded as of the adoption date. Therefore, comparative information has not been adjusted and continues to be reported under previous U.S. GAAP guidance for the consolidated balance sheet as of December 31, 2018 and the consolidated statements of operations for the years ended December 31, 2018 and January 1, 2018. The Company implemented internal controls and key system functionality to enable the preparation of financial information on adoption. The Company elected certain available practical expedients including the package of practical expedients permitted under the transition guidance within the new standard, which among other things, allowed the Company to carry forward the historical lease classification. Additionally, the Company elected an accounting policy to not record ROU assets and lease liabilities for leases with an initial term of twelve months or less on its consolidated balance sheet.
70
TTM TECHNOLOGIES, INC.
Notes to Consolidated Financial Statements — (Continued)
The cumulative effect of the changes made to the Company’s January 1, 2019 consolidated balance sheet for the adoption of the new lease standard was as follows:
|
|
|
Balance as of December 31, 2018 |
|
|
New Lease Standard Adjustment |
|
|
Balance as of January 1, 2019 |
|
|||
|
|
|
(In thousands) |
|
|||||||||
|
Assets |
|
|
|
|
|
|
|
|
|
|
|
|
|
Operating lease right-of-use assets |
|
$ |
— |
|
|
$ |
|
|
|
$ |
|
|
|
Deposits and other non-current assets |
|
|
|
|
|
|
( |
) |
|
|
|
|
|
|
|
|
|
|
|
|
|
|
|
|
|
|
|
Liabilities |
|
|
|
|
|
|
|
|
|
|
|
|
|
Other current liabilities |
|
|
|
|
|
|
|
|
|
|
|
|
|
Operating lease liabilities |
|
|
— |
|
|
|
|
|
|
|
|
|
|
Other long-term liabilities |
|
|
|
|
|
|
( |
) |
|
|
|
|
The adoption of the new accounting guidance did not have a material impact to the consolidated statement of operations or the consolidated statement of cash flows for the year ended December 30, 2019. See Note 2 for further details.
In June 2018, the FASB issued ASU 2018-07, Compensation-Stock Compensation (Topic 718): Improvements to Nonemployee Share-based Payments. This ASU expands the scope of Topic 718 to include share-based payment transactions for acquiring goods and services from nonemployees. The effective date for the standard is for interim periods in fiscal years beginning after December 15, 2018, with early adoption permitted, but no earlier than the Company's adoption date of Topic 606. The new guidance is required to be applied retrospectively with the cumulative effect recognized at the date of initial application. The Company adopted ASU 2018-07 on January 1, 2019. The adoption did not have a material impact on the consolidated financial statements or related disclosures.
In August 2017, the FASB issued ASU 2017-12, Derivatives and Hedging (Topic 815): Targeted Improvements to Accounting for Hedging Activities. This ASU amends and simplifies existing guidance in order to allow companies to more accurately present the economic effects of risk management activities in the financial statements. ASU 2017-12 also amends the guidance surrounding the recognition of the value of hedged instruments to include the entire change in value, rather than just the effective portion, in other comprehensive income and recognized in earnings at the same time that the hedged item affects earnings for cash flow and net investment hedges. The Company adopted ASU 2017-12 on January 1, 2019. The adoption did not have a material impact on the consolidated financial statements or related disclosures.
Recently Issued Accounting Standards Not Yet Adopted
In December 2019, the FASB issued ASU 2019-12, Income Taxes (Topic 740): Simplifying the Accounting for Income Taxes, which is intended to simplify various aspects related to accounting for income taxes. ASU 2019-12 removes certain exceptions to the general principles in Topic 740 and also clarifies and amends existing guidance to improve consistent application. The guidance is effective for fiscal years ending after December 15, 2020, including interim periods within those fiscal years. Early adoption is permitted. The Company has evaluated the new guidance to determine the impact it may have on its consolidated financial statements and related disclosures and the impact is not expected to be material.
In August 2018, the FASB issued ASU 2018-14, Compensation—Retirement Benefits—Defined Benefit Plans—General (Subtopic 715-20)—Disclosure Framework—Changes to the Disclosure Requirements for Defined Benefit Plans. The amendments in this update change the disclosure requirements for employers that sponsor defined benefit pension and/or other postretirement benefit plans. It eliminates requirements for certain disclosures that are no longer considered cost beneficial and requires new disclosures that the FASB considers pertinent. The guidance is effective for fiscal years ending after December 15, 2020. Early adoption is permitted. The Company does not anticipate the adoption will have a material impact on the consolidated financial statements and related disclosures.
In June 2016, the FASB issued ASU 2016-13, Financial Instruments-Credit Losses (Topic 326): Measurement of Credit Losses on Financial Instruments. ASU 2016-13 seeks to provide financial statement users with more decision-useful information about the expected credit losses on financial instruments, including trade receivables, and other commitments to extend credit held by a reporting entity at each reporting date. The amendments require an entity to replace the incurred loss impairment methodology in current U.S. GAAP with a methodology that reflects current expected credit losses and requires consideration of a broader range of reasonable and supportable information to inform credit loss estimates. In April 2019, the FASB issued ASU 2019-04, Codification Improvements to Topic 326, Financial Instruments—Credit Losses, Topic 815, Derivatives and Hedging, and Topic 825, Financial Instruments, which clarifies the accounting for transfers between classifications of debt securities and clarifies that entities should include expected recoveries on financial assets in the calculation of the current expected credit loss allowance. In addition, renewal options that are not unconditionally cancellable should be considered in the determination of expected credit losses. In May 2019, the FASB issued ASU 2019-05, Financial Instruments—Credit Losses (Topic 326): Targeted Transition Relief, which amends ASU
71
TTM TECHNOLOGIES, INC.
Notes to Consolidated Financial Statements — (Continued)
2016-13 to allow companies, upon adoption, to elect the fair value option on financial instruments that were previously recorded at amortized cost if they meet certain criteria. In November 2019, the FASB issued ASU 2019-11, Codification Improvements to Topic 326, Financial Instruments—Credit Losses, which clarifies the treatment of expected recoveries for amounts previously written off on purchased receivables, provides transition relief for troubled debt restructurings, and allows for certain disclosure simplifications of accrued interest. All of these ASUs are effective for fiscal years beginning after December 15, 2019, including interim periods within those fiscal years. Early adoption is permitted. The Company has evaluated the new guidance to determine the impact it may have on its consolidated financial statements and related disclosures and the impact is not expected to be material.
|
(2) |
Leases |
The Company leases some of its manufacturing and assembly plants, sales offices and equipment under non-cancellable operating leases that expire at various dates through 2049. The majority of the Company’s lease arrangements are comprised of fixed payments and certain leases consist of variable payments based on equipment usage. These variable payments are not included in the measurement of the ROU asset or lease liability due to uncertainty of the payment amount and are recorded as lease expense in the period incurred. Certain leases contain renewal provisions at the Company’s option. Most of the leases require the Company to pay for certain other costs such as property taxes and maintenance. Certain leases also contain rent escalation clauses (step rents) that require additional rental amounts in the later years of the term. Rent expense for leases with step rents is recognized on a straight-line basis over the minimum lease term. The lease agreements do not contain any material residual value guarantees or material restrictive covenants.
The components of lease expense were as follows:
|
|
For the Year Ended December 30, 2019 |
|
|
|
|
(In thousands) |
|
|
|
Operating lease cost |
$ |
|
|
|
Variable lease cost |
|
|
|
|
Short-term lease cost |
|
|
|
Supplemental cash flow information related to leases was as follows:
|
|
For the Year Ended December 30, 2019 |
|
|
|
|
(In thousands) |
|
|
|
Cash paid for amounts included in the measurement of lease liabilities: |
|
|
|
|
Operating cash flows from operating leases |
$ |
|
|
|
Right-of-use assets obtained in exchange for new lease obligations: |
|
|
|
|
Operating leases |
|
|
|
Supplemental balance sheet information related to leases was as follows:
|
|
As of December 30, 2019 |
|
|
|
|
(In thousands) |
|
|
|
Operating lease right-of-use assets |
$ |
|
|
|
Other current liabilities |
|
|
|
|
Operating lease liabilities |
|
|
|
|
Total operating lease liabilities |
$ |
|
|
|
Weighted average remaining lease term |
|
|
|
|
Weighted average discount rate |
|
|
% |
72
TTM TECHNOLOGIES, INC.
Notes to Consolidated Financial Statements — (Continued)
Maturities of operating lease liabilities were as follows (1):
|
|
|
(In thousands) |
|
|
|
Less than one year |
|
$ |
|
|
|
1 - 2 years |
|
|
|
|
|
2 - 3 years |
|
|
|
|
|
3 - 4 years |
|
|
|
|
|
4 - 5 years |
|
|
|
|
|
Thereafter |
|
|
|
|
|
Total lease payments |
|
|
|
|
|
Less imputed interest |
|
|
( |
) |
|
Total |
|
$ |
|
|
|
|
(1) |
Excludes $ |
Operating Leases Pre-Topic 842 Adoption
The following is a schedule of future minimum lease payments as of December 31, 2018:
|
|
|
Operating Leases |
|
|
|
|
|
(In thousands) |
|
|
|
2019 |
|
$ |
|
|
|
2020 |
|
|
|
|
|
2021 |
|
|
|
|
|
2022 |
|
|
|
|
|
2023 |
|
|
|
|
|
Thereafter |
|
|
|
|
|
Total minimum lease payments |
|
$ |
|
|
Total rent expense for the years ended December 31, 2018 and January 1, 2018 was approximately $
|
(3) |
Restructuring Charges |
The Company periodically incurs restructuring charges as part of the integration process of recent acquisitions and to realign its operations with anticipated market demand. Following the acquisition of Anaren on
The below table summarizes such restructuring costs by reportable segment for the years ended December 30, 2019, December 31, 2018 and January 1, 2018:
|
|
|
For the Year Ended |
|
|||||||||||||||||||||||||||||||||
|
|
|
December 30, 2019 |
|
|
December 31, 2018 |
|
|
January 1, 2018 |
|
|||||||||||||||||||||||||||
|
|
|
Employee Separation/ Severance |
|
|
Contract Termination and Other Costs |
|
|
Total |
|
|
Employee Separation/ Severance |
|
|
Contract Termination and Other Costs |
|
|
Total |
|
|
Employee Separation/ Severance |
|
|
Contract Termination and Other Costs |
|
|
Total |
|
|||||||||
|
|
|
(In thousands) |
|
|||||||||||||||||||||||||||||||||
|
Reportable Segment: |
|
|
|
|
|
|
|
|
|
|
|
|
|
|
|
|
|
|
|
|
|
|
|
|
|
|
|
|
|
|
|
|
|
|
|
|
|
PCB |
|
$ |
|
|
|
$ |
|
|
|
$ |
|
|
|
$ |
|
|
|
$ |
— |
|
|
$ |
|
|
|
$ |
|
|
|
$ |
|
|
|
$ |
|
|
|
E-M Solutions |
|
|
— |
|
|
|
— |
|
|
|
— |
|
|
|
— |
|
|
|
— |
|
|
|
— |
|
|
|
— |
|
|
|
|
|
|
|
|
|
|
Corporate |
|
|
|
|
|
|
|
|
|
|
|
|
|
|
|
|
|
|
|
|
|
|
|
|
|
|
|
|
|
|
|
|
|
|
|
|
|
|
|
$ |
|
|
|
$ |
|
|
|
$ |
|
|
|
$ |
|
|
|
$ |
|
|
|
$ |
|
|
|
$ |
|
|
|
$ |
|
|
|
$ |
|
|
73
TTM TECHNOLOGIES, INC.
Notes to Consolidated Financial Statements — (Continued)
Accrued restructuring costs are included as a component of other current liabilities in the consolidated balance sheets.
|
|
|
Employee Separation/ Severance |
|
|
Contract Termination and Other Costs |
|
|
Total |
|
|||
|
|
|
(In thousands) |
|
|||||||||
|
Accrued as of January 1, 2018 |
|
$ |
— |
|
|
$ |
|
|
|
$ |
|
|
|
Charged to expense |
|
|
|
|
|
|
|
|
|
|
|
|
|
Amount paid |
|
|
( |
) |
|
|
( |
) |
|
|
( |
) |
|
Accrued as of December 31, 2018 |
|
$ |
|
|
|
$ |
|
|
|
$ |
|
|
|
Charged to expense |
|
|
|
|
|
|
|
|
|
|
|
|
|
Amount paid |
|
|
( |
) |
|
|
( |
) |
|
|
( |
) |
|
Accrued as of December 30, 2019 |
|
$ |
|
|
|
$ |
|
|
|
$ |
|
|
|
(4) |
Composition of Certain Consolidated Financial Statement Captions |
|
|
|
As of |
|
|||||
|
|
|
December 30, 2019 |
|
|
December 31, 2018 |
|
||
|
|
|
(In thousands) |
|
|||||
|
Inventories: |
|
|
|
|
|
|
|
|
|
Raw materials |
|
$ |
|
|
|
$ |
|
|
|
Work-in-process |
|
|
|
|
|
|
|
|
|
Finished goods |
|
|
|
|
|
|
|
|
|
|
|
$ |
|
|
|
$ |
|
|
|
Property, plant and equipment, net: |
|
|
|
|
|
|
|
|
|
Land and land use rights |
|
$ |
|
|
|
$ |
|
|
|
Buildings and improvements |
|
|
|
|
|
|
|
|
|
Machinery and equipment |
|
|
|
|
|
|
|
|
|
Construction-in-progress, furniture and fixtures and other |
|
|
|
|
|
|
|
|
|
|
|
|
|
|
|
|
|
|
|
Less: Accumulated depreciation |
|
|
( |
) |
|
|
( |
) |
|
|
|
$ |
|
|
|
$ |
|
|
|
Other current liabilities: |
|
|
|
|
|
|
|
|
|
Sales returns and allowances |
|
$ |
|
|
|
$ |
|
|
|
Income taxes payable |
|
|
|
|
|
|
|
|
|
Interest |
|
|
|
|
|
|
|
|
|
Restructuring |
|
|
|
|
|
|
|
|
|
Other |
|
|
|
|
|
|
|
|
|
|
|
$ |
|
|
|
$ |
|
|
74
TTM TECHNOLOGIES, INC.
Notes to Consolidated Financial Statements — (Continued)
|
(5) |
Goodwill |
As of December 30, 2019 and December 31, 2018, goodwill was as follows:
|
|
|
Total |
|
|
|
|
|
(In thousands) |
|
|
|
Balance as of January 1, 2018 |
|
|
|
|
|
Goodwill |
|
|
|
|
|
Accumulated impairment losses |
|
|
( |
) |
|
|
|
|
|
|
|
Goodwill recognized during the year |
|
|
|
|
|
Balance as of December 31, 2018 |
|
|
|
|
|
Goodwill |
|
|
|
|
|
Accumulated impairment losses |
|
|
( |
) |
|
|
|
|
|
|
|
Goodwill recognized during the year |
|
|
|
|
|
Balance as of December 30, 2019 |
|
|
|
|
|
Goodwill |
|
|
|
|
|
Accumulated impairment losses |
|
|
( |
) |
|
|
|
$ |
|
|
Goodwill balances include foreign currency translation adjustments related to foreign subsidiaries with functional currencies other than the U.S. Dollar. All of the Company’s goodwill is included as a component of the PCB reportable segment.
On November 14, 2019, the Company acquired substantially all the assets of i3 Electronics, Inc. in order to strengthen its advanced technology PCB capabilities and IP portfolio for emerging applications in the aerospace and defense end market and for high end commercial customers. The net assets acquired consists of property, plant, and equipment, customer relationships, and technology. Goodwill is primarily attributable to the benefits the Company expects to derive from enhancing the Company’s capabilities and credentials as a global technology leader for PCB product solutions and RF components as well as the acquired workforce. Goodwill is expected to be deductible for tax purposes because the acquisition was legally structured as an asset acquisition but accounted for as business combinations under FASB ASC Topic 805, Business Combinations. During the year ended December 30, 2019, the expenses incurred by the Company related to this acquisition were immaterial and are included within general and administrative expenses in the consolidated statements of operations. Revenues and earnings related to this acquisition were not material.
The Company evaluates its goodwill on an annual basis during its fourth fiscal quarter and at other times when events or changes in circumstances — such as significant adverse changes in the business climate or operating results or changes in management strategy, coupled with a decline in the market price of its stock and market capitalization — indicate that there may be a potential impairment. During the third fiscal quarter, the Company’s Communications and Computing and Automotive and Medical/Industrial/Instrumentation reporting units had lower than anticipated results and continued declines in sales. The Company considered these factors to be indicators of potential impairment requiring the Company to test the related goodwill of $
Fair value is typically estimated using a DCF analysis which requires the Company to estimate the future cash flows as well as to select a risk-adjusted discount rate to measure the present value of the anticipated cash flows. When determining future cash flow estimates, the Company considers historical results adjusted to reflect current and anticipated future operating conditions. The Company estimates cash flows for a reporting unit over a discrete period and a terminal period (considering expected long-term growth rates and trends).
75
TTM TECHNOLOGIES, INC.
Notes to Consolidated Financial Statements — (Continued)
Based on its analysis, the Company estimates that the fair value of the Communications and Computing and Automotive and Medical/Industrial/Instrumentation reporting units exceeded its respective carrying value by
In the fourth quarter of 2019, the Company performed its annual goodwill impairment test qualitatively and concluded that it was more likely than not that there was no impairment to goodwill.
|
(6) |
Definite-lived Intangibles |
As of December 30, 2019 and December 31, 2018, the components of definite-lived intangibles were as follows:
|
|
|
Gross Amount |
|
|
Accumulated Amortization |
|
|
Net Carrying Amount |
|
|
Weighted Average Amortization Period |
|
||||
|
|
|
(In thousands) |
|
|
(In years) |
|
||||||||||
|
December 30, 2019 |
|
|
|
|
|
|
|
|
|
|
|
|
|
|
|
|
|
Customer relationships |
|
$ |
|
|
|
$ |
( |
) |
|
$ |
|
|
|
|
|
|
|
Technology |
|
|
|
|
|
|
( |
) |
|
|
|
|
|
|
|
|
|
Acquired intangibles from current year acquisition |
|
|
|
|
|
|
|
|
|
|
|
|
|
|
|
|
|
Customer relationships |
|
|
|
|
|
|
( |
) |
|
|
|
|
|
|
|
|
|
Technology |
|
|
|
|
|
|
( |
) |
|
|
|
|
|
|
|
|
|
|
|
$ |
|
|
|
$ |
( |
) |
|
$ |
|
|
|
|
|
|
|
|
|
|
|
|
|
|
|
|
|
|
|
|
|
|
|
|
|
December 31, 2018 |
|
|
|
|
|
|
|
|
|
|
|
|
|
|
|
|
|
Customer relationships |
|
$ |
|
|
|
$ |
( |
) |
|
$ |
|
|
|
|
|
|
|
Technology |
|
|
|
|
|
|
( |
) |
|
|
— |
|
|
|
|
|
|
Acquired intangibles from current year acquisition |
|
|
|
|
|
|
|
|
|
|
|
|
|
|
|
|
|
Customer relationships |
|
|
|
|
|
|
( |
) |
|
|
|
|
|
|
|
|
|
Developed technology |
|
|
|
|
|
|
( |
) |
|
|
|
|
|
|
|
|
|
Backlog |
|
|
|
|
|
|
( |
) |
|
|
|
|
|
|
|
|
|
|
|
$ |
|
|
|
$ |
( |
) |
|
$ |
|
|
|
|
|
|
Definite-lived intangibles are amortized using the straight-line method of amortization over the useful life. Amortization expense was $
Estimated aggregate amortization for definite-lived intangible assets for the next five years and thereafter is as follows:
|
|
|
(In thousands) |
|
|
|
2020 |
|
$ |
|
|
|
2021 |
|
|
|
|
|
2022 |
|
|
|
|
|
2023 |
|
|
|
|
|
2024 |
|
|
|
|
|
Thereafter |
|
|
|
|
|
|
|
$ |
|
|
76
TTM TECHNOLOGIES, INC.
Notes to Consolidated Financial Statements — (Continued)
|
(7) |
Long-term Debt and Letters of Credit |
The following table summarizes the long-term debt of the Company as of December 30, 2019 and December 31, 2018:
|
|
|
Interest Rate as of December 30, 2019 |
|
|
Principal Outstanding as of December 30, 2019 |
|
|
Interest Rate as of December 31, 2018 |
|
|
Principal Outstanding as of December 31, 2018 |
|
||||
|
|
|
(In thousands) |
|
|||||||||||||
|
Term Loan due |
|
|
|
|
% |
$ |
|
|
|
|
|
|
% |
$ |
|
|
|
Senior Notes due |
|
|
|
|
|
|
|
|
|
|
|
|
|
|
|
|
|
Convertible Senior Notes due |
|
|
|
|
|
|
|
|
|
|
|
|
|
|
|
|
|
U.S. ABL Revolving Loan due |
|
|
|
|
|
|
|
|
|
|
|
|
|
|
|
|
|
Asia ABL Revolving Loan due |
|
|
|
|
|
|
|
|
|
|
|
|
|
|
|
|
|
|
|
|
|
|
|
|
|
|
|
|
|
|
|
|
|
|
|
Less: Long-term debt unamortized discount |
|
|
|
|
|
|
( |
) |
|
|
|
|
|
|
( |
) |
|
Long-term debt unamortized debt issuance costs |
|
|
|
|
|
|
( |
) |
|
|
|
|
|
|
( |
) |
|
|
|
|
|
|
|
|
|
|
|
|
|
|
|
|
|
|
|
Less: current maturities |
|
|
|
|
|
|
( |
) |
|
|
|
|
|
|
( |
) |
|
Long-term debt, less current maturities |
|
|
|
|
|
$ |
|
|
|
|
|
|
|
$ |
|
|
|
|
|
|
|
|
|
|
|
|
|
|
|
|
|
|
|
|
The fiscal calendar maturities of long-term debt through 2024 and thereafter are as follows:
|
|
|
(In thousands) |
|
|
|
2020 |
|
$ |
|
|
|
2021 |
|
|
— |
|
|
2022 |
|
|
— |
|
|
2023 |
|
|
— |
|
|
2024 |
|
|
|
|
|
Thereafter |
|
|
|
|
|
|
|
$ |
|
|
Term Loan Facility
On April 18, 2018, the Company closed its $
Based on certain parameters defined in the Term Loan Facility, including a First Lien Leverage Ratio, the Company may be required to make an additional principal payment on an annual basis beginning after fiscal year 2018, if the Company’s First Lien Leverage Ratio is greater than
Borrowings under the Term Loan Facility are subject to certain affirmative and negative covenants, including limitations on indebtedness, corporate transactions, investments and dispositions, and share payments.
77
TTM TECHNOLOGIES, INC.
Notes to Consolidated Financial Statements — (Continued)
Senior Notes
The $
Borrowings under the Senior Notes are subject to certain affirmative and negative covenants, including limitations on indebtedness, corporate transactions, investments and dispositions, and share payments.
Convertible Senior Notes due 2020
The Company maintains
Conversion: At any time prior to
On or after March 15, 2020 until the close of business on the third scheduled trading day preceding the maturity date, holders may convert their notes at any time, regardless of the foregoing circumstances. Upon conversion, for each $
The maximum number of shares issuable upon conversion, including the effect of a fundamental change and subject to Other Conversion Rate Adjustments, would be
Note Repurchase: The Company is not permitted to redeem the Convertible Senior Notes at any time prior to maturity. In the event of a fundamental change or certain default events, as defined in the indenture governing the notes, holders may require the Company to repurchase for cash all or a portion of their Convertible Senior Notes at a price equal to
Convertible Note Hedge and Warrant Transaction: In connection with the issuance of the Convertible Senior Notes due 2020, the Company entered into a convertible note hedge and warrant transaction (Call Spread Transaction), with respect to the Company’s common stock. The convertible note hedge consists of the Company’s option to purchase up to
78
TTM TECHNOLOGIES, INC.
Notes to Consolidated Financial Statements — (Continued)
As of December 30, 2019 and December 31, 2018, the following summarizes the equity components of the Convertible Senior Notes included in additional paid-in capital:
|
|
|
As of December 30, 2019 |
|
|
As of December 31, 2018 |
|
||||||||||||||||||
|
|
|
Embedded conversion option — Convertible Senior Notes |
|
|
Embedded conversion option — Convertible Senior Notes Issuance Costs |
|
|
Total |
|
|
Embedded conversion option — Convertible Senior Notes |
|
|
Embedded conversion option — Convertible Senior Notes Issuance Costs |
|
|
Total |
|
||||||
|
|
|
(In thousands) |
|
|||||||||||||||||||||
|
Convertible Senior Notes due 2020 |
|
$ |
|
|
|
$ |
( |
) |
|
$ |
|
|
|
$ |
|
|
|
$ |
( |
) |
|
$ |
|
|
The components of interest expense resulting from the Convertible Senior Notes for the years ended December 30, 2019, December 31, 2018 and January 1, 2018 were as follows:
|
|
|
For the Year Ended |
|
|||||||||
|
|
|
December 30, |
|
|
December 31, |
|
|
January 1, |
|
|||
|
|
|
2019 |
|
|
2018 |
|
|
2018 |
|
|||
|
|
|
(In thousands) |
|
|||||||||
|
Contractual coupon interest |
|
$ |
|
|
|
$ |
|
|
|
$ |
|
|
|
Amortization of debt discount |
|
$ |
|
|
|
$ |
|
|
|
$ |
|
|
|
Amortization of debt issuance costs |
|
$ |
|
|
|
$ |
|
|
|
$ |
|
|
Asset-Based Lending Agreements
During June 2019, the Company amended its U.S. Asset-Based Lending Credit Agreement (U.S. ABL) and its Asia Asset-Based Lending Credit Agreement (Asia ABL) (collectively the ABL Revolving Loans). The U.S. ABL credit facility was amended to extend its maturity to
The U.S. ABL consists of
The Asia ABL consists of
The Company has up to $
79
TTM TECHNOLOGIES, INC.
Notes to Consolidated Financial Statements — (Continued)
The Company is required to pay a commitment fee of
Other Credit Facility
Additionally, the Company is party to a revolving loan credit facility (Chinese Revolver) with a lender in China. Under this arrangement, the lender has made available to the Company approximately $
Debt Issuance and Debt Discount
As of December 30, 2019 and December 31, 2018, remaining unamortized debt discount and debt issuance costs for the Term Loan Facility, Senior Notes, and Convertible Senior Notes are as follows:
|
|
|
As of December 30, 2019 |
|
|
As of December 31, 2018 |
||||||||||||||||||||
|
|
|
Debt Issuance Costs |
|
|
Debt Discount |
|
|
Effective Interest Rate |
|
|
Debt Issuance Costs |
|
|
Debt Discount |
|
|
Effective Interest Rate |
|
|
||||||
|
|
|
(In thousands, except interest rates) |
|||||||||||||||||||||||
|
Term Loan due September 2024 |
|
$ |
|
|
|
$ |
|
|
|
|
|
|
% |
$ |
|
|
|
$ |
|
|
|
|
|
|
% |
|
Senior Notes due October 2025 |
|
|
|
|
|
— |
|
|
|
|
|
|
|
|
|
|
— |
|
|
|
|
|
|
||
|
Convertible Senior Notes |
|
|
|
|
|
|
|
|
|
|
|
|
|
|
|
|
|
|
|
|
|
|
|
|
|
|
|
|
$ |
|
|
|
$ |
|
|
|
|
|
|
|
$ |
|
|
|
$ |
|
|
|
|
|
|
|
|
|
|
|
|
|
|
|
|
|
|
|
|
|
|
|
|
|
|
|
|
|
|
|
|
|
|
The above debt discount and debt issuance costs are recorded as a reduction of the debt and are amortized into interest expense using an effective interest rate over the duration of the debt.
Remaining unamortized debt issuance costs for the ABL Revolving Loans of $
As of December 30, 2019, the remaining weighted average amortization period for all unamortized debt discount and debt issuance costs was
Loss on Extinguishment of Debt
During the year ended January 1, 2018, the Company recognized loss on extinguishment of debt of $
|
(8) |
Income Taxes |
The components of income (loss) before income taxes for the years ended December 30, 2019, December 31, 2018 and January 1, 2018 are:
|
|
|
For the Year Ended |
|
|||||||||
|
|
|
December 30, 2019 |
|
|
December 31, 2018 |
|
|
January 1, 2018 |
|
|||
|
|
|
(In thousands) |
|
|||||||||
|
United States |
|
$ |
|
|
|
$ |
|
|
|
$ |
( |
) |
|
Foreign |
|
|
|
|
|
|
|
|
|
|
|
|
|
Income before income taxes |
|
$ |
|
|
|
$ |
|
|
|
$ |
|
|
80
TTM TECHNOLOGIES, INC.
Notes to Consolidated Financial Statements — (Continued)
The Company expects its earnings attributable to foreign subsidiaries will be indefinitely reinvested, except for its material Chinese and Canadian plants and the respective holding companies where a deferred tax liability of approximately $
The components of income tax benefit (provision) for the years ended December 30, 2019, December 31, 2018 and January 1, 2018 are:
|
|
|
For the Year Ended |
|
|||||||||
|
|
|
December 30, 2019 |
|
|
December 31, 2018 |
|
|
January 1, 2018 |
|
|||
|
|
|
(In thousands) |
|
|||||||||
|
Current benefit (provision): |
|
|
|
|
|
|
|
|
|
|
|
|
|
Federal |
|
$ |
|
|
|
$ |
|
|
|
$ |
|
|
|
State |
|
|
( |
) |
|
|
( |
) |
|
|
( |
) |
|
Foreign |
|
|
( |
) |
|
|
( |
) |
|
|
( |
) |
|
Total current |
|
|
( |
) |
|
|
( |
) |
|
|
( |
) |
|
Deferred benefit (provision): |
|
|
|
|
|
|
|
|
|
|
|
|
|
Federal |
|
|
|
|
|
|
|
|
|
|
|
|
|
State |
|
|
( |
) |
|
|
|
|
|
|
( |
) |
|
Foreign |
|
|
|
|
|
|
( |
) |
|
|
|
|
|
Total deferred |
|
|
|
|
|
|
|
|
|
|
|
|
|
Total (provision) benefit |
|
$ |
( |
) |
|
$ |
|
|
|
$ |
( |
) |
The following is a reconciliation of the provision for income taxes at the statutory federal income tax rate compared to the Company’s provision for income taxes for the years ended December 30, 2019, December 31, 2018 and January 1, 2018:
|
|
|
For the Year Ended |
|
|||||||||
|
|
|
December 30, 2019 |
|
|
December 31, 2018 |
|
|
January 1, 2018 |
|
|||
|
|
|
(In thousands) |
|
|||||||||
|
Statutory federal income tax |
|
$ |
( |
) |
|
$ |
( |
) |
|
$ |
( |
) |
|
State income taxes, net of federal benefit and state tax credits |
|
|
( |
) |
|
|
( |
) |
|
|
( |
) |
|
Foreign deemed dividends |
|
|
— |
|
|
|
— |
|
|
|
( |
) |
|
Transfer pricing |
|
|
— |
|
|
|
|
|
|
|
— |
|
|
Acquisition related expenses |
|
|
— |
|
|
|
( |
) |
|
|
— |
|
|
IRC Section 162(m) limitation |
|
|
( |
) |
|
|
( |
) |
|
|
— |
|
|
Stock options |
|
|
( |
) |
|
|
|
|
|
|
— |
|
|
Global Intangible Low-Taxed Income |
|
|
( |
) |
|
|
— |
|
|
|
— |
|
|
Intercompany profit in inventory elimination |
|
|
— |
|
|
|
— |
|
|
|
( |
) |
|
Permanently reinvested earnings assertion |
|
|
( |
) |
|
|
( |
) |
|
|
— |
|
|
Tax Act deferred tax revaluation |
|
|
— |
|
|
|
— |
|
|
|
( |
) |
|
Foreign tax differential on foreign earnings & other permanent items |
|
|
|
|
|
|
|
|
|
|
|
|
|
Change in valuation allowance |
|
|
|
|
|
|
|
|
|
|
|
|
|
Uncertain tax positions |
|
|
|
|
|
|
( |
) |
|
|
( |
) |
|
Federal research and development credits |
|
|
|
|
|
|
|
|
|
|
|
|
|
Other |
|
|
|
|
|
|
|
|
|
|
|
|
|
Total (provision) benefit for income taxes |
|
$ |
( |
) |
|
$ |
|
|
|
$ |
( |
) |
81
TTM TECHNOLOGIES, INC.
Notes to Consolidated Financial Statements — (Continued)
Deferred income taxes reflect the net tax effects of temporary differences between the carrying amounts of assets and liabilities for financial reporting purposes and the amounts used for income tax purposes.
|
|
|
As of |
|
|||||
|
|
|
December 30, 2019 |
|
|
December 31, 2018 |
|
||
|
|
|
(In thousands) |
|
|||||
|
Deferred income tax assets: |
|
|
|
|
|
|
|
|
|
Net operating loss carryforwards |
|
$ |
|
|
|
$ |
|
|
|
Reserves and accruals |
|
|
|
|
|
|
|
|
|
Interest expense limitation |
|
|
|
|
|
|
|
|
|
Unrealized loss on cash flow hedge |
|
|
|
|
|
|
|
|
|
Tax credit carryforwards |
|
|
|
|
|
|
|
|
|
Stock-based compensation |
|
|
|
|
|
|
|
|
|
Original issue discount on Convertible Senior Notes |
|
|
|
|
|
|
|
|
|
Property, plant and equipment |
|
|
|
|
|
|
|
|
|
Other deferred income tax assets |
|
|
|
|
|
|
|
|
|
|
|
|
|
|
|
|
|
|
|
Less: valuation allowance |
|
|
( |
) |
|
|
( |
) |
|
|
|
|
|
|
|
|
|
|
|
Deferred income tax liabilities: |
|
|
|
|
|
|
|
|
|
Discount on Convertible Senior Notes |
|
|
— |
|
|
|
( |
) |
|
Repatriation of foreign earnings |
|
|
( |
) |
|
|
( |
) |
|
Property, plant and equipment basis differences |
|
|
( |
) |
|
|
( |
) |
|
Goodwill and intangible amortization |
|
|
( |
) |
|
|
( |
) |
|
Other deferred income tax liabilities |
|
|
( |
) |
|
|
( |
) |
|
Net deferred income tax assets |
|
$ |
|
|
|
$ |
|
|
|
Deferred income tax assets, net: |
|
|
|
|
|
|
|
|
|
Non-current deferred income taxes |
|
|
|
|
|
|
|
|
As of December 30, 2019, the Company had the following net operating loss (NOL) carryforwards: $
In connection with the Company’s acquisition of Viasystems, there was more than a
A valuation allowance is provided when it is more likely than not that all or some portion of the deferred income tax assets will not be realized. During the year ended December 31, 2018, the Company released a majority of its valuation allowance recorded on its U.S. net deferred tax assets due to a combination of the Company’s expectations for future U.S. taxable income improvement and to offset the net deferred tax liability acquired as a result of the Anaren acquisition. It continues to maintain a valuation allowance on certain of its U.S. net deferred tax assets represented by income tax attributes carried forward that are expected to expire unused. Certain subsidiaries within China continue to have NOL carryforwards in various tax jurisdictions that the Company has determined are not more likely than not to be utilized. As a result, a full valuation allowance has been recorded for these subsidiaries as of December 30, 2019. For the remaining net deferred income tax asset, management has determined that it is more likely than not that the results of future operations will generate sufficient taxable income to realize the net deferred tax asset.
82
TTM TECHNOLOGIES, INC.
Notes to Consolidated Financial Statements — (Continued)
The following summarizes the activity in the Company’s valuation allowance for the years ended December 30, 2019, December 31, 2018 and January 1, 2018:
|
|
|
For the Year Ended |
|
|||||||||
|
|
|
December 30, 2019 |
|
|
December 31, 2018 |
|
|
January 1, 2018 |
|
|||
|
|
|
(In thousands) |
|
|||||||||
|
Balance at beginning of year |
|
$ |
|
|
|
$ |
|
|
|
$ |
|
|
|
Reduction related to acquisition |
|
|
— |
|
|
|
( |
) |
|
|
— |
|
|
Additions charged to expense |
|
|
|
|
|
|
— |
|
|
|
|
|
|
Reduction charged to expense — Tax Act |
|
|
— |
|
|
|
— |
|
|
|
( |
) |
|
Other reduction charged to expense |
|
|
( |
) |
|
|
( |
) |
|
|
— |
|
|
Balance at end of year |
|
$ |
|
|
|
$ |
|
|
|
$ |
|
|
Certain entities within China qualified for the high and new technology enterprise (HNTE) status enabling those entities to enjoy certain benefits, which were effective for the years ended December 30, 2019, December 31, 2018 and January 1, 2018.
|
|
|
For the Year Ended |
|
|||||||||
|
|
|
December 30, 2019 |
|
|
December 31, 2018 |
|
|
January 1, 2018 |
|
|||
|
|
|
(In thousands, except per share data) |
|
|||||||||
|
HNTE and R&D benefits |
|
$ |
|
|
|
$ |
|
|
|
$ |
|
|
|
Basic shares |
|
|
|
|
|
|
|
|
|
|
|
|
|
Diluted shares |
|
|
|
|
|
|
|
|
|
|
|
|
|
Increases earnings per share: |
|
|
|
|
|
|
|
|
|
|
|
|
|
Basic |
|
$ |
|
|
|
$ |
|
|
|
$ |
|
|
|
Diluted |
|
$ |
|
|
|
$ |
|
|
|
$ |
|
|
HNTE status expires at various dates in 2019 through 2020, but the Company expects to continue to file for renewal of such HNTE status for the foreseeable future.
A reconciliation of the beginning and ending amount of unrecognized tax benefits, exclusive of accrued interest and penalties, is as follows:
|
|
|
For the Year Ended |
|
|||||||||
|
|
|
December 30, 2019 |
|
|
December 31, 2018 |
|
|
January 1, 2018 |
|
|||
|
|
|
(In thousands) |
|
|||||||||
|
Balance at beginning of year |
|
$ |
|
|
|
$ |
|
|
|
$ |
|
|
|
Additions related to acquisition |
|
|
— |
|
|
|
|
|
|
|
— |
|
|
Additions based on tax positions related to the current year |
|
|
|
|
|
|
|
|
|
|
|
|
|
Additions for tax positions of prior years |
|
|
|
|
|
|
|
|
|
|
|
|
|
Reductions for tax positions of prior years |
|
|
( |
) |
|
|
( |
) |
|
|
( |
) |
|
Lapse of statute of limitations |
|
|
( |
) |
|
|
( |
) |
|
|
( |
) |
|
Balance at end of year |
|
$ |
|
|
|
$ |
|
|
|
$ |
|
|
As of December 30, 2019 and December 31, 2018, the Company recorded unrecognized tax benefits of $
83
TTM TECHNOLOGIES, INC.
Notes to Consolidated Financial Statements — (Continued)
As of December 30, 2019, the Company is subject to (i) U.S. federal income tax examination and / or NOL adjustment for tax years from
|
(9) |
Financial Instruments |
Derivatives
Interest Rate Swaps
The Company’s business is exposed to interest rate risk resulting from fluctuations in interest rates on certain LIBOR-based variable rate debt. Increases in interest rates would increase interest expenses relating to the outstanding variable rate borrowings and increase the cost of debt. Fluctuations in interest rates can also lead to significant fluctuations in the fair value of the debt obligations.
On May 15, 2018, the Company entered into a pay-fixed, receive floating (1-month LIBOR), interest rate swap arrangement with a notional amount of $
At inception, the Company designated the interest rate swap as a cash flow hedge and the fair value of the interest rate swap was
Foreign Exchange Contracts
The Company enters into foreign currency forward contracts to mitigate the impact of changes in foreign currency exchange rates and to reduce the volatility of purchases and other obligations generated in currencies other than its functional currencies. The Company’s foreign subsidiaries may at times purchase forward exchange contracts to manage their foreign currency risks in relation to certain purchases of machinery denominated in foreign currencies other than the Company’s functional currencies. The notional amount of the foreign exchange contracts as of December 30, 2019 and December 31, 2018 was approximately $
The fair values of derivative instruments in the consolidated balance sheets are as follows:
|
|
|
|
|
Asset/(Liability) Fair Value |
|
|||||
|
|
|
Balance Sheet Location |
|
December 30, 2019 |
|
|
December 31, 2018 |
|
||
|
|
|
|
|
(In thousands) |
|
|||||
|
Cash flow derivative instruments designated as hedges: |
|
|
|
|
|
|
|
|
||
|
Interest rate swap |
|
Other long-term liabilities |
|
$ |
( |
) |
|
$ |
( |
) |
|
Cash flow derivative instruments not designated as hedges: |
|
|
|
|
|
|
|
|
||
|
Foreign exchange contracts |
|
Prepaid expenses and other current assets |
|
|
|
|
|
|
— |
|
|
Foreign exchange contracts |
|
Other current liabilities |
|
|
( |
) |
|
|
( |
) |
84
TTM TECHNOLOGIES, INC.
Notes to Consolidated Financial Statements — (Continued)
The following table provides information about the amounts recorded in accumulated other comprehensive loss related to derivatives designated as cash flow hedges, as well as the amounts recorded in each caption in the consolidated statements of operations when derivative amounts are reclassified out of accumulated other comprehensive loss for the years ended December 30, 2019, December 31, 2018 and January 1, 2018:
|
|
|
|
For the Year Ended |
|
|
|||||||||||||||||||||
|
|
|
|
December 30, 2019 |
|
|
December 31, 2018 |
|
|
January 1, 2018 |
|
|
|||||||||||||||
|
|
|
Financial Statement Caption |
Loss Recognized in Other Comprehensive Loss |
|
|
Loss Reclassified into Income |
|
|
Loss Recognized in Other Comprehensive Loss |
|
|
Loss Reclassified into Income |
|
|
Gain Recognized in Other Comprehensive Loss |
|
|
Loss Reclassified into Income |
|
|
||||||
|
|
|
|
(In thousands) |
|||||||||||||||||||||||
|
Cash flow hedge: |
|
|
|
|
|
|
|
|
|
|
|
|
|
|
|
|
|
|
|
|
|
|
|
|
|
|
|
Interest rate swap |
|
Interest expense |
$ |
( |
) |
|
$ |
( |
) |
|
$ |
( |
) |
|
$ |
( |
) |
|
$ |
— |
|
|
$ |
— |
|
|
|
Foreign currency forward |
|
Depreciation expense |
|
( |
) |
|
|
( |
) |
|
|
( |
) |
|
|
( |
) |
|
|
|
|
|
|
( |
) |
|
The following table provides a summary of the activity associated with the designated cash flow hedges reflected in accumulated other comprehensive loss for the years ended December 30, 2019, December 31, 2018 and January 1, 2018:
|
|
|
For the Year Ended |
|
|||||||||
|
|
|
December 30, |
|
|
December 31, |
|
|
January 1, |
|
|||
|
|
|
2019 |
|
|
2018 |
|
|
2018 |
|
|||
|
|
|
(In thousands) |
|
|||||||||
|
Beginning balance, net of tax |
|
$ |
( |
) |
|
$ |
( |
) |
|
$ |
( |
) |
|
Changes in fair value (loss) gain, net of tax |
|
|
( |
) |
|
|
( |
) |
|
|
|
|
|
Reclassification to earnings |
|
|
|
|
|
|
|
|
|
|
|
|
|
Ending balance, net of tax |
|
$ |
( |
) |
|
$ |
( |
) |
|
$ |
( |
) |
Based on the current yield curve, the Company expects that losses of approximately $
85
TTM TECHNOLOGIES, INC.
Notes to Consolidated Financial Statements — (Continued)
|
(10) |
Accumulated Other Comprehensive Income (Loss) |
The following provides a summary of the components of accumulated other comprehensive income (loss), net of tax as of December 30, 2019, December 31, 2018 and January 1, 2018:
|
|
|
Foreign Currency Translation |
|
|
Pension Obligation |
|
|
Gains (Losses) on Cash Flow Hedges |
|
|
Total |
|
||||
|
|
|
(In thousands) |
|
|||||||||||||
|
Ending balance as of January 1, 2018 |
|
$ |
|
|
|
$ |
— |
|
|
$ |
( |
) |
|
$ |
|
|
|
Other comprehensive loss before reclassifications |
|
|
( |
) |
|
|
( |
) |
|
|
( |
) |
|
|
( |
) |
|
Amounts reclassified from accumulated other comprehensive income |
|
|
— |
|
|
|
— |
|
|
|
|
|
|
|
|
|
|
|
|
|
|
|
|
|
|
|
|
|
|
|
|
|
|
|
|
Net year to date other comprehensive loss |
|
|
( |
) |
|
|
( |
) |
|
|
( |
) |
|
|
( |
) |
|
|
|
|
|
|
|
|
|
|
|
|
|
|
|
|
|
|
|
Ending balance as of December 31, 2018 |
|
|
|
|
|
|
( |
) |
|
|
( |
) |
|
|
( |
) |
|
Other comprehensive loss before reclassifications |
|
|
( |
) |
|
|
( |
) |
|
|
( |
) |
|
|
( |
) |
|
Amounts reclassified from accumulated other comprehensive income |
|
|
— |
|
|
|
— |
|
|
|
|
|
|
|
|
|
|
|
|
|
|
|
|
|
|
|
|
|
|
|
|
|
|
|
|
Net year to date other comprehensive loss |
|
|
( |
) |
|
|
( |
) |
|
|
( |
) |
|
|
( |
) |
|
|
|
|
|
|
|
|
|
|
|
|
|
|
|
|
|
|
|
Ending balance as of December 30, 2019 |
|
$ |
|
|
|
$ |
( |
) |
|
$ |
( |
) |
|
$ |
( |
) |
|
(11) |
Significant Customers and Concentration of Credit Risk |
In the normal course of business, the Company extends credit to its customers. Most customers to which the Company extends credit are located outside the United States. The Company performs ongoing credit evaluations of customers, does not require collateral, and considers the credit risk profile of the entity from which the receivable is due in further evaluating collection risk.
The Company’s customers include both OEMs and EMS companies. The Company’s OEM customers often direct a significant portion of their purchases through EMS companies. While the Company’s customers include both OEM and EMS providers, the Company measures customer concentration based on OEM companies, as they are the ultimate end customers.
For the years ended December 30, 2019 and December 31, 2018,
86
TTM TECHNOLOGIES, INC.
Notes to Consolidated Financial Statements — (Continued)
|
(12) |
Fair Value Measures |
The Company measures at fair value its financial and non-financial assets by using a fair value hierarchy that prioritizes the inputs to valuation techniques used to measure fair value. Fair value is the price that would be received to sell an asset or paid to transfer a liability in an orderly transaction between market participants at the measurement date, essentially an exit price, based on the highest and best use of the asset or liability.
The carrying amount and estimated fair value of the Company’s financial instruments as of December 30, 2019 and December 31, 2018 were as follows:
|
|
|
As of |
|
|
As of |
|
||||||||||
|
|
|
December 30, 2019 |
|
|
December 31, 2018 |
|
||||||||||
|
|
|
Carrying Amount |
|
|
Fair Value |
|
|
Carrying Amount |
|
|
Fair Value |
|
||||
|
|
|
(In thousands) |
|
|||||||||||||
|
Derivative assets, current |
|
$ |
|
|
|
$ |
|
|
|
$ |
— |
|
|
$ |
— |
|
|
Derivative liabilities, current |
|
|
|
|
|
|
|
|
|
|
|
|
|
|
|
|
|
Derivative liabilities, non-current |
|
|
|
|
|
|
|
|
|
|
|
|
|
|
|
|
|
Term Loan due September 2024 |
|
|
|
|
|
|
|
|
|
|
|
|
|
|
|
|
|
Senior Notes due October 2025 |
|
|
|
|
|
|
|
|
|
|
|
|
|
|
|
|
|
Convertible Senior Notes due December 2020 |
|
|
|
|
|
|
|
|
|
|
|
|
|
|
|
|
|
ABL Revolving Loans |
|
|
|
|
|
|
|
|
|
|
|
|
|
|
|
|
The fair value of the derivative instruments was determined using pricing models developed based on the LIBOR swap rate, foreign currency exchange rates, and other observable market data, including quoted market prices, as appropriate using Level 2 inputs. The values were adjusted to reflect non-performance risk of both the counterparty and the Company, as necessary.
The fair value of the long-term debt was estimated based on quoted market prices or discounting the debt over its life using current market rates for similar debt as of December 30, 2019 and December 31, 2018, which are considered Level 2 inputs.
The fair value of the Convertible Senior Notes was estimated based on quoted market prices of the securities on an active exchange, which are considered Level 2 inputs.
The fair value of plan assets in the defined benefit plan of $
As of December 30, 2019 and December 31, 2018, the Company’s other financial instruments also included cash and cash equivalents, accounts receivable, and accounts payable. Due to short-term maturities, the carrying amount of these instruments approximates fair value. The Company’s cash and cash equivalents as of December 30, 2019 consisted of $
The majority of the Company’s non-financial assets and liabilities, which include goodwill, intangible assets, inventories, and property, plant and equipment, are not required to be carried at fair value on a recurring basis. However, if certain triggering events occur (or are tested at least annually in the case of goodwill) such that a non-financial instrument is required to be evaluated for impairment, based upon a comparison of the non-financial instrument’s fair value to its carrying value, an impairment is recorded to reduce the carrying value to the fair value, if the carrying value exceeds the fair value. There was
|
(13) |
Commitments and Contingencies |
Legal Matters
The Company is subject to various legal matters, which it considers normal for its business activities. While the Company currently believes that the amount of any reasonably possible loss for known matters would not be material to the Company’s financial condition, the outcome of these actions is inherently difficult to predict. In the event of an adverse outcome, the ultimate potential loss could have a material adverse effect on the Company’s financial condition or results of operations in a particular period. The Company has accrued amounts for its loss contingencies which are probable and estimable as of December 30, 2019 and December 31, 2018. However, these amounts are not material to the consolidated financial statements of the Company.
87
TTM TECHNOLOGIES, INC.
Notes to Consolidated Financial Statements — (Continued)
|
(14) |
Stock-Based Compensation |
Incentive Compensation Plan
The Company maintains a 2014 Incentive Compensation Plan (the Plan), which allowed for the issuance of up to
The Plan provides for the grant of incentive stock options and nonqualified stock options to the Company’s key employees, non-employee directors and consultants. Other types of awards such as performance-based restricted stock units (PRUs), restricted stock units (RSUs), and stock appreciation rights are also permitted. The exercise price for options and awards is determined by the compensation committee of the board of directors and, for options intended to qualify as incentive stock options, may not be less than the fair market value as determined by the closing stock price at the date of the grant. Each option and award shall vest and expire as determined by the compensation committee of the board of directors, with options, PRUs and RSUs generally vesting over
As of December 30, 2019,
Performance-based Restricted Stock Units
The Company maintains a long-term incentive program for executives that provides for the issuance of PRUs, representing hypothetical shares of the Company’s common stock that may be issued. Under the PRU program, a target number of PRUs is awarded at the beginning of each performance period. The number of shares of common stock released at the end of the performance period may range from
Under the PRU program, financial goals are set at the beginning of each fiscal year and performance is reviewed at the end of that year. The percentage to be applied to each participant’s target award ranges from
At the end of the three-year performance period, the total units earned, if any, are adjusted by applying a modifier, ranging from
The TSR modifier is intended to ensure that there are limited or no payouts under the PRU program if the Company’s stock performance is significantly below the median TSR of a group of peer companies selected by the Company’s compensation committee over the three-year performance period. Where the annual financial goals have been met and where there has been strong relative TSR performance over the three-year performance period, the PRU program may provide substantial rewards to participants with a maximum payout of
Recipients of PRU awards generally must remain employed by the Company on a continuous basis through the end of the three-year performance period in order to receive any amount of the PRUs covered by that award. In events such as death, disability or retirement, the recipient may be entitled to pro-rata amounts of PRUs as defined in the Plan. Target shares subject to PRU awards do not have voting rights of common stock until earned and issued following the end of the three-year performance period.
88
TTM TECHNOLOGIES, INC.
Notes to Consolidated Financial Statements — (Continued)
The Company records stock-based compensation expense for PRU awards granted based on management’s periodic assessment of the annual financial performance goals to be achieved. As of December 30, 2019, management determined that vesting of the PRU awards was probable.
|
|
|
Shares |
|
|
Weighted Average Fair Value |
|
||
|
|
|
(In thousands) |
|
|
|
|
|
|
|
Outstanding shares as of December 31, 2018 |
|
|
|
|
|
$ |
|
|
|
Granted |
|
|
|
|
|
|
|
|
|
Vested |
|
|
( |
) |
|
|
|
|
|
Forfeited / cancelled |
|
|
( |
) |
|
|
|
|
|
Change in units due to annual performance achievement |
|
|
( |
) |
|
|
|
|
|
Outstanding shares as of December 30, 2019 |
|
|
|
|
|
$ |
|
|
The fair value of PRUs granted is calculated using a Monte Carlo simulation model, as the TSR modifier contains a market condition.
|
|
|
For the Year Ended |
|
|||||||||
|
|
|
December 30, 2019 (1) |
|
|
December 31, 2018 (2) |
|
|
January 1, 2018 (3) |
|
|||
|
Weighted-average fair value |
|
$ |
|
|
|
$ |
|
|
|
$ |
|
|
|
Risk-free interest rate |
|
|
|
% |
|
|
|
% |
|
|
|
% |
|
Dividend yield |
|
|
— |
|
|
|
— |
|
|
|
— |
|
|
Expected volatility |
|
|
|
% |
|
|
|
% |
|
|
|
% |
|
Expected term in years |
|
|
|
|
|
|
|
|
|
|
|
|
|
(1) |
Reflects the weighted-averages for the third year of the three-year performance period applicable to PRUs granted in 2017, the second year of the three-year performance period applicable to PRUs granted in 2018 and the first year of the three-year performance period applicable to PRUs granted in 2019. |
|
(2) |
Reflects the weighted-averages for the third year of the three-year performance period applicable to PRUs granted in 2016, the second year of the three-year performance period applicable to PRUs granted in 2017 and the first year of the three-year performance period applicable to PRUs granted in 2018. |
|
(3) |
Reflects the weighted-averages for the third year of the three-year performance period applicable to PRUs granted in 2015, the second year of the three-year performance period applicable to PRUs granted in 2016 and the first year of the three-year performance period applicable to PRUs granted in 2017. |
The risk-free interest rate for the expected term of PRUs is based on the U.S. Treasury yield curve in effect at the time of grant. Expected volatility is calculated using the Company’s historical stock price. The expected term of the PRUs reflects the performance period for the PRUs granted.
Restricted Stock Units
RSU activity for the year ended December 30, 2019 was as follows:
|
|
|
Shares |
|
|
Weighted Average Grant-Date Fair Value |
|
||
|
|
|
(In thousands) |
|
|
|
|
|
|
|
Non-vested RSUs outstanding as of December 31, 2018 |
|
|
|
|
|
$ |
|
|
|
Granted |
|
|
|
|
|
|
|
|
|
Vested |
|
|
( |
) |
|
|
|
|
|
Forfeited |
|
|
( |
) |
|
|
|
|
|
Non-vested RSUs outstanding as of December 30, 2019 |
|
|
|
|
|
$ |
|
|
|
Vested and expected to vest as of December 30, 2019 |
|
|
|
|
|
$ |
|
|
The fair value of the Company’s RSUs is determined based upon the closing common stock price on the grant date. The weighted average fair value per unit of RSUs granted was $
89
TTM TECHNOLOGIES, INC.
Notes to Consolidated Financial Statements — (Continued)
Stock Options
The Company did
The Company determines the expected term of its stock option awards by periodic review of its historical stock option exercise experience. This calculation uses assumed future exercise patterns to account for option holders’ expected exercise and post-vesting termination behavior for outstanding stock options over their remaining contractual terms. Expected volatility is calculated by weighting the Company’s historical stock price to calculate expected volatility over the expected term of each grant. The risk-free interest rate for the expected term of each option granted is based on the U.S. Treasury yield curve in effect at the time of grant with a period that approximates the expected term of the options.
Option activity under the Plan for the year ended December 30, 2019 was as follows:
|
|
|
Options |
|
|
Weighted Average Exercise Price |
|
|
Weighted Average Remaining Contractual Term |
|
|
Aggregate Intrinsic Value |
|
||||
|
|
|
(In thousands) |
|
|
|
|
|
|
(In years) |
|
|
(In thousands) |
|
|||
|
Outstanding as of December 31, 2018 |
|
|
|
|
|
$ |
|
|
|
|
|
|
|
$ |
|
|
|
Outstanding as of December 30, 2019 |
|
|
|
|
|
$ |
|
|
|
|
|
|
|
$ |
|
|
|
Vested and expected to vest as of December 30, 2019 |
|
|
|
|
|
$ |
|
|
|
|
|
|
|
$ |
|
|
|
Exercisable as of December 30, 2019 |
|
|
|
|
|
$ |
|
|
|
|
|
|
|
$ |
|
|
The aggregate intrinsic values in the table above represent the total pretax intrinsic value (the difference between Company’s closing stock price on the last trading day of the 2019 fiscal year and the exercise price, multiplied by the number of in-the-money options) that would have been received by the option holders had all option holders exercised their options on December 30, 2019. This amount changes based on the fair market value of the Company’s stock. There were
Stock-based Compensation Expense and Unrecognized Compensation Costs
For the years ended December 30, 2019, December 31, 2018 and January 1, 2018, the amounts recognized in the consolidated statements of operations with respect to the stock-based compensation plan are as follows:
|
|
|
For the Year Ended |
|
|||||||||
|
|
|
December 30, |
|
|
December 31, |
|
|
January 1, |
|
|||
|
|
|
2019 |
|
|
2018 |
|
|
2018 |
|
|||
|
|
|
(In thousands) |
|
|||||||||
|
Cost of goods sold |
|
$ |
|
|
|
$ |
|
|
|
$ |
|
|
|
Selling and marketing |
|
|
|
|
|
|
|
|
|
|
|
|
|
General and administrative |
|
|
|
|
|
|
|
|
|
|
|
|
|
Stock-based compensation expense recognized |
|
$ |
|
|
|
$ |
|
|
|
$ |
|
|
The following is a summary of total unrecognized compensation costs as of December 30, 2019:
|
|
|
Unrecognized Stock-Based Compensation Cost |
|
|
Remaining Weighted Average Recognition Period |
|
||
|
|
|
(In thousands) |
|
|
(In years) |
|
||
|
RSU awards |
|
$ |
|
|
|
|
|
|
|
PRU awards |
|
|
|
|
|
|
|
|
|
Stock options |
|
|
|
|
|
|
|
|
|
|
|
$ |
|
|
|
|
|
|
90
TTM TECHNOLOGIES, INC.
Notes to Consolidated Financial Statements — (Continued)
|
(15) |
Employee Benefit Plans, Deferred Compensation Plan and Retirement Benefit Plan |
As of December 30, 2019, the Company has several defined contribution plans.
The Company also maintains a deferred compensation plan (the Compensation Plan). The Compensation Plan is an unfunded, nonqualified deferred compensation plan and is limited to selected employees, including the Company’s named executive officers and directors. The Compensation Plan allows participants to defer up to
During the years ended December 30, 2019 and December 31, 2018, and following the acquisition of Anaren on April 18, 2018, the Company has a noncontributory defined benefit pension plan covering eligible employees. Effective August 15, 2000, the plan was closed for new participants. Benefits under this plan generally are based on the employee’s years of service and compensation. Effective December 31, 2019, the plan is frozen as to further participation and to further benefit accruals.
As of December 30, 2019 and December 31, 2018, the funded status of the accumulated benefit obligation was
The following tables set forth the changes in benefit obligation and the plan assets in the defined benefit plan described above for the years ended December 30, 2019 and December 31, 2018:
|
|
|
For the Year Ended |
|
|||||
|
Change in Benefit Obligations |
|
December 30, 2019 |
|
|
December 31, 2018 |
|
||
|
|
|
(In thousands) |
|
|||||
|
Benefit obligation at beginning of year |
|
$ |
( |
) |
|
$ |
( |
) |
|
Service cost |
|
|
( |
) |
|
|
( |
) |
|
Interest cost |
|
|
( |
) |
|
|
( |
) |
|
Amendments/curtailments/special termination |
|
|
|
|
|
|
— |
|
|
Actuarial (loss) gain |
|
|
( |
) |
|
|
|
|
|
Benefits paid |
|
|
|
|
|
|
|
|
|
Benefit obligation at end of year |
|
$ |
( |
) |
|
$ |
( |
) |
|
Accumulated benefit obligation at end of year |
|
$ |
|
|
|
$ |
|
|
|
|
|
For the Year Ended |
|
|||||
|
Change in in Plan Assets |
|
December 30, 2019 |
|
|
December 31, 2018 |
|
||
|
|
|
(In thousands) |
|
|||||
|
Fair value of plan assets at beginning of year |
|
$ |
|
|
|
$ |
|
|
|
Actual return on plan assets |
|
|
|
|
|
|
( |
) |
|
Employer contributions |
|
|
|
|
|
|
|
|
|
Benefits paid |
|
|
( |
) |
|
|
( |
) |
|
Fair value of plan assets at end of year |
|
$ |
|
|
|
$ |
|
|
|
Unfunded status |
|
$ |
( |
) |
|
$ |
( |
) |
|
Net amount recognized |
|
$ |
( |
) |
|
$ |
( |
) |
Amounts before income tax effect recognized in the consolidated balance sheets consists of the following:
|
|
|
As of |
|
|
As of |
|
|
||
|
|
|
December 30, 2019 |
|
|
December 31, 2018 |
|
|
||
|
|
|
(In thousands) |
|
|
|||||
|
Other long-term liabilities |
|
$ |
( |
) |
|
$ |
( |
) |
|
|
Net amount recognized |
|
$ |
( |
) |
|
$ |
( |
) |
|
91
TTM TECHNOLOGIES, INC.
Notes to Consolidated Financial Statements — (Continued)
Amounts before income tax effect included in accumulated other comprehensive loss as of December 30, 2019 and
December 31, 2018 are as follows:
|
|
|
December 30, 2019 |
|
|
December 31, 2018 |
|
|
||
|
|
|
(In thousands) |
|
|
|||||
|
Net actuarial loss |
|
$ |
( |
) |
|
$ |
( |
) |
|
|
Accumulated other comprehensive loss |
|
$ |
( |
) |
|
$ |
( |
) |
|
During 2020,
The components included in the net periodic benefit cost and the increase in minimum liability included in other comprehensive loss for the years ended December 30, 2019 and December 31, 2018 are as follows:
|
|
|
December 30, 2019 |
|
|
December 31, 2018 |
|
||
|
|
|
(In thousands) |
|
|||||
|
Service cost |
|
$ |
|
|
|
$ |
|
|
|
Interest cost |
|
|
|
|
|
|
|
|
|
Expected return on plan assets |
|
|
( |
) |
|
|
( |
) |
|
Net periodic benefit cost |
|
$ |
|
|
|
$ |
|
|
The weighted-average assumptions used to determine benefit obligations for this plan as of December 30, 2019 and
December 31, 2018 are as follows:
|
|
|
December 30, 2019 |
|
|
December 31, 2018 |
|
|
||
|
Discount rate |
|
|
|
|
% |
|
|
|
% |
|
Rate of compensation increase |
|
|
|
|
|
|
|
|
|
|
Expected return on plan assets |
|
|
|
|
|
|
|
|
|
The Company determines the discount rate assumption based on the internal rate of return for a portfolio of high quality bonds, with a minimum rating of Moody's AA Corporate and with maturities that are consistent with the projected future cash flow obligations.
The weighted-average assumptions used to determine net periodic benefit cost for the year ended December 30, 2019 and December 31, 2018 are as follows:
|
|
|
For the Year Ended |
|
|
|||||
|
|
|
December 30, 2019 |
|
|
December 31, 2018 |
|
|
||
|
Discount rate |
|
|
|
|
% |
|
|
|
% |
|
Rate of compensation increase |
|
|
|
|
|
|
|
|
|
|
Expected return on plan assets |
|
|
|
|
|
|
|
|
|
The Company determines the expected long-term rate of return on plan assets based upon recommendations from its pension plan's investment advisors and using an allocation approach that considers diversification and rebalancing for a portfolio of assets invested over a long-term time horizon. The approach relies on the historical returns of the plan's portfolio and relationships between equities and fixed income investments, consistent with the widely accepted capital market principle that a diversified portfolio with a larger allocation to equity investments can generate a greater return over the long run. Additionally, the Company monitors the mix of investments in its portfolio to ensure alignment with its expected long-term pension obligations. The Company reviews the expected long-term rate of return annually and revises it as appropriate.
Investments shall be made pursuant to the following objectives: 1) preserve the purchasing power of the plan’s assets adjusted for inflation; 2) provide long term growth; 3) avoid significant volatility. Asset allocation shall be determined based on a long-term target allocation having
The target allocation for 2020 and the plan asset allocation at the end of 2019 and 2018, in percentages, by asset category are as follows:
|
|
|
Target Allocation 2020 |
|
|
|
December 30, 2019 |
|
|
|
December 31, 2018 |
|
|
|||
|
Equity securities (1) |
|
|
|
|
% |
|
|
|
|
% |
|
|
|
|
% |
|
Debt securities (2) |
|
|
|
|
|
|
|
|
|
|
|
|
|
|
|
|
Cash and cash equivalents (3) |
|
|
|
|
|
|
|
|
|
|
|
|
|
|
|
|
Total |
|
|
|
|
% |
|
|
|
|
% |
|
|
|
|
% |
92
TTM TECHNOLOGIES, INC.
Notes to Consolidated Financial Statements — (Continued)
The following table summarizes plan assets measured at fair value as of December 30, 2019 and December 31, 2018:
|
|
|
As of |
|
|||||||||||||
|
|
|
December 30, 2019 |
|
|||||||||||||
|
|
|
Total |
|
|
Quoted Prices in Active Markets for Identical Assets (Level 1) |
|
|
Significant Observable Inputs (Level 2) |
|
|
Significant Unobservable Inputs (Level 3) |
|
||||
|
|
|
(In thousands) |
|
|||||||||||||
|
Equity securities (1) |
|
$ |
|
|
|
$ |
|
|
|
$ |
— |
|
|
$ |
— |
|
|
Debt securities (2) |
|
|
|
|
|
|
|
|
|
|
— |
|
|
|
— |
|
|
Cash and cash equivalents (3) |
|
|
|
|
|
|
|
|
|
|
— |
|
|
|
— |
|
|
Total |
|
$ |
|
|
|
$ |
|
|
|
$ |
— |
|
|
$ |
— |
|
|
|
|
|
|
|
|
|
|
|
|
|
|
|
|
|
|
|
|
|
|
As of |
|
|||||||||||||
|
|
|
December 31, 2018 |
|
|||||||||||||
|
|
|
Total |
|
|
Quoted Prices in Active Markets for Identical Assets (Level 1) |
|
|
Significant Observable Inputs (Level 2) |
|
|
Significant Unobservable Inputs (Level 3) |
|
||||
|
|
|
(In thousands) |
|
|||||||||||||
|
Equity securities (1) |
|
$ |
|
|
|
$ |
|
|
|
$ |
— |
|
|
$ |
— |
|
|
Debt securities (2) |
|
|
|
|
|
|
|
|
|
|
— |
|
|
|
— |
|
|
Cash and cash equivalents (3) |
|
|
|
|
|
|
|
|
|
|
— |
|
|
|
— |
|
|
Total |
|
$ |
|
|
|
$ |
|
|
|
$ |
— |
|
|
$ |
— |
|
|
(1) |
Equity securities include U.S. and foreign exchange traded common and preferred stocks and mutual funds. Common and preferred shares issued by U.S. and non-U.S. corporations are traded actively on exchanges and price quotes for these shares are readily available. Holdings of corporate stock are categorized as Level 1 investments. |
|
(2) |
Debt securities include the debt of the U.S. Treasury and U.S. and foreign corporate issuers. U.S. Treasury notes and bonds are actively traded and price quotes for these securities are readily available. Holdings of U.S. Treasury notes and bonds are categorized as Level 1 investments. |
|
(3) |
Cash and cash equivalents include short-term U.S. government investment notes, short-term money market mutual funds, accrued income and cash held on account. Cash held on account and short- term U.S. government investment notes (including accrued income thereon) for which there is an active market and daily pricing for the security are categorized as Level 1 investments. |
The Company seeks to maximize medium to long-term returns of the overall pension plan assets with reasonable levels of investment risk. One element of controlling the overall investment risk is through diversification of asset allocation, among domestic and international equity and debt instruments. The plan's equity investments include foreign and domestic exchange traded equities across a range of industries and countries, but primarily in the domestic markets. The plan's debt securities are primarily invested in government and corporate issuers primarily in the domestic market.
The following benefit payments, which reflect expected future service, as appropriate, are expected to be paid:
|
|
|
(In thousands) |
|
|
|
2020 |
|
$ |
|
|
|
2021 |
|
|
|
|
|
2022 |
|
|
|
|
|
2023 |
|
|
|
|
|
2024 |
|
|
|
|
|
Years 2025 through 2029 |
|
|
|
|
|
(16) |
Preferred Stock |
The board of directors has the authority, without action by stockholders, to designate and issue preferred stock in one or more series. The board of directors may also designate the rights, preferences and privileges of each series of preferred stock, any or all of which may be superior to the rights of the common stock. As of December 30, 2019,
|
(17) |
Segment Information |
The reportable segments shown below are the Company’s segments for which separate financial information is available and upon which operating results are evaluated by the chief operating decision maker to assess performance and to allocate resources. The Company has
93
TTM TECHNOLOGIES, INC.
Notes to Consolidated Financial Statements — (Continued)
provide follow-on value-added services;
The Company, including the chief operating decision maker, evaluates segment performance based on reportable segment income, which is operating income before amortization of intangibles. Interest expense and interest income are not presented by segment since they are not included in the measure of segment profitability reviewed by the chief operating decision maker. All inter-segment transactions have been eliminated.
|
|
|
|
For the Year Ended |
|
|||||||||
|
|
|
|
December 30, 2019 |
|
|
December 31, 2018 |
|
|
January 1, 2018 |
|
|||
|
|
|
|
(In thousands) |
|
|||||||||
|
Net Sales: |
|
|
|
|
|
|
|
|
|
|
|
|
|
|
PCB (1) |
|
|
$ |
|
|
|
$ |
|
|
|
$ |
|
|
|
E-M Solutions |
|
|
|
|
|
|
|
|
|
|
|
|
|
|
Total net sales |
|
|
$ |
|
|
|
$ |
|
|
|
$ |
|
|
|
Operating Segment Income: |
|
|
|
|
|
|
|
|
|
|
|
|
|
|
PCB (1) |
|
|
$ |
|
|
|
$ |
|
|
|
$ |
|
|
|
E-M Solutions |
|
|
|
|
|
|
|
|
|
|
|
|
|
|
Corporate |
|
|
|
( |
) |
|
|
( |
) |
|
|
( |
) |
|
Total operating segment income |
|
|
|
|
|
|
|
|
|
|
|
|
|
|
Amortization of definite-lived intangibles (2) |
|
|
|
( |
) |
|
|
( |
) |
|
|
( |
) |
|
Total operating income |
|
|
|
|
|
|
|
|
|
|
|
|
|
|
Total other expense |
|
|
|
( |
) |
|
|
( |
) |
|
|
( |
) |
|
Income before income taxes |
|
|
$ |
|
|
|
$ |
|
|
|
$ |
|
|
|
|
|
|
For the Year Ended |
|
|||||||||
|
|
|
|
December 30, 2019 |
|
|
December 31, 2018 |
|
|
January 1, 2018 |
|
|||
|
|
|
|
(In thousands) |
|
|||||||||
|
Depreciation Expense: |
|
|
|
|
|
|
|
|
|
|
|
|
|
|
PCB (1) |
|
|
$ |
|
|
|
$ |
|
|
|
$ |
|
|
|
E-M Solutions |
|
|
|
|
|
|
|
|
|
|
|
|
|
|
Corporate |
|
|
|
|
|
|
|
|
|
|
|
|
|
|
Total depreciation expense |
|
|
$ |
|
|
|
$ |
|
|
|
$ |
|
|
|
|
|
|
|
|
|
|
|
|
|
|
|
|
|
|
Capital Expenditures: |
|
|
|
|
|
|
|
|
|
|
|
|
|
|
PCB (1) |
|
|
$ |
|
|
|
$ |
|
|
|
$ |
|
|
|
E-M Solutions |
|
|
|
|
|
|
|
|
|
|
|
|
|
|
Corporate |
|
|
|
|
|
|
|
|
|
|
|
|
|
|
Total capital expenditures |
|
|
$ |
|
|
|
$ |
|
|
|
$ |
|
|
|
|
|
|
As of |
|
|||||||||
|
|
|
|
December 30, 2019 |
|
|
December 31, 2018 |
|
|
January 1, 2018 |
|
|||
|
|
|
|
(In thousands) |
|
|||||||||
|
Segment Assets: |
|
|
|
|
|
|
|
|
|
|
|
|
|
|
PCB (1) |
|
|
$ |
|
|
|
$ |
|
|
|
$ |
|
|
|
E-M Solutions |
|
|
|
|
|
|
|
|
|
|
|
|
|
|
Corporate |
|
|
|
|
|
|
|
|
|
|
|
|
|
|
Total assets |
|
|
$ |
|
|
|
$ |
|
|
|
$ |
|
|
|
(1) |
Figures for the year ended January 1, 2018 do not include Anaren, as the acquisition occurred on April 18, 2018. |
|
(2) |
Amortization of definite-lived intangibles relates to the PCB reportable segment. For the years ended December 30, 2019 and December 31, 2018, $ |
94
TTM TECHNOLOGIES, INC.
Notes to Consolidated Financial Statements — (Continued)
The Corporate category includes operating expenses that are not included in the segment operating performance measures. Corporate consists primarily of corporate governance functions such as finance, accounting, information technology, facilities and human resources personnel, as well as global sales and marketing personnel and acquisition and integration costs associated with the acquisitions. Bank fees and legal, accounting, and other professional service costs associated with acquisitions of $
The Company markets and sells its products in approximately
|
|
|
2019 |
|
|
2018 |
|
|
2017 |
|
|||||||||||||||
|
|
|
Net Sales |
|
|
Long-Lived Assets |
|
|
Net Sales |
|
|
Long-Lived Assets |
|
|
Net Sales |
|
|
Long-Lived Assets |
|
||||||
|
|
|
(In thousands) |
|
|||||||||||||||||||||
|
United States |
|
$ |
|
|
|
$ |
|
|
|
$ |
|
|
|
$ |
|
|
|
$ |
|
|
|
$ |
|
|
|
China |
|
|
|
|
|
|
|
|
|
|
|
|
|
|
|
|
|
|
|
|
|
|
|
|
|
Other |
|
|
|
|
|
|
|
|
|
|
|
|
|
|
|
|
|
|
|
|
|
|
|
|
|
Total |
|
$ |
|
|
|
$ |
|
|
|
$ |
|
|
|
$ |
|
|
|
$ |
|
|
|
$ |
|
|
Net sales are attributed to countries by country invoiced.
|
(18) |
Earnings Per Share |
The following is a reconciliation of the numerator and denominator used to calculate basic earnings per share and diluted earnings per share for the years ended December 30, 2019, December 31, 2018 and January 1, 2018:
|
|
|
For the Year Ended |
|
|||||||||
|
|
|
December 30, 2019 |
|
|
December 31, 2018 |
|
|
January 1, 2018 |
|
|||
|
|
|
(In thousands, except per share amounts) |
|
|||||||||
|
Basic earnings: |
|
|
|
|
|
|
|
|
|
|
|
|
|
Basic earnings |
|
$ |
|
|
|
$ |
|
|
|
$ |
|
|
|
Diluted earnings: |
|
|
|
|
|
|
|
|
|
|
|
|
|
Net income attributable to TTM Technologies, Inc. stockholders |
|
$ |
|
|
|
$ |
|
|
|
$ |
|
|
|
Interest expense from Convertible Senior Notes, net of tax |
|
|
|
|
|
|
|
|
|
|
|
|
|
Diluted earnings |
|
$ |
|
|
|
$ |
|
|
|
$ |
|
|
|
|
|
|
|
|
|
|
|
|
|
|
|
|
|
Basic weighted average shares |
|
|
|
|
|
|
|
|
|
|
|
|
|
Dilutive effect of performance-based restricted stock units, restricted stock units and stock options |
|
|
|
|
|
|
|
|
|
|
|
|
|
Dilutive effect of outstanding warrants |
|
|
— |
|
|
|
|
|
|
|
|
|
|
Dilutive effect of assumed conversion of Convertible Senior Notes outstanding |
|
|
— |
|
|
|
|
|
|
|
|
|
|
Diluted shares |
|
|
|
|
|
|
|
|
|
|
|
|
|
Earnings per share attributable to TTM Technologies, Inc. stockholders: |
|
|
|
|
|
|
|
|
|
|
|
|
|
Basic |
|
$ |
|
|
|
$ |
|
|
|
$ |
|
|
|
Diluted |
|
$ |
|
|
|
$ |
|
|
|
$ |
|
|
For the years ended December 30, 2019, December 31, 2018 and January 1, 2018, PRUs, RSUs and stock options to purchase
95
TTM TECHNOLOGIES, INC.
Notes to Consolidated Financial Statements — (Continued)
The below is a summary of amounts convertible to common stock related to Convertible Senior Notes and related warrants:
|
|
|
For the Year Ended |
|
|||||||||
|
|
|
December 30, 2019 |
|
|
December 31, 2018 |
|
|
January 1, 2018 |
|
|||
|
|
|
(In thousands) |
|
|||||||||
|
Common stock related to Convertible Senior Notes |
|
|
|
|
|
|
|
|
|
|
|
|
|
Warrants to purchase common stock |
|
|
|
|
|
|
|
|
|
|
|
|
For the year ended December 30, 2019, the effect of shares of common stock related to the Company’s Convertible Senior Notes, based on the if-converted method, were not included in the computation of dilutive earnings per share as the impact would be anti-dilutive.
Outstanding warrants for the year ended December 30, 2019, to purchase common stock were not included in the computation of dilutive earnings per share because the strike price of the warrants to purchase the Company’s common stock were greater than the average market price of common shares during the applicable year, and therefore, the effect would be anti-dilutive.
|
(19) |
Related Party Transactions |
In the normal course of business, the Company’s foreign subsidiaries purchase laminate and prepreg from related parties in which a member of the Board of Directors of the Company holds an equity interest. The Company’s foreign subsidiaries purchased laminate and prepreg from these related parties in the amount of $
The Company also sells PCBs to a related party which is a wholly owned subsidiary of an entity in which a member of the Board of Directors of the Company holds an equity interest. Sales to this related party for the years ended December 30, 2019, December 31, 2018 and January 1, 2018 were $
As of December 30, 2019 and December 31, 2018, the Company’s consolidated balance sheets included $
|
(20) |
Non-controlling Interest Holdings |
During the fourth quarter of 2017, the Company acquired Desay Industrial’s
|
(21) |
Acquisition of Anaren, Inc. |
On
Pro forma Financial Information (unaudited)
The unaudited pro forma financial information below gives effect to this acquisition as if it had occurred at the beginning of fiscal 2017, or January 3, 2017. The pro forma financial information presented includes the effects of adjustments related to the amortization of acquired identifiable intangible assets and acquired inventory, depreciation of acquired fixed assets, and other non-recurring transactions costs directly associated with the acquisition such as legal, accounting and banking fees.
96
TTM TECHNOLOGIES, INC.
Notes to Consolidated Financial Statements — (Continued)
The pro forma financial information as presented below is for informational purposes only and is not necessarily indicative of the actual results that would have been achieved had the acquisition occurred at the beginning of the earliest period presented, or the results that may be achieved in future periods.
|
|
|
For the Year Ended |
|
|||||
|
|
|
December 31, |
|
|
January 1, |
|
||
|
|
|
2018 |
|
|
2018 |
|
||
|
|
|
(In thousands) |
|
|||||
|
Net sales |
|
$ |
|
|
|
$ |
|
|
|
Net income attributable to TTM Technologies, Inc. stockholders |
|
|
|
|
|
|
|
|
|
Basic earnings per share |
|
$ |
|
|
|
$ |
|
|
|
Dilutive earnings per share |
|
$ |
|
|
|
$ |
|
|
|
(22) |
Subsequent Events |
In December 2019, a strain of coronavirus surfaced in China. As a result, there have been numerous factory closures. While many factories were closed for a few days because of the Chinese New Year holiday, the Chinese government ordered that businesses in various areas extend the Chinese New Year holiday due to the coronavirus outbreak. Moreover, because of the current restrictions on travel in China, the Company’s employees are affected and the Company experienced labor shortages. Also, it is possible that the Chinese government will announce new closures in the future. Some of the Company’s suppliers and customers in China have similarly been affected and experienced closures and risks of labor shortages. If these suppliers experience additional closures in the future, the Company may have difficulty sourcing materials necessary to fulfill production requirements and meet scheduled shipments, which will negatively affect revenues. Even if the Company is able to find alternate sources for such materials, they may cost more, which will affect profitability. If the Company’s customers in China experience additional closures in the future and are not able to accept orders or if they delay or cancel such orders, revenues will be negatively affected. At this point in time, there is significant uncertainty relating to the potential effect of the coronavirus on the Company’s business. Infections may become more widespread and there might be additional factory closures in the future, all of which will have a negative impact on the Company’s business, financial condition and operating results. As a result of this disruption, the Company’s financial results for the first quarter of 2020 will be negatively affected.
On January 19, 2020, the Company entered into a definitive equity interests purchase agreement for the sale of the Company’s following subsidiaries: Shanghai Kaiser Electronics Co., Ltd. (SKE), Shanghai Meadville Electronics Co., Ltd. (SME), Shanghai Meadville Science & Technology Co., Ltd. (SP) and Guangzhou Meadville Electronics Co., Ltd. (GME) (collectively, the Mobility business unit) for a base purchase price of $
97