10-K: Annual report pursuant to Section 13 and 15(d)
Published on February 25, 2016
Table of Contents
UNITED STATES SECURITIES AND EXCHANGE COMMISSION
Washington, D.C. 20549
Form 10-K
ANNUAL REPORT PURSUANT TO SECTION 13 OR 15(d)
OF THE SECURITIES EXCHANGE ACT OF 1934
For the fiscal year ended December 28, 2015
Commission file number 0-31285
TTM TECHNOLOGIES, INC.
(Exact Name of Registrant as Specified in Its Charter)
| Delaware | 91-1033443 | |
| (State or Other Jurisdiction of Incorporation or Organization) |
(I.R.S. Employer Identification No.) |
|
| 1665 Scenic Avenue Suite 250, Costa Mesa, California |
92626 (Zip Code) |
|
| (Address of Principal Executive Offices) |
(714) 327-3000
(Registrants telephone number, including area code)
Securities registered pursuant to Section 12(b) of the Exchange Act:
| Title of Each Class |
Name of Each Exchange on Which Registered |
|
| Common Stock, $0.001 par value |
Nasdaq Global Select Market |
Indicate by check mark if the registrant is a well-known seasoned issuer, as defined in Rule 405 of the Securities Act. Yes ¨ No þ
Indicate by check mark if the registrant is not required to file reports pursuant to Section 13 or 15(d) of the Act. Yes ¨ No þ
Indicate by check mark whether the registrant: (1) has filed all reports required to be filed by Section 13 or 15(d) of the Securities Exchange Act of 1934 during the preceding 12 months (or for such shorter period that the registrant was required to file such reports), and (2) has been subject to such filing requirements for the past 90 days. Yes þ No ¨
Indicate by check mark whether the registrant has submitted electronically and posted on its corporate Web site, if any, every Interactive Data File required to be submitted and posted pursuant to Rule 405 of Regulation S-T (§232.405 of this chapter) during the preceding 12 months (or for such shorter period that the registrant was required to submit and post such files). Yes ¨ No þ
Indicate by check mark if disclosure of delinquent filers pursuant to Item 405 of Regulation S-K (§229.405 of this chapter) is not contained herein, and will not be contained, to the best of registrants knowledge, in definitive proxy or information statements incorporated by reference in Part III of this Form 10-K or any amendment to this Form 10-K. þ
Indicate by check mark whether the registrant is a large accelerated filer, an accelerated filer, a non-accelerated filer, or a smaller reporting company. See the definitions of large accelerated filer, accelerated filer and smaller reporting company in Rule 12b-2 of the Exchange Act.
| Large accelerated filer þ |
Accelerated filer ¨ | Non-accelerated filer ¨ | Smaller reporting company ¨ | |||
| (Do not check if a smaller reporting company) |
||||||
Indicate by check mark whether the registrant is a shell company (as defined in Rule 12b-2 of the Act). Yes ¨ No þ
The aggregate market value of Common Stock held by non-affiliates of the registrant (based on the closing price of the registrants Common Stock as reported on the Nasdaq Global Select Market on June 29, 2015, the last business day of the most recently completed second fiscal quarter), was $708,483,813 . For purposes of this computation, all officers, directors, and 10% beneficial owners of the registrant are deemed to be affiliates of the registrant. Such determination should not be deemed to be an admission that such officers, directors, or 10% beneficial owners are, in fact, affiliates of the registrant.
As of February 18, 2016, there were outstanding 99,431,192 shares of the registrants Common Stock, $0.001 par value.
DOCUMENTS INCORPORATED BY REFERENCE
Portions of the registrants definitive Proxy Statement for its 2016 Annual Meeting of Stockholders are incorporated by reference into Part III of this report. Such Proxy Statement will be filed with the Securities and Exchange Commission within 120 days after the end of the fiscal year to which this report relates.
Table of Contents
TTM TECHNOLOGIES, INC.
ANNUAL REPORT ON FORM 10-K
2
Table of Contents
PART I
Statement Regarding Forward-Looking Statements
This report on Form 10-K contains forward-looking statements regarding future events or our future financial and operational performance. Forward-looking statements include statements regarding markets for our products; trends in net sales, gross profits and estimated expense levels; liquidity and anticipated cash needs and availability; and any statement that contains the words anticipate, believe, plan, forecast, foresee, estimate, project, expect, seek, target, intend, goal and other similar expressions. The forward-looking statements included in this report reflect our current expectations and beliefs, and we do not undertake publicly to update or revise these statements, even if experience or future changes make it clear that any projected results expressed in this annual report or future quarterly reports to stockholders, press releases or company statements will not be realized. In addition, the inclusion of any statement in this report does not constitute an admission by us that the events or circumstances described in such statement are material. Furthermore, we wish to caution and advise readers that these statements are based on assumptions that may not materialize and may involve risks and uncertainties, many of which are beyond our control that could cause actual events or performance to differ materially from those contained or implied in these forward-looking statements. These risks and uncertainties include the business and economic risks described in Item 1A Risk Factors.
Unless otherwise indicated or unless the context requires otherwise, all references in this document to TTM, our company, we, us, our, and similar names refer to TTM Technologies, Inc. and its subsidiaries.
| ITEM 1. | BUSINESS |
General
We are a leading global printed circuit board (PCB) manufacturer, focusing on quick-turn and technologically advanced PCBs and electro-mechanical solutions (E-M Solutions). We are the largest PCB manufacturer in North America and one of the largest PCB manufacturers in the world, in each case based on revenue, according to the 2014 rankings from N.T. Information LTD (NTI). In 2015 we generated $2.1 billion in net sales and ended the year with approximately 29,570 employees worldwide. We operate a total of 28 specialized facilities in the United States, the Peoples Republic of China (China), Canada and Mexico. We focus on providing time-to-market and advanced technology products and offer a one-stop manufacturing solution to our customers from engineering support to prototype development through final volume production. This one-stop manufacturing solution allows us to align technology development with the diverse needs of our customers and to enable them to reduce the time required to develop new products and bring them to market. We serve a diversified customer base consisting of approximately 1,500 customers in various markets over a wide range of end products throughout the world, including networking/communications infrastructure equipment, mobile devices such as smartphones, tablets and ultra notebooks, aerospace and defense systems, automotive controls and information systems, high-end computing, and medical, industrial and instrumentation related products. Our customers include both original equipment manufacturers (OEMs) and electronic manufacturing services (EMS) providers.
As a result of our acquisition of Viasystems Group, Inc., we now manage our worldwide operations based on two reportable operating segments: (1) PCB, which consists of 15 domestic PCB fabrication plants, including a facility that provides follow-on value-added services primarily for one of the PCB fabrication plants; eight PCB fabrication plants in China and one in Canada, and (2) E-M Solutions, which consists of four custom electronic assembly plants; three in China and one in Mexico. Each segment operates predominantly in the same industry with production facilities that produce customized products for our customers and use similar means of product distribution. See Note 19 of the Notes to Consolidated Financial Statements.
As part of our integration strategy to improve total plant utilization, operational performance and customer focus following our recent acquisition of Viasystems Group, Inc., two domestic PCB fabrication plants and the custom electronic assembly plant in Mexico are scheduled to close during the first half of 2016.
3
Table of Contents
Acquisition of Viasystems Group, Inc.
On May 31, 2015, we completed the acquisition of Viasystems Group, Inc. (Viasystems), for total consideration of $248.8 million in cash and 15.1 million shares of TTM common stock with a fair value of $149.0 million, to acquire all of the outstanding shares of capital stock and other equity rights of Viasystems. Additionally, in connection with the completion of the acquisition, we assumed and refinanced Viasystems debt, which was approximately $669.0 million as of May 31, 2015. Viasystems was a worldwide provider of complex multi-layer rigid, flexible, and rigid-flex PCBs and custom electronic assemblies. Viasystems products were found in a wide variety of commercial products, including automotive engine controls, hybrid converters, automotive electronics for navigation, safety, and entertainment, telecommunications switching equipment, data networking equipment, computer storage equipment, semiconductor test equipment, wind and solar energy applications, off-shore drilling equipment, communications applications, flight control systems, and complex industrial, medical, and other technical instruments. Viasystems E-M Solutions services were bundled with its PCB products to provide an integrated solution to customers. Viasystems operated 15 manufacturing facilities worldwide: eight in the United States, five in the Peoples Republic of China (China), and one each in Canada and Mexico. Viasystems served a diversified customer base of over 1,000 customers in various markets throughout the world.
Industry Overview
PCBs are manufactured in panels from sheets of laminated material. Each panel is typically subdivided into multiple PCBs, each consisting of a pattern of electrical circuitry etched from copper to provide an electrical connection between the components mounted to it. PCBs serve as the foundation for virtually all electronic products, ranging from consumer electronics products (such as cameras, smartphones, and tablets) to high-end commercial electronic equipment (such as medical instruments, data communications equipment and servers) and aerospace and defense electronic systems.
In recent years, the demand for smaller sized electronic devices with more features and functionality has been increasing. Products designed to offer faster data transmission, thinner and more lightweight packaging, and reduced power consumption generally require increasingly complex PCBs to meet these criteria. By using High Density Interconnect (HDI) technology, circuit densities can be increased, thereby providing for smaller products with higher packaging densities. Furthermore, flexible circuits technology, which includes flexible circuits, rigid-flex circuits, and flex assemblies, and substrate PCBs, can be found in small and lightweight mobile devices, such as smartphones, tablets and ultra notebooks and also increasingly are used in other end markets such as automotive, medical, and aerospace and defense. We collectively refer to these new technologies as advanced technologies, and they have growth rates that are typically higher than other PCB products that we refer to as conventional technologies.
According to estimates in a November 2015 report by Prismark Partners LLC (Prismark Partners), worldwide demand for PCBs was approximately $56.4 billion in 2015, and worldwide PCB revenue is expected to increase at a rate of 2.0% in 2016. Of the worldwide demand for production in 2015, the Americas accounted for approximately 5% (approximately $3 billion), China accounted for approximately 47% (approximately $26.2 billion), and the rest of the world accounted for approximately 48% (approximately $27.3 billion), according to estimates by Prismark Partners. While Prismark Partners expects long-term growth to occur in all PCB technologies, they forecast more robust growth in the HDI, flexible and rigid-flex segments. This growth expectation stems from the increase in the number of applications that can utilize, and in many cases require, smaller, denser interconnects.
The PCB manufacturing business is highly fragmented. According to a 2015 report by NTI, a PCB industry research firm, there were approximately 2,400 PCB manufacturers worldwide at the end of the first half of 2015, with the top 20 companies representing approximately 45% of the global market (by revenue) in 2014. As a result of global economic trends, the number of PCB producers operating in China has increased significantly since 2000. This corresponds with a significant decline in the number of North American and European PCB producers during the same time period.
4
Table of Contents
Industry Trends
We believe that several trends are impacting the PCB manufacturing industry. These trends include:
Shorter electronic product life cycles. Rapid advances in technology have shortened the life cycles of complex commercial electronic products, placing greater pressure on OEMs to quickly bring new products to market. The accelerated time-to-market and ramp-to-volume needs of OEMs for high-end commercial equipment create opportunities for PCB manufacturers that can offer engineering support in the prototype stage and manufacturing scalability throughout the production life cycle.
Increasing complexity of electronic products. OEMs continue to design higher performance electronic products which take advantage of advances in semiconductor technology. In turn, this requires technologically complex PCBs that can accommodate higher speeds and component densities, often found in HDI, flexible, and substrate PCBs. These complex PCBs can also require very high layer counts, miniaturized circuit connections, advanced manufacturing processes and materials, and high-mix production capabilities, which involve processing small lots in a flexible manufacturing environment.
Increasing concentration of global PCB production in Asia. In recent years, many electronics manufacturers have moved their commercial production to Asia to take advantage of its large and relatively lower cost labor pool and well-developed electronics infrastructure. In particular, the trend has favored China, which was expected to be the largest PCB market in terms of revenue in 2015 according to NTI. China has emerged as a global production center for cellular phones, smartphones, tablets, computers and computer peripherals, and high-end consumer electronics. According to Prismark Partners, approximately 91% of the worlds PCB production for 2015 was estimated to come from Asia, in part due to proximity to the regions expansive electronic manufacturing operations. We believe that the expected continued concentration of consumer electronic production in China should result in additional commercial market share potential for PCB manufacturers with a strong presence and reputation in China.
Decreased reliance on multiple PCB manufacturers by commercial OEMs. Commercial OEMs traditionally have relied on multiple PCB manufacturers to provide different services as an electronic product progresses through its life cycle. The physical transfer of a product among different PCB manufacturers often results in increased costs and inefficiencies due to potentially incompatible technologies and manufacturing processes, which results in production delays. In addition, commercial OEMs generally find it easier and less costly to manage fewer PCB manufacturers. As a result, commercial OEM and EMS providers often reduce the number of PCB manufacturers and providers on which they rely, presenting an opportunity for those that can offer one-stop manufacturing capabilities from prototype to volume production.
Our Strategy
Our goal is to be the leading global provider of time-critical, one-stop manufacturing services for highly complex PCBs. Our core strategy includes the following elements:
Maintain our customer-driven culture and provide superior service to our customers in our core markets of networking communications, automotive, mobile devices, aerospace and defense and medical, industrial and instrumentation. Our customer-oriented culture is designed to achieve extraordinary service, competitive differentiation, and superior execution. Our customer-oriented strategies include engaging in co-development of new products, capturing new technology products for next generation equipment, and continuing to invest in and enhance our broad offering of PCB technologies. Our ability to anticipate and meet customers needs is critical to retaining existing customers and attracting leading companies as new customers.
Drive operational efficiency and productivity. We are constantly focused on improving our operational execution to increase efficiency, productivity and yields. We strongly believe in the benefits of sharing best practices across our extensive manufacturing footprint and rely on stringent goals for throughput, quality and customer satisfaction to measure our effectiveness. The fast paced nature of our business requires a disciplined approach to manufacturing that is rooted in continuous improvement.
Accelerate customer and end market diversification through strategic mergers and acquisitions. TTM has a history of successful acquisitions that have been key to our growth and profitability. We continuously look
5
Table of Contents
for strategic opportunities that could facilitate our efforts to diversify into other growing end markets including automotive and medical/industrial/instrumentation end markets. Our recent acquisition of Viasystems which has increased our diversification into automotive and medical/industrial/instrumentation end markets demonstrates our commitment to this strategy.
Accelerate our expansion into the automotive and other growing markets using our advanced technology position to differentiate our operations. With rising requirements for faster data transmission, shrinking features (i.e., lightweight and thin), and lower power consumption, many PCB designs have migrated to more complex HDI PCBs from conventional multi-layer PCB technologies. This trend began with PCBs used in portable devices such as smartphones and tablets, but has become an increasing trend in other end markets, such as automotive, networking/communications, industrial, and aerospace and defense. We are focused in particular on the automotive opportunity where the Viasystems acquisition brings us strong market access to major automotive OEM part suppliers. The combination of the strength of Viasystems in highly reliable conventional PCBs and TTMs advanced technology PCBs meet our automotive customers growing demand in such areas as infotainment, radar systems for sensors, cameras for advanced driver assistance systems (ADAS) and electric vehicles. As our customers consolidate their supply chain, our objective is to emerge as a supplier with the technology breadth to meet most or all of our automotive customers PCB requirements.
Address customer needs in all stages of the product life cycle. By providing a one-stop solution, we work to service our customers needs from the earliest stages of product development through volume production. We believe that by servicing our customers early in the development process, we are able to demonstrate our capabilities and establish an incumbent position early in the product development cycle, which translates into additional opportunities as our customers move into volume production. Our expertise is enhanced by our ability to deliver highly complex PCBs to customers in significantly compressed lead times. This rapid delivery service enables OEMs to develop sophisticated electronic products more quickly and reduce their time to market.
Deliver strong financial performance and delever the balance sheet. Our strategy is to be a company that delivers industry-leading financial performance. We expect to achieve this by servicing our customers needs in higher-growth end markets meeting their product needs in a cost-efficient and effective manner. We believe that this strategy will allow us to generate strong cash flows which will enable us to reduce financial leverage while at the same time providing us with the financial flexibility to continue to invest in our business.
Products and Services
We offer a wide range of PCB products and electro-mechanical solutions, including HDI PCBs, conventional PCBs, flexible PCBs, rigid-flex PCBs, custom assemblies, and IC substrates. We also offer certain value-added services to support our customers needs. These include design for manufacturability (DFM), PCB layout design, simulation and testing services, and quick turnaround (QTA) services. By providing these value-added services to customers, we are able to provide our customers with a one-stop manufacturing solution, which enhances our relationships with our customers.
Conventional PCBs
A conventional PCB is made from a composite laminate that is metalized with a conductive material such as copper. The PCB becomes an electrical circuit when electronic components are attached to it. It is the basic platform used to interconnect components in most electronic products including computers, communications equipment, cellular phones, high-end consumer electronics, automotive controls and medical and industrial equipment. Conventional PCBs can be classified as single-sided, double-sided and multi-layer boards.
We focus on high layer count conventional PCBs. A multi-layer PCB can accommodate more complex circuitry than a single-sided or double-sided PCB and as such requires more sophisticated production techniques. The number of layers comprising a PCB often increases with the complexity of the end product. For example, a simple consumer device such as a garage door controller may use a single-sided or double-sided PCB, while a high-end network router or computer server may use a PCB with 30 layers or more.
6
Table of Contents
High density interconnect or HDI PCBs
Our facilities in North America and Asia Pacific can produce HDI PCBs, which are PCBs with higher interconnect density per unit area requiring more sophisticated technology and manufacturing processes for their production than conventional PCB products. HDI PCBs are boards with high-density characteristics including micro-sized holes, or microvias (diameter at or less than 0.15 mm), and may also include fine lines (circuit line width and spacing at or less than 0.075 mm) and fabricated with thin high performance materials, thereby enabling more interconnection functions per unit area. HDI PCBs generally are manufactured using a sequential build-up process in which circuitry is formed in the PCB one layer at a time through successive drilling, plating and lamination cycles. In general, a boards complexity is a function of interconnect and circuit density, layer count, laminate material type and surface finishes. As electronic devices have become smaller and more portable with higher functionality, demand for advanced HDI PCB products has increased dramatically. We define advanced HDI PCBs as those having more than one layer of microvia interconnection structure.
Flexible PCBs
Flexible PCBs are printed circuits produced on flexible films, allowing them to be folded or bent to fit the available space or allow relative movement. We manufacture circuits on flexible substrates that can be installed in three-dimensional applications for electronic packaging systems. Use of flexible circuitry can enable improved reliability, improved electrical performance, reduced weight and reduced assembly costs when compared with traditional wire harness or ribbon cable packaging. Flexible PCBs can provide flexible electronic connectivity of an electrical devices apparatus such as printer heads, cameras, camcorders, TVs, mobile handsets, and tablets. For some of our flexible PCB customers we also assemble components onto the flexible PCBs we manufacture.
Rigid-flex PCBs
Rigid-flex circuitry provides a simple means to integrate multiple PCB assemblies and other elements such as display, input or storage devices without wires, cables or connectors, replacing them with thin, light composites that integrate wiring in ultra-thin, flexible ribbons between rigid sections. In rigid-flex packaging, a flexible circuit substrate provides a backbone of wiring with rigid multilayer circuit sections built up as modules where needed.
Since the ribbons can be bent or folded, rigid-flex provides a means to compactly package electronics in three dimensions with dynamic or static bending functions as required, enabling miniaturization and thinness of product design. The simplicity of rigid-flex integration also generally reduces the number of parts required, which can improve reliability. The increasing popularity of mobile electronics coupled with the design trend of developing increasingly thinner, lighter and more feature-rich products is expected to further drive growth in the rigid-flex and flex sector, where these PCBs are the backbone of miniaturization.
Rigid-flex technology is essential to a broad range of applications including aerospace, industrial and transportation systems requiring high reliability; hand-held and wearable electronics such as mobile phones, video cameras and music players where thinness and mechanical articulation are essential; and ultra-miniaturized products such as headsets, medical implants and semiconductor packaging where size and reliability are paramount.
Custom assemblies & system integration
Our assembly facilities produce custom electronic assemblies as well as fully integrated electronic systems. Custom electronic assemblies refer to a variety of PCB assemblies such as backplane and midplane assemblies, flexible and rigid-flex assemblies and RF assemblies. Each of these assemblies involves mounting electronic components to a printed circuit board and then testing the assembly for electrical continuity. Our services also go beyond the PCB assembly to fully integrated systems. A fully integrated system often includes installing the PCB assembly into a metal enclosure and adding fans for cooling the system, a power supply and cable assemblies to create a fully assembled and tested system that will be shipped to our customers.
7
Table of Contents
IC substrates
IC substrates provide mechanical support and electrical interconnect for very small ICs (integrated circuits or semiconductors) and up to comparatively larger PCBs for assembly into electronic end products such as memory modules, cellular phones, digital cameras, automotive GPS and engine controls. IC substrates, also known as chip carriers, are highly miniaturized circuits manufactured by a process largely similar to that for PCBs but requiring the use of ultra-thin materials and including micron-scale features, because they must bridge the gap between sub-micron IC features and millimeter scale PCBs. Consequently, IC substrates are generally manufactured in a semiconductor-grade clean room environment to ensure products are free of defects and contamination.
IC substrates are a basic component of IC packages which, combined with other electronic components in an assembly, control functions of an electronic appliance. IC packages can be broadly divided into single chip modules (or SCMs) and multi-chip modules (or MCMs), with the former containing one IC chip, and the latter containing multiple chips and other electronic components.
Quick turnaround services
We refer to our rapid delivery services as quick turnaround or QTA, because we provide custom-fabricated PCBs to our customers within as little as 24 hours to ten days. As a result of our ability to rapidly and reliably respond to the critical time requirements of our customers, we generally receive premium pricing for our QTA services as compared to standard lead time prices.
| | Prototype production. In the design, testing, and launch phase of a new electronic products life cycle, our customers typically require limited quantities of PCBs in a very short period of time. We satisfy this need by manufacturing prototype PCBs in small quantities, with delivery times ranging from as little as 24 hours to ten days. |
| | Ramp-to-volume production. After a product has successfully completed the prototype phase, our customers introduce the product to the market and require larger quantities of PCBs in a short period of time. This transition stage between low-volume prototype production and volume production is known as ramp-to-volume. Our ramp-to-volume services typically include manufacturing up to a few hundred PCBs per order with delivery times ranging from five to 15 days. |
RF and microwave circuits
We produce and test specialized circuits used in radio-frequency or microwave emission and collection applications. These products are typically used for radar, transmit/receive antennas and similar wireless applications. Markets for these products include automotive, defense, avionics, satellite, and commercial applications. The manufacture of these products requires advanced materials, equipment, and methods that are highly specialized and distinct from conventional printed circuit manufacturing techniques. We also offer specialized radio-frequency assembly and test services.
Thermal management
Increased component density on circuit boards often requires improved thermal dissipation to reduce operating temperatures. We produce printed circuits with heavy copper cores and both embedded and press-fit coins. In addition, we produce printed circuit boards with electrically passive heat sinks laminated externally on a circuit board or between two circuit boards, as well as printed circuit boards with electrically active thermal cores.
Manufacturing Technologies
The market for our products is characterized by rapidly evolving technology. In recent years, the trend in the electronic products industry has been to increase the speed, complexity, and performance of components while reducing their size. We believe our technological capabilities allow us to address the needs of manufacturers to bring complicated electronic products to market faster.
8
Table of Contents
To manufacture PCBs, we generally receive circuit designs directly from our customers in the form of computer data files, which we review to ensure data accuracy and product manufacturability. Processing these computer files with computer aided manufacturing (CAM) technology, we generate images of the circuit patterns that we then physically develop on individual layers, using advanced photographic processes. Through a variety of plating and etching processes, we selectively add and remove conductive materials to form horizontal layers of thin circuitry, which are separated by electrical insulating material. A multilayer circuit board is produced by laminating together multiple layers of circuitry, using intense heat and pressure under vacuum. Vertical connections between layers are achieved by drilling and plating through small holes, called vias. Vias are made by highly specialized drilling equipment capable of achieving extremely fine tolerances with high accuracy. We specialize in high layer count PCBs with extremely fine geometries and tolerances. Because of the tolerances involved, we employ clean rooms in certain manufacturing processes where tiny particles might otherwise create defects on the circuit patterns. We also use automated optical inspection systems and electrical testing systems to ensure consistent quality of the circuits we produce.
We believe that our highly specialized equipment and advanced manufacturing processes enable us to reliably produce PCBs with the following characteristics:
| | High layer count. Manufacturing PCBs with a large number of layers is difficult to accomplish due to the accumulation of manufacturing tolerances and registration systems required. In our PCB operating segment, we regularly manufacture PCBs with more than 30 layers on a quick-turn and volume basis. Approximately 13% of our 2015 PCB net sales involved the manufacture of PCBs with at least 18 layers or more, compared to 16% in 2014. |
| | Blind and buried vias. Vias are drilled holes that provide electrical connectivity between layers of circuitry in a PCB. Blind vias connect the surface layer of the PCB to an internal layer and terminate at the internal layer. Buried vias are holes that do not reach either surface of the PCB but allow inner layers to be interconnected. Products with blind and buried vias can be made thinner, smaller, lighter and with higher component density and more functionality than products with traditional vias. |
| | Microvias. HDI technology utilizes microvias, which are small vias with diameters generally less than 0.005 inches after plating. Advanced HDI products may also require the microvias to be fully filled using a specialized plating process so that additional microvia structures can be stacked on top to form more complex interconnections. These microvias consume much less space on the layers they interconnect, thereby providing for greater wiring densities and flexibility, and also providing closer spacing of components and their attachment pads. The fabrication of PCBs with microvias requires specialized equipment, such as laser drills, and highly developed process knowledge. Applications such as handheld wireless devices employ microvias to obtain a higher degree of functionality from a given surface area. |
| | Embedded passives. Embedded passive technology involves embedding either the capacitive or resistive elements inside the PCB, which allows for removal of passive components from the surface of the PCB and thereby leaves more surface area for active components. Use of this technology provides greater surface area for surface-mounted ICs and better signal performance, as well as increased functionality of products with higher component density. |
| | Fine line traces and spaces. Traces are the connecting copper lines between the different components of the PCB, and spaces are the distances between traces. The smaller the traces and the tighter the spaces, the higher the density on the PCB and the greater the expertise required to achieve a desired final yield on an order. We are able to manufacture PCBs with traces and spaces less than 0.002 inches. |
| | High aspect ratios. The aspect ratio is the ratio between the thickness of the PCB and the diameter of a drilled hole. As the aspect ratio increases, it becomes difficult to reliably form, electroplate and finish all the holes on a PCB. In production, we are able to provide aspect ratios of up to 30:1. |
| | Thin core processing. A core is the basic inner-layer building block material from which PCBs are constructed. A core consists of a flat sheet of material comprised of glass-reinforced resin with copper foil laminated on either side. The thickness of inner-layer cores is typically determined by the overall thickness of the PCB and the number of layers required. The demand for thinner cores derives from the |
9
Table of Contents
| requirements for thinner PCBs, higher layer counts and various electrical parameters. Core thickness in our PCBs ranges from as little as 0.002 inches up to 0.062 inches. |
| | Advanced hole fill process. Our advanced hole fill processes provide designers the opportunity to increase the density of component placements by reducing the surface area required to place many types of components. In traditional design, components are routed from their surface interfaces through via connections in order to access power and ground connections and the internal circuitry used to connect to other discrete components. Our advanced hole fill processes provide methods to allow for vias to be placed inside their respective surface mount pads by filling the vias with a thermoset epoxy and plating flat copper surface mount pads directly over the filled hole. |
| | Advanced materials. We manufacture circuit boards using a wide variety of advanced dielectric materials. These high-performance materials offer electrical, thermal, and long-term reliability advantages over conventional materials but are more difficult to manufacture. We are certified by Underwriters Laboratories to manufacture PCBs using many types and combinations of these specialty materials. This wide offering allows us to manufacture complex boards for niche and high-end commercial and aerospace and defense markets. |
Customers and Markets
Our customers include both OEMs and EMS companies that primarily serve the networking/communications, cellular phone, computing, aerospace and defense, and medical/industrial/instrumentation end markets of the electronics industry. Included in the end markets that our OEM and EMS customers serve is the U.S. government. As a result, we are a supplier, primarily as a subcontractor, to the U.S. government.
The following table shows the percentage of our net sales in each of the principal end markets we served for the periods indicated:
| End Markets(1)(2) |
2015 | 2014 | 2013 | |||||||||
| Aerospace and Defense |
14 | % | 16 | % | 15 | % | ||||||
| Automotive(2) |
13 | 2 | 2 | |||||||||
| Cellular Phone(3) |
21 | 23 | 20 | |||||||||
| Computing/Storage/Peripherals(3) |
12 | 13 | 20 | |||||||||
| Medical/Industrial/Instrumentation/Other |
13 | 10 | 8 | |||||||||
| Networking/Communications |
25 | 33 | 32 | |||||||||
| Other(2)(3) |
2 | 3 | 3 | |||||||||
|
|
|
|
|
|
|
|||||||
| Total |
100 | % | 100 | % | 100 | % | ||||||
|
|
|
|
|
|
|
|||||||
| (1) | Sales to EMS companies are classified by the end markets of their OEM customers. |
| (2) | Certain reclassifications of prior year end market percentages have been made to conform to the current year presentation. Beginning 2015, Automotive has been reclassified from the Other end market. Additionally, beginning in the first quarter of 2013, we reclassified substrate PCBs, which were included in the Other end market, into the end markets that the substrate PCBs are sold into predominantly Cellular Phone. |
| (3) | Smartphones are included in the Cellular Phone end market, tablets are included in the Computing/Storage/Peripherals end market and other mobile devices such as e-readers are included in the Other end market. |
| (4) | Amounts include 211 days of activity of Viasystems, which we acquired on May 31, 2015. |
Sales attributable to our five largest OEM customers, which can vary from year to year, collectively accounted for 37%, 44%, and 41%, of our net sales in fiscal years 2015, 2014 and 2013, respectively. Our five largest OEM customers in 2015 were, in alphabetical order, Apple Inc., Cisco Systems, Inc., Huawei Technology Co. Ltd., Juniper Networks, Inc., and Robert Bosch GmbH. For the year ended December 28, 2015, Apple accounted for 20% of our net sales. Sales attributed to OEMs include sales made through EMS providers. Sales to EMS providers comprised approximately 35%, 39%, and 38% of our net sales in fiscal years 2015, 2014 and 2013, respectively. Although our contractual relationships are with the EMS companies, we typically negotiate price and volume
10
Table of Contents
requirements directly with the OEMs. In addition, we are on the approved vendor lists of several of our EMS providers. This positions us to participate in business that is awarded at the discretion of the EMS provider.
During fiscal years 2015, 2014 and 2013, our net sales by country invoiced were as follows:
| Country |
2015 | 2014 | 2013 | |||||||||
| United States |
46 | % | 43 | % | 42 | % | ||||||
| China |
26 | 27 | 29 | |||||||||
| Other |
28 | 30 | 29 | |||||||||
|
|
|
|
|
|
|
|||||||
| Total |
100 | % | 100 | % | 100 | % | ||||||
|
|
|
|
|
|
|
|||||||
Net sales to other countries, individually, for the fiscal years 2015, 2014 and 2013, did not exceed 10% of total net sales.
Our sales and marketing strategy focuses on building long-term relationships with our customers engineering and new product introduction personnel early in the product development phase, frequently through strategic account management teams. As the product moves from the prototype stage through ramp-to-volume and volume production, we shift our focus to the customers procurement departments in order to capture sales at each point in the products life cycle.
Our staff of engineers, sales support personnel, and managers assists our sales representatives in advising customers with respect to manufacturing feasibility, design review, and technological capabilities through direct communication and visits. We combine our sales efforts with customer service at each facility to better serve our customers. Each large customer is typically assigned an account manager to coordinate all of the companys services across all of our facilities. Additionally, the largest and most strategic customers are also supported by selected program management and engineering resources. Our global sales force is comprised of direct sales personnel, complemented by commission-based independent representatives, and supports customers throughout North America, Europe, Asia and the Middle East.
Our domestic North America footprint comprises a significant amount of our PCB operating segment with sixteen PCB fabrication plants located in California, Colorado, Connecticut, Ohio, Oregon, Utah, Virginia, Wisconsin and Ontario, Canada. The footprint includes a facility that provides follow-on value-added assembly services primarily to our Connecticut PCB fabrication plant; an outsourcing operation that provides brokered sourcing of lower cost, off-shore PCB companies as an additional option for our customers; and a custom electronic assembly facility in Mexico that is part of our E-M Solutions segment. As part of our integration strategy to improve total plant utilization, operational performance and customer focus following our recent acquisition of Viasystems, two domestic PCB fabrication plants and the custom electronic assembly plant in Mexico are scheduled to close during the first half of 2016.
Our Asia Pacific footprint includes facilities from both our PCB and E-M Solutions operating segment with eight PCB fabrication plants located in Hong Kong, Huiyang, Dongguan, Guangzhou, Shanghai, and Zhongshan China, and three custom assembly and system integration operations in Shanghai and Shenzhen China.
For information regarding credit to customers, see Note 12 of the Notes to Consolidated Financial Statements.
For information about net sales, income before income taxes, depreciation, total assets and capital expenditures of each of our segments, and geographical information, including net sales to customers and long-lived assets, see Note 19 of the Notes to Consolidated Financial Statements.
Suppliers
The primary raw materials we use in PCB manufacturing include copper-clad laminate; chemical solutions such as copper and gold for plating operations; photographic film; carbide drill bits; and plastic for testing fixtures. Although we have preferred suppliers for some raw materials used in the manufacture of PCBs, most of our raw materials are generally readily available in the open market from numerous other potential suppliers.
11
Table of Contents
The primary raw materials we use in backplane assemblies and other PCB assemblies are manufactured components such as PCBs, connectors, capacitors, resistors, diodes and integrated circuits, many of which are custom made and controlled by our customers approved vendors. These components for backplane assemblies and other PCB assemblies in some cases have limited or sole sources of supply. For example, in some instances our customers will require us to use a specific component from a particular supplier or require us to use a component provided by the customer itself, in which case we may have a single or limited number of suppliers for these specific components. The backplane assemblies, PCB assemblies and precision metal fabricated chassis and enclosures produced by us may be incorporated into a fully integrated and tested system delivered to our customer. These products often incorporate procured power, thermal, interconnect and mechanical components sourced from customer directed or our selected suppliers.
We typically use just-in-time procurement practices to maintain our raw materials inventory at low levels and work closely with our suppliers to obtain technologically advanced raw materials. In addition, we periodically seek alternative supply sources to ensure that we are receiving competitive pricing and service. Adequate amounts of all raw materials have been available in the past, and we believe this availability will continue into the foreseeable future.
Competition
Despite industry consolidation, the PCB industry remains fragmented and characterized by intense competition. Our principal PCB and substrate competitors include AT & S Austria Technologie & Systemtechnik AG, Chin Poon Industrial Co., LTD., Compeq Manufacturing Co., Ltd., IBIDEN Co., Ltd., ISU Petasys Co., Ltd., Multek Corporation, Sanmina Corporation, Tripod Technology Corp., Unimicron Technology Corp., and Wus Printed Circuit Co., Ltd. Our principal E-M Solutions competitors include Amphenol Corp, Flex, Jabil Circuit, Inc. and Sanmina Corporation.
We believe we compete favorably based on the following competitive factors:
| | status as a top global PCB manufacturer; |
| | capability and flexibility to produce technologically complex products; |
| | ability to offer a one-stop manufacturing solution; |
| | specialized and integrated manufacturing facilities; |
| | ability to offer time-to-market capabilities; |
| | leading edge aerospace and defense capabilities; |
| | flexibility to manufacture low volume, high-mix products; |
| | consistent high-quality product; and |
| | outstanding customer service. |
In addition, we believe our continuous evaluation and early adoption of new manufacturing and production technologies give us a competitive advantage. We believe that our ability to manufacture PCBs using advanced technologies, including our HDI, flexible PCBs and substrate capabilities, provides us with a competitive advantage over manufacturers that do not possess this advanced technological expertise. Our future success will depend in large part on our ability to maintain and enhance our manufacturing capabilities and production technologies.
Seasonality
As manufacturers of electronic components, orders for our products generally correspond to the production schedules of our customers. We historically experience higher net sales in the third and fourth quarters due to end customer demand in the fourth quarter for consumer electronics products. Seasonal fluctuations also include the Chinese New Year holidays in the first quarter, which typically results in lower net sales. We attribute this decline to shutdowns of our customers manufacturing facilities surrounding the Chinese New Year public holidays, which normally occur in January or February of each year.
12
Table of Contents
Backlog
Backlog consists of purchase orders received, including, in some instances, demand agreements released for production under customer contracts. We obtain firm purchase orders from our customers for all products. However, for some of these purchase orders, customers do not make firm schedules for delivery more than 90 days in advance. Therefore, we measure backlog as orders with deliveries scheduled over the next 90 days. At December 28, 2015, total backlog was $365.8 million, compared with $201.0 million at the end of 2014. Substantially all backlog at December 28, 2015 is expected to be converted to sales in the first quarter of 2016. Additionally, we typically experience a higher amount of backlog in the second half of the year due to increased end customer demand for consumer electronics products in the fourth quarter, which is consistent with our seasonal patterns as discussed above.
Intellectual Property
We believe our business depends on the effectiveness of our fabrication techniques and our ability to continue to improve our manufacturing processes. We have limited patent or trade secret protection for our manufacturing processes. We rely on the collective experience of our employees in the manufacturing process to ensure that we continuously evaluate and adopt the new technologies available in our industry. In addition, we depend on training, recruiting, and retaining our employees, who are required to have sufficient know-how to operate advanced equipment and to conduct complicated manufacturing processes.
National Security Matters
A portion of our business consists of manufacturing defense and defense-related items for various departments and agencies of the U.S. government, including the U.S. Department of Defense, or the DoD, which requires that we maintain facility security clearances under the National Industrial Security Program Operating Manual, or NISPOM. The NISPOM requires that a corporation with significant foreign ownership maintaining a facility security clearance take steps to mitigate foreign ownership, control or influence, referred to as FOCI. Pursuant to these laws and regulations, effective October 2010, we entered into a Special Security Agreement (SSA) with the DoD; Su Sih (BVI) Limited, or Su Sih (a significant foreign owner of our capital stock); and Mr. Tang Hsiang Chien (as the beneficial owner of Su Sih). The purpose of the SSA is to deny Mr. Tang, Su Sih, and other persons affiliated with our Asia Pacific operations, from unauthorized access to classified and export controlled unclassified information and to mitigate any influence over our business or management in a manner that could result in the compromise of classified information or could adversely affect the performance of classified contracts.
Other Governmental Regulations
Our operations, particularly those in North America, are subject to a broad range of regulatory requirements relating to export control, environmental compliance, waste management, and health and safety matters. In particular, we are subject to the following:
| | U.S. Department of State regulations, including the Arms Export Control Act (AECA) and International Traffic In Arms Regulations (ITAR) located at 22 CFR Parts 120-130; |
| | U.S. Department of Commerce regulations, including the Export Administration Regulations (EAR) located at 15 CFR Parts 730-744; |
| | Office of Foreign Asset Control (OFAC) regulations located at 31 CFR Parts 500-599; |
| | U.S. Occupational Safety and Health Administration (OSHA), and state OSHA and Department of Labor laws pertaining to health and safety in the workplace; |
| | U.S. Environmental Protection Agency regulations pertaining to air emissions; wastewater discharges; and the use, storage, discharge, and disposal of hazardous chemicals used in the manufacturing processes; the reporting of chemical releases to the environment; and the reporting of chemicals manufactured in by-products that are beneficially recycled; |
13
Table of Contents
| | Department of Homeland Security regulations regarding the storage of certain chemicals of interest; |
| | corresponding state laws and regulations, including site investigation and remediation; |
| | corresponding U.S. county and city agencies; |
| | corresponding regulations and agencies in China for our Chinese facilities; |
| | material content directives and laws that ban or restrict certain hazardous substances in products sold in member states of the European Union, China, other countries, and jurisdictions; |
| | SEC rules that require reporting of the use of certain metals from conflict minerals originating in the Democratic Republic of the Congo and the 9 countries surrounding it pursuant to Section 1502 of the Dodd-Frank Act; and |
| | reporting requirements of the California Transparency in Supply Chains Act of 2010 that requires reporting on efforts to eradicate slavery and human trafficking in retailers and manufacturers supply chains. |
The process to manufacture PCBs requires adherence to city, county, state, federal and foreign environmental regulations regarding the storage, use, handling and disposal of chemicals, solid wastes and other hazardous materials, as well as compliance with air quality standards and chemical use reporting. We believe that our facilities in the United States comply in all material respects with applicable environmental laws and regulations. In China, governmental authorities are taking various steps to tighten the rules and regulations governing environmental issues. An update to Chinese environmental waste water law was issued in late 2012, allowing for an interim period in which plants subject to such law may install equipment that meets the new regulatory regime. Our plants in China are not yet in full compliance with the current environmental regulations. We believe we have developed plans acceptable to the Chinese government, and we are in the process of implementing these plans. We do not anticipate any immediate risk of government fines or temporary closure of Chinese plants. We have established and enacted an investment plan related to the efforts to come into full compliance with the new regulations. There can be no assurance that violations will not occur in the future.
Employees
As of December 28, 2015, we had approximately 29,570 employees. Of our employees, approximately 27,100 were involved in manufacturing and engineering, 640 worked in sales and marketing, and approximately 1,830 worked in accounting, systems and other support capacities. None of our U.S. employees are represented by unions. In China, approximately 11,250 employees are members of the All-China Federation of Trade Unions and accordingly are considered to be represented by a labor union. We have not experienced any labor problems resulting in a work stoppage, except for a work stoppage associated with the announcement of the closure of our Suzhou, China facility in 2013, and we believe that we have good relations with our employees.
Availability of Reports Filed with the Securities and Exchange Commission
We are a Delaware corporation founded in 1998, with our principal executive offices located at 1665 Scenic Avenue, Suite 250, Costa Mesa, CA 92626. Our telephone number is (714) 327-3000. Our website address is www.ttm.com. Information included on our website is not incorporated into this report. Our annual reports on Form 10-K, quarterly reports on Form 10-Q, current reports on Form 8-K and amendments to those reports are available without charge on our website at www.ttm.com/investors/investor_sec.aspx, as soon as reasonably practicable after they are filed electronically with the Securities and Exchange Commission (SEC). Copies are also available without charge by (i) telephonic request by calling our Investor Relations Department at (714) 327-3000, (ii) e-mail request to investor@ttmtech.com, or (iii) a written request to TTM Technologies, Inc., Attention: Investor Relations, 1665 Scenic Avenue, Suite 250, Costa Mesa, CA 92626.
14
Table of Contents
| ITEM 1A. | RISK FACTORS. |
An investment in our common stock involves a high degree of risk. You should carefully consider the factors described below, in addition to those discussed elsewhere in this report, in analyzing an investment in our common stock. If any of the events described below occurs, our business, financial condition, and results of operations would likely suffer, the trading price of our common stock could fall, and you could lose all or part of the money you paid for our common stock. The risk factors described below are not the only ones we face. Risks and uncertainties not known to us currently, or that may appear immaterial, also may have a material adverse effect on our business, financial condition, and results of operations.
In addition, the following risk factors and uncertainties could cause our actual results to differ materially from those projected in our forward-looking statements, whether made in this annual report or future quarterly reports to stockholders, press releases, or oral statements, whether in presentations, responses to questions, or otherwise.
Risks Related to our Business
We have substantial outstanding indebtedness, and our outstanding indebtedness could adversely impact our liquidity and flexibility in obtaining additional financing, our ability to fulfill our debt obligations and our financial condition and results of operations.
We have substantial debt and, as a result, we have significant debt service obligations. On May 31, 2015, we entered into a $950.0 million Term Loan, a $150.0 million U.S. ABL, and a $150.0 million Asia ABL. We drew $80.0 million of the U.S. ABL at the closing of the acquisition of Viasystems. In addition, we and a number of our direct and indirect subsidiaries have various credit, letters of credit and guarantee facilities. The agreements governing these facilities have certain provisions that require us to repay borrowings in scheduled quarterly installments, which began on October 1, 2015. We may also be required to make an additional principal payment on an annual basis, based on certain parameters defined these agreements. For 2015, we are required to make an additional annual payment of $61.1 million, which is required to be paid in March 2016. Such agreements also contain certain financial covenants which require us to maintain a specified consolidated leverage ratio and under the occurrence of certain events, a consolidated fixed charge coverage ratio.
Our indebtedness could have important consequences to us and our shareholders because in certain circumstances we may need to comply with the covenants in the agreements governing such indebtedness and dedicate funds to service our outstanding debt. For example, it could:
| | make it more difficult for us to satisfy our obligations with respect to our indebtedness, which could in turn result in an event of default on such indebtedness; |
| | require us to use a substantial portion of our cash flow from operations for debt service payments, thereby reducing the availability of cash for working capital, capital expenditures, acquisitions and other general corporate purposes; |
| | impair our ability to obtain additional financing in the future for working capital, capital expenditures, acquisitions and other investments or general corporate purposes, which may limit our ability to execute our business strategy; |
| | diminish our ability to withstand a downturn in our business, the industry in which we operate or the economy generally and restrict us from exploiting business opportunities or making acquisitions; |
| | limit our flexibility in planning for, or reacting to, changes in our business and the industry in which we operate or the general economy; |
| | increase our vulnerability to general adverse economic and industry conditions, including movements in interest rates, which could result in increased borrowing costs; |
| | limit managements discretion in operating our business; and |
| | place us at a competitive disadvantage as compared to our competitors that have less debt as it could limit our ability to capitalize on future business opportunities and to react to competitive pressures or adverse changes. |
15
Table of Contents
We may be able to incur substantial additional debt in the future, some or all of which may be secured by a lien on our assets. If new debt or other liabilities or obligations are added to our current debt levels, the related risks that we and our subsidiaries now face could intensify.
Servicing our debt requires a significant amount of cash and we may not be able to generate sufficient cash to service all of our debt and may be forced to take other actions to satisfy our obligations under our debt, which may not be successful.
Our ability to make scheduled payments on or to refinance our debt obligations and to fund planned capital expenditures and expansion efforts depends on our ability to generate cash in the future and our financial condition and operating performance, which are subject to prevailing economic and competitive conditions and to certain regulatory, competitive, financial, business and other factors beyond our control. We cannot assure you that we will maintain a level of cash flows from operating activities sufficient to permit us to pay the principal, premium, if any, and interest on our debt.
If we are unable to meet our debt service obligations, we may be forced to reduce or delay investments or to sell assets, seek additional capital (which could include obtaining additional equity capital on terms that may be onerous or highly dilutive) or restructure or refinance our debt. These alternative measures may not be successful and may not permit us to meet our scheduled debt service obligations. Our operating results and available cash may in the future be insufficient to meet our debt service obligations. We could face substantial liquidity challenges and might be required to dispose of material assets or operations to meet our debt service and other obligations. We may not be able to consummate those dispositions or, if consummated, the proceeds of such dispositions may not be adequate to meet any debt service obligations then due.
We have pursued and intend to continue to pursue acquisitions of other businesses and may encounter risks associated with these activities, which could harm our business and operating results.
On May 31, 2015, we consummated the acquisition of Viasystems. This transaction and any other acquisitions we may pursue in the future involve numerous risks. As part of our business strategy, we expect that we will continue to grow by pursuing acquisitions of businesses, technologies, assets, or product lines that complement or expand our business. Risks related to an acquisition may include:
| | the potential inability to successfully integrate acquired operations and businesses or to realize anticipated synergies, economies of scale, or other expected value; |
| | diversion of managements attention from normal daily operations of our existing business to focus on integration of the newly acquired business; |
| | unforeseen expenses associated with the integration of the newly acquired business; |
| | difficulties in managing production and coordinating operations at new sites; |
| | the potential loss of key employees of acquired operations; |
| | the potential inability to retain existing customers of acquired companies when we desire to do so; |
| | insufficient revenues to offset increased expenses associated with acquisitions; |
| | the potential decrease in overall gross margins associated with acquiring a business with a different product mix; |
| | the inability to identify certain unrecorded liabilities; |
| | the potential need to restructure, modify, or terminate customer relationships of the acquired company; |
| | an increased concentration of business from existing or new customers; and |
| | the potential inability to identify assets best suited to our business plan. |
16
Table of Contents
Acquisitions may cause us to:
| | enter lines of business and/or markets in which we have limited or no prior experience; |
| | issue debt and be required to abide by stringent loan covenants; |
| | assume liabilities; record goodwill and indefinite-lived intangible assets that will be subject to impairment testing and potential periodic impairment charges; |
| | become subject to litigation and environmental issues, which include product material content certifications related to conflict minerals; |
| | incur unanticipated costs; |
| | incur large and immediate write-offs; and |
| | incur substantial transaction-related costs, whether or not a proposed acquisition is consummated. |
Acquisitions of high technology companies are inherently risky, and no assurance can be given that our recent or future acquisitions will be successful. Failure to manage and successfully integrate acquisitions we make could have a material adverse effect on our business, financial condition, and results of operations. Even when an acquired company has already developed and marketed products, product enhancements may not be made in a timely fashion. In addition, unforeseen issues might arise with respect to such products after any such acquisition.
Uncertainty and adverse changes in the economy and financial markets could have an adverse impact on our business and operating results.
Uncertainty or adverse changes in the economy could lead to a significant decline in demand for the end products manufactured by our customers, which, in turn, could result in a decline in the demand for our products and pressure to reduce our prices. As a result of the recent global economic downturn, many businesses appear to be experiencing weaker demand for their products and services and, as a result, are taking a more conservative stance in ordering component inventory. Any decrease in demand for our products could have an adverse impact on our financial condition, operating results and cash flows. Uncertainty and adverse changes in the economy could also increase the cost and decrease the availability of potential sources of financing and increase our exposure to losses from bad debts, either of which could have a material adverse effect on our financial condition, operating results and cash flows.
We may not fully realize the anticipated positive impacts to future financial results from our restructuring efforts.
In our Form 8-K filed on September 29, 2015, we announced restructuring plans that are designed to align capacity, overhead costs and operating expenses with market demand. Our ability to achieve the anticipated cost savings and other benefits from our restructuring efforts within expected time frames is subject to many estimates and assumptions, and may vary materially based on factors such as market conditions and the effect of our restructuring efforts on our work force. These estimates and assumptions are subject to significant economic, competitive and other uncertainties, some of which are beyond our control. There can be no assurance that we will fully realize the anticipated positive impacts to future financial results from our current or future restructuring efforts. If our estimates and assumptions are incorrect or if other unforeseen events occur, we may not achieve the cost savings expected from such restructurings, and our business and results of operations could be adversely affected.
We may not realize the anticipated cost savings from the acquisition of Viasystems or may incur additional costs because of integration difficulties and other challenges, which could materially adversely affect our business, financial condition, and results of operations.
On May 31, 2015, we closed our acquisition of Viasystems. The success of the acquisition of Viasystems will depend, in part, on our ability to integrate Viasystems business with our existing business and achieve efficiencies and cost savings, and no assurances can be given that we will be able to do so. For example, costs
17
Table of Contents
associated with Viasystems legal proceedings and other loss contingencies may be greater than expected. In addition, in order to obtain the benefits of the acquisition of Viasystems, we must integrate Viasystems operations. Such integration may be complex, and the failure to do so quickly and effectively may negatively affect earnings. The integration process may be complex, costly and time-consuming. The difficulties of integrating the operations of Viasystems business include, among others:
| | failure to implement our business plan for the combined business; |
| | unanticipated changes in applicable laws and regulations; |
| | failure to retain key employees; |
| | failure to retain customers; |
| | operating, competitive and market risks inherent in Viasystems business and our business; |
| | the impact of the acquisition of Viasystems on our internal controls and compliance with the regulatory requirements under the Sarbanes-Oxley Act of 2002; and |
| | unanticipated issues, expenses and liabilities. |
Although we expect to realize strategic, operational, and financial benefits as a result of the acquisition of Viasystems, we cannot be certain whether, and to what extent, such benefits will be achieved in the future. We may not accomplish the integration of Viasystems business smoothly, successfully or within the anticipated cost range or timeframe. The diversion of our managements attention from our current operations to the integration effort and any difficulties encountered in combining operations could prevent us from realizing the full benefits anticipated to result from the acquisition of Viasystems and could adversely affect our business, financial condition, and results of operations.
We have identified $55 million in annual cost savings, which are expected to be implemented within the first 12 months following the consummation of the acquisition of Viasystems. While our management believes these cost savings are achievable, our ability to achieve such estimated cost savings in the timeframe described is subject to various assumptions by management, which may or may not be realized. As a consequence, we may not be able to realize all of these cost savings within the time frame expected or at all. In addition, we may incur additional and/or unexpected costs in order to realize these cost savings.
We are subject to risks of currency fluctuations.
A portion of our cash and other current assets is held in currencies other than the U.S. dollar. As of December 28, 2015, we had an aggregate of approximately $217.4 million in current assets denominated in Chinese Renminbi (RMB) and the Hong Kong Dollar (HKD). Changes in exchange rates among other currencies and the U.S. dollar will affect the value of these assets as translated to U.S. dollars on our balance sheet. To the extent that we ultimately decide to repatriate some portion of these funds to the United States, the actual value transferred could be impacted by movements in exchange rates. Any such type of movement could negatively impact the amount of cash available to fund operations or to repay debt. To the extent that we may have outstanding indebtedness denominated in the U.S. dollar or in the HKD, the depreciation of the RMB against the U.S. dollar or the HKD may have a material adverse effect on our business, financial condition, and results of operations (including the cost of servicing, and the value on our balance sheet of, the U.S. dollar and HKD-denominated indebtedness). Additionally, we have revenues and costs denominated in currencies other than the U.S. dollar (primarily the RMB). Fluctuations in the exchange rates between the U.S. dollar and the RMB could result in increases or decreases in our costs or revenues which could negatively impact our business, financial condition, and results of operations. Significant inflation or disproportionate changes in foreign exchange rates could occur as a result of general economic conditions, acts of war or terrorism, changes in governmental monetary or tax policy, or changes in local interest rates. The impact of future exchange rate fluctuations between the U.S. dollar and the RMB and the U.S. dollar and the HKD cannot be predicted. Further, Chinas government imposes controls over the convertibility of RMB into foreign currencies, which subjects us to further currency exchange risk.
18
Table of Contents
Products we manufacture may contain design or manufacturing defects, which could result in reduced demand for our services and liability claims against us.
We manufacture products to our customers specifications, which are highly complex and may contain design or manufacturing errors or failures, despite our quality control and quality assurance efforts. Defects in the products we manufacture, whether caused by a design, manufacturing, or materials failure or error, may result in delayed shipments, customer dissatisfaction, a reduction or cancellation of purchase orders, or liability claims against us. If these defects occur either in large quantities or too frequently, our business reputation may be impaired. Since our products are used in products that are integral to our customers businesses, errors, defects, or other performance problems could result in financial or other damages to our customers beyond the cost of the PCB, for which we may be liable. Although our invoices and sales arrangements generally contain provisions designed to limit our exposure to product liability and related claims, existing or future laws or unfavorable judicial decisions could negate these limitation of liability provisions. See We depend upon a relatively small number of OEM customers for a large portion of our sales, and a decline in sales to major customers would materially adversely affect our business, financial condition, and results of operations.
In addition, we manufacture products for a range of automotive customers. If any of our products are or are alleged to be defective, we may be required to participate in a recall of such products. As suppliers become more integral to the vehicle design process and assume more of the vehicle assembly functions, vehicle manufacturers are increasingly looking to their suppliers for contributions when faced with product liability claims or recalls. In addition, vehicle manufacturers, which have traditionally borne the costs associated with warranty programs offered on their vehicles, are increasingly requiring suppliers to guarantee or warrant their products and may seek to hold us responsible for some or all of the costs related to the repair and replacement of parts supplied by us to the vehicle manufacturer.
We are heavily dependent upon the worldwide electronics industry, which is characterized by economic cycles and fluctuations in product demand. A downturn in the electronics industry or prolonged global economic crisis could result in decreased demand for our manufacturing services and materially adversely affect our business, financial condition, and results of operations.
A majority of our revenue is generated from the electronics industry, which is characterized by intense competition, relatively short product life cycles, and significant fluctuations in product demand. The industry is subject to economic cycles and recessionary periods. Due to the uncertainty in the end markets served by most of our customers, we have a low level of visibility with respect to future financial results. Consequently, our past operating results, earnings, and cash flows may not be indicative of our future operating results, earnings, and cash flows.
We depend upon a relatively small number of OEM customers for a large portion of our sales, and a decline in sales to major customers would materially adversely affect our business, financial condition, and results of operations.
A small number of customers are responsible for a significant portion of our sales. Our five largest OEM customers accounted for approximately 37%, 44% and 41% of our net sales for the years ended December 28, 2015, December 29, 2014 and December 30, 2013, respectively, and one customer represented 20% of our sales for the year ended December 28, 2015. Sales attributed to OEMs include both direct sales as well as sales that the OEMs place through EMS providers. Our customer concentration could fluctuate, depending on future customer requirements, which will depend in large part on market conditions in the electronics industry segments in which our customers participate. The loss of one or more significant customers or a decline in sales to our significant customers would materially adversely affect our business, financial condition, and results of operations. In addition, we generate significant accounts receivable in connection with providing manufacturing services to our customers. If one or more of our significant customers were to become insolvent or were otherwise unable to pay for the manufacturing services provided by us, our business, financial condition, and results of operations would be materially adversely affected.
In addition, during industry downturns, we may need to reduce prices to limit the level of order losses, and we may be unable to collect payments from our customers. There can be no assurance that key customers would
19
Table of Contents
not cancel orders, that they would continue to place orders with us in the future at the same levels as experienced by us in prior periods, that they would be able to meet their payment obligations, or that the end-products that use our products would be successful. This concentration of customer base may materially adversely affect our business, financial condition, and results of operations due to the loss or cancellation of business from any of these key customers, significant changes in scheduled deliveries to any of these customers, or decreases in the prices of the products sold to any of these customers.
If we are unable to maintain satisfactory capacity utilization rates, our business, financial condition, and results of operations would be materially adversely affected.
Given the high fixed costs of our operations, decreases in capacity utilization rates can have a significant effect on our business. Accordingly, our ability to maintain or enhance gross margins will continue to depend, in part, on maintaining satisfactory capacity utilization rates. In turn, our ability to maintain satisfactory capacity utilization will depend on the demand for our products, the volume of orders we receive, and our ability to offer products that meet our customers requirements at competitive prices. If current or future production capacity fails to match current or future customer demands, our facilities would be underutilized, our sales may not fully cover our fixed overhead expenses, and we would be less likely to achieve expected gross margins. If forecasts and assumptions used to support the realizability of our long-lived assets change in the future, significant impairment charges could result that would materially adversely affect our business, financial condition, and results of operations.
In addition, we generally schedule our quick turnaround production facilities at less than full capacity to retain our ability to respond to unexpected additional quick-turn orders. However, if these orders are not received, we may forego some production and could experience continued excess capacity. If we conclude we have significant, long-term excess capacity, we may decide to permanently close one or more of our facilities and lay off some of our employees. Closures or lay-offs could result in our recording restructuring charges such as severance, other exit costs, and asset impairments, as well as potentially causing disruptions in our ability to supply customers.
Our results of operations are often subject to demand fluctuations and seasonality. With a high level of fixed operating costs, even small revenue shortfalls would decrease our gross margins.
Our results of operations fluctuate for a variety of reasons, including:
| | timing of orders from and shipments to major customers; |
| | the levels at which we utilize our manufacturing capacity; |
| | price competition; |
| | changes in our mix of revenues generated from quick-turn versus standard delivery time services; |
| | expenditures, charges or write-offs, including those related to acquisitions, facility restructurings, or asset impairments; and |
| | expenses relating to expanding existing manufacturing facilities. |
A significant portion of our operating expenses is relatively fixed in nature, and planned expenditures are based in part on anticipated orders. Accordingly, unexpected revenue shortfalls may decrease our gross margins. In addition, we have experienced sales fluctuations due to seasonal patterns in the capital budgeting and purchasing cycles, as well as inventory management practices of our customers and the end markets we serve. In particular, the seasonality of the cellular phone and tablet industries and quick-turn ordering patterns affect the overall PCB industry. These seasonal trends have caused fluctuations in our operating results in the past and may continue to do so in the future. Results of operations in any period should not be considered indicative of the results that may be expected for any future period. In addition, our future quarterly operating results may fluctuate and may not meet the expectations of securities analysts or investors.
20
Table of Contents
We rely on the telecommunications industry for a significant portion of sales. Accordingly, the economic volatility in this industry has had, and may continue to have, a material adverse effect on our ability to forecast demand and production and to meet desired sales levels.
A large percentage of our business is conducted with customers who are in the telecommunications industry. This industry is characterized by intense competition, relatively short product life cycles, and significant fluctuations in product demand. This industry is heavily dependent on the end markets it serves and therefore can be affected by the demand patterns of those markets. If the volatility in this industry continues, it would have a material adverse effect on our business, financial condition, and results of operations.
Our results can be adversely affected by rising labor costs.
There is uncertainty with respect to rising labor costs, particularly within China, where we have most of our manufacturing facilities. In recent periods there have been regular and significant increases in the minimum wage payable in various provinces of China. In addition, we have experienced very high employee turnover in our manufacturing facilities in China, generally after the Chinese New Year, and we are experiencing ongoing difficulty in recruiting employees for these facilities. Furthermore, labor disputes and strikes based partly on wages have in the past slowed or stopped production by certain manufacturers in China. In some cases, employers have responded by significantly increasing the wages of workers at such plants. Any increase in labor costs due to minimum wage laws or customer requirements about scheduling and overtime that we are unable to recover in our pricing to our customers could materially adversely affect our business, financial condition, and results of operations. In addition, the high turnover rate and our difficulty in recruiting and retaining qualified employees and the other labor trends we are noting in China could result in a potential for defects in our products, production disruptions or delays, or the inability to ramp production to meet increased customer orders, resulting in order cancellation or imposition of customer penalties if we are unable to deliver products in a timely manner.
To respond to competitive pressures and customer requirements, we may further expand internationally in lower-cost locations. If we pursue such expansions, we may be required to make additional capital expenditures. In addition, the cost structure in certain countries that are now considered to be favorable may increase as economies develop or as such countries join multinational economic communities or organizations, causing local wages to rise. As a result, we may need to continue to seek new locations with lower costs and the employee and infrastructure base to support PCB manufacturing. We cannot assure investors that we will realize the anticipated strategic benefits of our international operations or that our international operations will contribute positively to our operating results.
In our North America operations, rising health care costs pose a significant labor-related risk. We work with our insurance brokers and carriers to control the cost of health care for our employees. However, there can be no assurance that our efforts will succeed, especially given recent and pending changes in government oversight of health care.
Unanticipated changes in our tax rates or in our assessment of the realizability of our deferred income tax assets or exposure to additional income tax liabilities could affect our business, financial condition, and results of operations.
We are subject to income taxes in the United States and various foreign jurisdictions. Significant judgment is required in determining our provision for income taxes and, in the ordinary course of business, there are many transactions and calculations in which the ultimate tax determination is uncertain. Our effective tax rates could be materially adversely affected by changes in the mix of earnings in countries and states with differing statutory tax rates, changes in the valuation of deferred income tax assets and liabilities, changes in tax laws, as well as other factors. Our tax determinations are regularly subject to audit by tax authorities, and developments in those audits could adversely affect our income tax provision. Although we believe that our tax estimates are reasonable, the final determination of tax audits or tax disputes may be different from what is reflected in our historical income tax provisions, which could materially adversely affect our business, financial condition, and results of operations.
21
Table of Contents
If our net earnings do not remain at or above recent levels, or we are not able to predict with a reasonable degree of probability that they will continue, we may have to record a valuation allowance against our net deferred income tax assets.
Certain of our foreign subsidiaries have deferred income tax assets. Based on our forecast for future taxable earnings for these foreign subsidiaries, we believe we will utilize the deferred income tax assets in future periods. However, if our estimates of future earnings decline, we may have to increase our valuation allowance against our net deferred income tax assets, resulting in a higher income tax provision, which would reduce our cash flows.
As a result of the acquisition of Viasystems, our goodwill, indefinite-lived intangible assets, and other intangible assets on our consolidated balance sheet have increased. If our goodwill, indefinite-lived intangible assets, or other intangible assets become impaired in the future, we would be required to record a material, non-cash charge to earnings, which would also reduce our stockholders equity.
As of December 28, 2015, our consolidated balance sheet reflected $497.9 million of goodwill and definite-lived intangible assets. We periodically evaluate whether events and circumstances have occurred, such that the potential for reduced expectations for future cash flows coupled with further decline in the market price of our stock and market capitalization may indicate that the remaining balance of goodwill and definite-lived intangible assets may not be recoverable. If factors indicate that assets are impaired, we would be required to reduce the carrying value of our goodwill and definite-lived intangible assets, which could harm our results during the periods in which such a reduction is recognized.
We will perform our fiscal year 2016 annual impairment test during our fourth fiscal quarter. Given the recent volatility of our market capitalization, it is reasonably possible that we could record an impairment charge by fiscal year end when we conduct our annual impairment test.
Employee strikes and other labor-related disruptions may materially adversely affect our business, financial condition, and results of operations.
Our business is labor intensive, utilizing large numbers of engineering and manufacturing personnel. Strikes or labor disputes with our unionized employees, primarily in China, may adversely affect our ability to conduct our business. If we are unable to reach agreement with any of our unionized work groups on future negotiations regarding the terms of their collective bargaining agreements, we may be subject to work interruptions or stoppages. Any of these events could be disruptive to our operations and could result in negative publicity, loss of contracts, and a decrease in revenues. We may also become subject to additional collective bargaining agreements in the future if more employees or segments of our workforce become unionized, including any of our employees in the United States. We have not experienced any labor problems resulting in a work stoppage, except for a brief work stoppage associated with the announcement of the closure of our Suzhou, China facility in September 2013.
We are exposed to the credit risk of some of our customers and to credit exposures in weakened markets.
Most of our sales are on an open credit basis, with standard industry payment terms. We monitor individual customer payment capability in granting such open credit arrangements, seek to limit such open credit to amounts we believe the customers can pay, and maintain reserves we believe are adequate to cover exposure for doubtful accounts. During periods of economic downturn in the electronics industry and the global economy, our exposure to credit risks from our customers increases. Although we have programs in place to monitor and mitigate the associated risks, such programs may not be effective in reducing our credit risks.
Our five largest OEM customers accounted for approximately 37%, 44% and 41% of our net sales for the years ended December 28, 2015, December 29, 2014 and December 30, 2013, respectively. Additionally, our OEM customers often direct a significant portion of their purchases through a relatively limited number of EMS companies. Sales to EMS companies represented approximately 35%, 39% and 38% of our net sales for the years ended December 28, 2015, December 29, 2014 and December 30, 2013, respectively. Our contractual relationship is often with the EMS companies, who are obligated to pay us for our products. Because we expect
22
Table of Contents
our OEM customers to continue to direct our sales to EMS companies, we expect to continue to be subject to this credit risk with a limited number of EMS customers. If one or more of our significant customers were to become insolvent or were otherwise unable to pay us, our business, financial condition, and results of operations would be materially adversely affected.
We rely on suppliers for the timely delivery of raw materials and components used in manufacturing our PCBs and E-M Solutions. If a raw material supplier fails to satisfy our product quality standards, it could harm our customer relationships.
Although we have preferred suppliers for most of our raw materials, the materials we use are generally readily available in the open market, and other potential suppliers exist. The components for backplane assemblies in some cases have limited or sole sources of supply. Consolidations and restructuring in our supplier base may result in adverse materials pricing due to reduction in competition among our suppliers. Furthermore, if a raw material or component supplier fails to satisfy our product quality standards, including standards relating to conflict minerals (See We are subject to risks for the use of certain metals from conflict minerals originating in the Democratic Republic of the Congo.), it could harm our customer relationships. Suppliers may from time to time extend lead times, limit supplies, or increase prices due to capacity constraints or other factors, which could harm our ability to deliver our products on a timely basis.
We serve customers and have manufacturing facilities outside the United States and are subject to the risks characteristic of international operations.
We have significant manufacturing operations in Asia and sales offices located in Asia and Europe, and we continue to consider additional opportunities to make foreign investments and construct new foreign facilities.
For the year ended December 28, 2015, we generated 71% of our net sales from non-U.S. operations, and a significant portion of our manufacturing material was provided by international suppliers during this period. As a result, we are subject to risks relating to significant international operations, including but not limited to:
| | managing international operations; |
| | imposition of governmental controls; |
| | unstable regulatory environments; |
| | compliance with employment laws; |
| | implementation of disclosure controls, internal controls, financial reporting systems, and governance standards to comply with U.S. accounting and securities laws and regulations; |
| | limitations on imports or exports of our product offerings; |
| | fluctuations in the value of local currencies; |
| | inflation or changes in political and economic conditions; |
| | labor unrest, rising wages, difficulties in staffing, and geographical labor shortages; |
| | government or political unrest; |
| | longer payment cycles; |
| | language and communication barriers, as well as time zone differences; |
| | cultural differences; |
| | increases in duties and taxation levied on our products; |
| | other potentially adverse tax consequences; |
| | imposition of restrictions on currency conversion or the transfer of funds; |
| | travel restrictions; |
23
Table of Contents
| | expropriation of private enterprises; and |
| | the potential reversal of current favorable policies encouraging foreign investment and trade. |
Our operations in China subject us to risks and uncertainties relating to the laws and regulations of China.
Under its current leadership, the government of China has been pursuing economic reform policies, including the encouragement of foreign trade and investment and greater economic decentralization. No assurance can be given, however, that the government of China will continue to pursue such policies, that such policies will be successful if pursued, or that such policies will not be significantly altered from time to time. Despite progress in developing its legal system, China does not have a comprehensive and highly developed system of laws, particularly with respect to foreign investment activities and foreign trade. Enforcement of existing and future laws and contracts is uncertain, and implementation and interpretation thereof may be inconsistent. As the Chinese legal system develops, the promulgation of new laws, changes to existing laws, and the preemption of local regulations by national laws may adversely affect foreign investors. Further, any litigation in China may be protracted and may result in substantial costs and diversion of resources and managements attention. In addition, though changes in government policies and rules are timely published or communicated, there is usually no indication of the duration of any grace period before which full implementation and compliance will be required. As a result, we may operate our business in violation of new rules and policies before full compliance can be achieved. These uncertainties could limit the legal protections available to us.
We depend on the U.S. government for a substantial portion of our business, which involves unique risks. Changes in government defense spending or regulations could have a material adverse effect on our business, financial condition, and results of operations.
A significant portion of our revenues is derived from products and services ultimately sold to the U.S. government by our OEM and EMS customers and is therefore affected by, among other things, the federal budget process. We are a supplier, primarily as a subcontractor, to the U.S. government and its agencies, as well as foreign governments and agencies. The contracts between our direct customers and the government end user are subject to political and budgetary constraints and processes, changes in short-range and long-range strategic plans, the timing of contract awards, the congressional budget authorization and appropriation processes, the governments ability to terminate contracts for convenience or for default, as well as other risks, such as contractor suspension or debarment in the event of certain violations of legal and regulatory requirements.
For the year ended December 28, 2015, aerospace and defense sales accounted for approximately 14% of our total net sales. The substantial majority of these sales are related to both U.S. and foreign military and defense programs. While we do not sell any significant volume of products directly to the U.S. government, we are a supplier to the U.S. government and its agencies, as well as foreign governments and agencies. Consequently, our sales are affected by changes in the defense budgets of the U.S. and foreign governments and may be affected by federal budget sequestration measures.
The domestic and international threat of terrorist activity, emerging nuclear states, and conventional military threats have led to an increase in demand for defense products and services and homeland security solutions in the recent past. The U.S. government, however, is facing unprecedented budgeting constraints. The termination or failure to fund one or more significant contracts by the U.S. government could have a material adverse effect on our business, financial condition, and results of operations.
Future changes to the Munitions List could reduce or eliminate restrictions that currently apply to some of the products we produce. If these regulations or others are changed in a manner that reduces restrictions on products being manufactured overseas, we would likely face an increase in the number of competitors and increased price competition from overseas manufacturers, who are restricted by the current export laws from manufacturing products for U.S. defense systems.
24
Table of Contents
We are subject to the requirements of the National Industrial Security Program Operating Manual for our facility security clearance, which is a prerequisite to our ability to perform on classified contracts for the U.S. government.
A facility security clearance is required in order to be awarded and perform on classified contracts for the DoD and certain other agencies of the U.S. government. As a cleared entity, we must comply with the requirements of the National Industrial Security Program Operating Manual (NISPOM), and any other applicable U.S. government industrial security regulations. Further, due to the fact that a significant portion of our voting equity is owned by a non-U.S. entity, we are required to be governed by and operate in accordance with the terms and requirements of the Special Security Agreement (the SSA). The terms of the SSA have been previously disclosed in our SEC filings.
If we were to violate the terms and requirements of the SSA, the NISPOM, or any other applicable U.S. government industrial security regulations (which may apply to us under the terms of classified contracts), we could lose our security clearance. We cannot be certain that we will be able to maintain our security clearance. If for some reason our security clearance is invalidated or terminated, we may not be able to continue to perform on classified contracts and would not be able to enter into new classified contracts, which could materially adversely affect our business, financial condition, and results of operations.
We participate in the competitive automotive industry, which has strict quality control standards.
As a result of the acquisition of Viasystems, a significant portion of our sales are to customers within the automotive industry. If there was a destabilization of the automotive industry or a market shift away from our automotive customers, it may have a materially adverse effect on our business, financial condition, and results of operations.
In addition, for safety reasons, automotive customers have strict quality standards that generally exceed the quality requirements of other customers. If such products do not meet these quality standards, our business, financial condition, and results of operations may be materially adversely affected. These automotive customers may require long periods of time to evaluate whether our manufacturing processes and facilities meet their quality standards. If we were to lose automotive customers due to quality control issues, we might not be able to regain those customers or gain new automotive customers for long periods of time, which could have a material adverse effect on our business, financial condition, and results of operations. Moreover, we may be required under our contracts with automotive industry customers to indemnify them for the cost of warranties and recalls relating to our products.
Competition in the PCB market is intense, and we could lose market share if we are unable to maintain our current competitive position in end markets using our quick-turn, high technology, and high-mix manufacturing services.
The PCB industry is intensely competitive, highly fragmented, and rapidly changing. We expect competition to continue, which could result in price reductions, reduced gross margins, and loss of market share. Our principal PCB and substrate competitors include AT & S Austria Technologie & Systemtechnik AG, Chin Poon Industrial Co., LTD., Compeq Manufacturing Co., Ltd., IBIDEN Co., Ltd., ISU Petasys Co., Ltd., Multek Corporation, Sanmina Corporation, Tripod Technology Corp., Unimicron Technology Corp., and Wus Printed Circuit Co., Ltd. Our principal E-M Solutions competitors include Amphenol Corp, Flex, Jabil Circuit, Inc. and Sanmina Corporation. In addition, we increasingly compete on an international basis, and new and emerging technologies may result in new competitors entering our markets.
Some of our competitors and potential competitors have advantages over us, including:
| | greater financial and manufacturing resources that can be devoted to the development, production, and sale of their products; |
| | more established and broader sales and marketing channels; |
| | more manufacturing facilities worldwide, some of which are closer in proximity to OEMs; |
25
Table of Contents
| | manufacturing facilities that are located in countries with lower production costs; |
| | lower capacity utilization, which in peak market conditions can result in shorter lead times to customers; |
| | ability to add additional capacity faster or more efficiently; |
| | preferred vendor status with existing and potential customers; |
| | greater name recognition; and |
| | larger customer bases. |
In addition, these competitors may respond more quickly to new or emerging technologies or adapt more quickly to changes in customer requirements than we do. We must continually develop improved manufacturing processes to meet our customers needs for complex products, and our manufacturing process technology is generally not subject to significant proprietary protection. During recessionary periods in the electronics industry, our strategy of providing quick-turn services, an integrated manufacturing solution, and responsive customer service may take on reduced importance to our customers. As a result, we may need to compete more on the basis of price, which would cause our gross margins to decline.
If we are unable to respond to rapid technological change and process development, we may not be able to compete effectively.
The market for our manufacturing services is characterized by rapidly changing technology and continual implementation of new production processes. The future success of our business will depend in large part upon our ability to maintain and enhance our technological capabilities, to manufacture products that meet changing customer needs, and to successfully anticipate or respond to technological changes on a cost-effective and timely basis. We expect that the investment necessary to maintain our technological position will increase as customers make demands for products and services requiring more advanced technology on a quicker turnaround basis. For example, in 2016 we expect to continue to make significant capital expenditures to expand our HDI and other advanced manufacturing capabilities. We may not be able to obtain access to additional sources of funds in order to respond to technological changes as quickly as our competitors.
In addition, the PCB industry could encounter competition from new or revised manufacturing and production technologies that render existing manufacturing and production technology less competitive or obsolete. We may not respond effectively to the technological requirements of the changing market. If we need new technologies and equipment to remain competitive, the development, acquisition, and implementation of those technologies and equipment will require us to make significant capital investments.
An increase in the cost of raw materials could have a material adverse effect on our business, financial condition, and results of operations and reduce our gross margins.
To manufacture PCBs, we use raw materials such as laminated layers of fiberglass, copper foil, chemical solutions, gold, and other commodity products, which we order from our suppliers. In the case of backplane assemblies, components include connectors, sheet metal, capacitors, resistors and diodes, many of which are custom made and controlled by our customers approved vendors. If raw material and component prices increase, it may reduce our gross margins.
If we are unable to provide our customers with high-end technology, high-quality products, and responsive service, or if we are unable to deliver our products to our customers in a timely manner, our business, financial condition, and results of operations may be materially adversely affected.
In order to maintain our existing customer base and obtain business from new customers, we must demonstrate our ability to produce our products at the level of technology, quality, responsiveness of service, timeliness of delivery, and cost that our customers require. If our products are of substandard quality, if they are not delivered on time, if we are not responsive to our customers demands, or if we cannot meet our customers technological requirements, our reputation as a reliable supplier of our products would likely be damaged. If we are unable to meet anticipated product and service standards, we may be unable to obtain new contracts or keep our existing customers, and this would have a material adverse effect on our business, financial condition, and results of operations.
26
Table of Contents
We are subject to risks for the use of certain metals from conflict minerals originating in the Democratic Republic of the Congo.
During the third quarter of 2012, the SEC adopted rules implementing the Dodd-Frank Wall Street Reform and Consumer Protection Act (Dodd-Frank). These rules impose diligence and disclosure requirements regarding the use of conflict minerals mined from the Democratic Republic of Congo and adjoining countries as required by Dodd-Frank. While these new rules continue to be the subject of ongoing litigation and, as a result, uncertainty, we submitted a conflict minerals report on Form SD with the SEC on June 2, 2014 and May 14, 2015. Compliance with these rules is likely to result in additional costs and expenses, including costs and expenses incurred for due diligence to determine and verify the sources of any conflict minerals used in our products, in addition to the costs and expenses of remediation and other changes to products, processes, or sources of supply as a consequence of such verification efforts. These rules may also affect the sourcing and availability of minerals used in the manufacture of our PCBs, as there may be only a limited number of suppliers offering conflict free minerals that can be used in our products. There can be no assurance that we will be able to obtain such minerals in sufficient quantities or at competitive prices. Also, since our supply chain is complex, we may, at a minimum, face reputational challenges with our customers, stockholders, and other stakeholders if we are unable to sufficiently verify the origins of the minerals used in our products. We may also encounter customers who require that all of the components of our products be certified as conflict free. If we are not able to meet customer requirements, such customers may choose to disqualify us as a supplier, which could impact our sales and the value of portions of our inventory.
Damage to our manufacturing facilities due to fire, natural disaster, or other events could materially adversely affect our business, financial condition, and results of operations.
The destruction or closure of any of our facilities for a significant period of time as a result of fire, explosion, blizzard, act of war or terrorism, flood, tornado, earthquake, lightning, other natural disasters, an outbreak of epidemics such as Ebola or severe acute respiratory syndrome, required maintenance, or other events could harm us financially, increasing our costs of doing business and limiting our ability to deliver our manufacturing services on a timely basis.
Our insurance coverage with respect to damages to our facilities or our customers products caused by natural disasters is limited and is subject to deductibles and coverage limits. Such coverage may not be adequate or continue to be available at commercially reasonable rates and terms.
In the event one or more of our facilities is closed on a temporary or permanent basis as a result of a natural disaster, required maintenance or other event, or in the event that an outbreak of a serious epidemic results in quarantines, temporary closures of offices or manufacturing facilities, travel restrictions or the temporary or permanent loss of key personnel, our operations could be significantly disrupted. Such events could delay or prevent product manufacturing and shipment for the time required to transfer production or repair, rebuild or replace the affected manufacturing facilities. This time frame could be lengthy and result in significant expenses for repair and related costs. While we have disaster recovery plans in place, there can be no assurance that such plans will be sufficient to allow our operations to continue in the event of every natural or man-made disaster, pandemic, required repair or other extraordinary event. Any extended inability to continue our operations at unaffected facilities following such an event would reduce our revenue and potentially damage our reputation as a reliable supplier.
We face constant pricing pressure from our customers and competitors, which may decrease our profit margins.
Competition in the PCB market is intense, and we expect that competition will continue to increase, thereby creating a highly aggressive pricing environment. We and some of our competitors have reduced average selling prices in the past. In addition, competitors may reduce their average selling prices faster than our ability to reduce costs, which can also accelerate the rate of decline of our selling prices. When prices decline, we may also be required to write down the value of our inventory.
27
Table of Contents
The effects of such pricing pressures on our business may be exacerbated by inflationary pressures that affect our costs of supply. When we are unable to extract comparable concessions from our suppliers on prices they charge us, this in turn reduces gross profit if we are unable to raise prices. Further, uncertainty or adverse changes in the economy could also lead to a significant decline in demand for our products and pressure to reduce our prices. As a result of the recent global economic downturn, many businesses have taken a more conservative stance in ordering inventory. Any decrease in demand for our products, coupled with pressure from the market and our customers to decrease our prices, would materially adversely affect our business, financial condition, and results of operations.
The pricing pressure we face on our products requires us to introduce new and more advanced technology products to maintain average selling prices or reduce any declines in average selling prices. As we shift production to more advanced, higher-density PCBs, we tend to make significant investments in plants and other capital equipment and incur higher costs of production, which may not be recovered.
The prominence of EMS companies as our customers could reduce our gross margins, potential sales, and customers.
Sales to EMS companies represented approximately 35%, 39% and 38% of our net sales for the years ended December 28, 2015, December 29, 2014 and December 30, 2013, respectively. Sales to EMS providers include sales directed by OEMs as well as orders placed with us at the EMS providers discretion. EMS providers source on a global basis to a greater extent than OEMs. The growth of EMS providers increases the purchasing power of such providers and has in the past, and could in the future, result in increased price competition or the loss of existing OEM customers. In addition, some EMS providers, including some of our customers, have the ability to directly manufacture PCBs and create backplane assemblies. If a significant number of our other EMS customers were to acquire these abilities, our customer base might shrink, and our sales might decline substantially. Moreover, if any of our OEM customers outsource the production of PCBs and creation of backplane assemblies to these EMS providers, our business, financial condition, and results of operations may be materially adversely affected.
If we are unable to manage our growth effectively, our business, financial condition, and results of operations could be materially adversely affected.
We have experienced, and expect to continue to experience, growth in the scope and complexity of our operations. This growth may strain our managerial, financial, manufacturing, and other resources. In order to manage our growth, we may be required to continue to implement additional operating and financial controls and hire and train additional personnel. There can be no assurance that we will be able to do so in the future, and failure to do so could jeopardize our expansion plans and seriously harm our operations. In addition, growth in our capacity could result in reduced capacity utilization and a corresponding decrease in gross margins.
Our international sales are subject to laws and regulations relating to corrupt practices, trade, and export controls and economic sanctions. Any non-compliance could have a material adverse effect on our business, financial condition, and results of operations.
We operate on a global basis and are subject to anti-corruption, anti-bribery, and anti-kickback laws and regulations, including restrictions imposed by the Foreign Corrupt Practices Act (the FCPA). The FCPA and similar anti-corruption, anti-bribery, and anti-kickback laws in other jurisdictions generally prohibit companies and their intermediaries and agents from making improper payments to government officials or any other persons for the purpose of obtaining or retaining business. We operate and sell our products in many parts of the world that have experienced governmental corruption to some degree and, in certain circumstances, strict compliance with anti-corruption, anti-bribery, and anti-kickback laws may conflict with local customs and practices. We also, from time to time, undertake business ventures with state-owned companies or enterprises.
Our global business operations must also comply with all applicable domestic and foreign export control laws, including International Traffic In Arms Regulations (ITAR), and Export Administration Regulations (EAR). Some items we manufacture are controlled for export by the U.S. Department of Commerces Bureau of Industry and Security under EAR.
28
Table of Contents
We train our employees concerning anti-corruption, anti-bribery, and anti-kickback laws and compliance with international regulations regarding trades and exports, and we have policies in place that prohibit employees from making improper payments. We cannot provide assurances that our internal controls and procedures will guarantee compliance by our employees or third parties with whom we work. If we are found to be liable for violations of the FCPA or similar anti-corruption, anti-bribery, or anti-kickback laws in international jurisdictions or for violations of ITAR, EAR, or other similar regulations regarding trades and exports, either due to our own acts or out of inadvertence, or due to the inadvertence of others, we could suffer criminal or civil fines or penalties or other repercussions, including reputational harm, which could have a material adverse effect on our business, financial condition, and results of operations.
Our global business operations also must be conducted in compliance with applicable economic sanctions laws and regulations, such as laws administered by the U.S. Department of the Treasurys Office of Foreign Asset Control, the U.S. State Department, and the U.S. Department of Commerce. We must comply with all applicable economic sanctions laws and regulations of the United States and other countries. Violations of these laws or regulations could result in significant additional sanctions including criminal or civil fines or penalties, more onerous compliance requirements, more extensive debarments from export privileges, or loss of authorizations needed to conduct aspects of our international business.
In certain countries, we may engage third-party agents or intermediaries, such as customs agents, to act on our behalf, and if these third-party agents or intermediaries violate applicable laws, their actions may result in criminal or civil fines or penalties or other sanctions being assessed against us. We take certain measures designed to ensure our compliance with U.S. export and economic sanctions laws, anti-corruption laws and regulations, and export control laws. However, it is possible that some of our products were sold or will be sold to distributors or other parties, without our knowledge or consent, in violation of applicable law. There can be no assurances that we will be in compliance in the future. Any such violation could result in significant criminal or civil fines, penalties, or other sanctions and repercussions, including reputational harm, which could have a material adverse effect on our business, financial condition, and results of operations.
Our failure to comply with the requirements of environmental laws could result in litigation, fines, revocation of permits necessary to our manufacturing processes, or debarment from our participation in federal government contracts.
Our operations are regulated under a number of federal, state, local, and foreign environmental and safety laws and regulations that govern, among other things, the discharge of hazardous materials into the air and water, as well as the handling, storage, and disposal of such materials. These laws and regulations include the Clean Air Act, the Clean Water Act, the Resource Conservation and Recovery Act, the Superfund Amendment and Reauthorization Act, the Comprehensive Environmental Response, Compensation and Liability Act, the Toxic Substances Control Act, and the Federal Motor Carrier Safety Improvement Act, as well as analogous state, local, and foreign laws. Compliance with these environmental laws is a major consideration for us because our manufacturing processes use and generate materials classified as hazardous. Because we use hazardous materials and generate hazardous wastes in our manufacturing processes, we may be subject to potential financial liability for costs associated with the investigation and remediation of our own sites, or sites at which we have arranged for the disposal of hazardous wastes, if such sites become contaminated. Even if we fully comply with applicable environmental laws and are not directly at fault for the contamination, we may still be liable. The wastes we generate include spent ammoniacal and cupric etching solutions, metal stripping solutions, waste acid solutions, waste alkaline cleaners, waste oil, and waste waters that contain heavy metals such as copper, tin, lead, nickel, gold, silver, cyanide, and fluoride, and both filter cake and spent ion exchange resins from equipment used for on-site waste treatment.
Environmental law violations, including the failure to maintain required environmental permits, could subject us to fines, penalties, and other sanctions, including the revocation of our effluent discharge permits. This could require us to cease or limit production at one or more of our facilities and could have a material adverse effect on our business, financial condition, and results of operations. Even if we ultimately prevail, environmental lawsuits against us would be time consuming and costly to defend.
29
Table of Contents
Environmental laws have generally become more stringent and this trend may continue over time, imposing greater compliance costs and increasing risks and penalties associated with violation. We operate in environmentally sensitive locations, and we are subject to potentially conflicting and changing regulatory agendas of political, business, and environmental groups. Changes or restrictions on discharge limits, emissions levels, material storage, handling, or disposal might require a high level of unplanned capital investment or relocation to another global location where prohibitive regulations do not exist. It is possible that environmental compliance costs and penalties from new or existing regulations may materially adversely affect our business, financial condition, and results of operations.
We are increasingly required to certify compliance with various material content restrictions in our products based on laws of various jurisdictions or territories such as the Restriction of Hazardous Substances (RoHS) and Registration, Evaluation, Authorization and Restriction of Chemicals (REACH) directives in the European Union and Chinas RoHS legislation. Similar laws have been adopted in other jurisdictions and may become increasingly prevalent. In addition, we must also certify as to the non-applicability of the EUs Waste Electrical and Electronic Equipment directive for certain products that we manufacture. The REACH directive requires the identification of Substances of Very High Concern (SVHCs) periodically. We must survey our supply chain and certify to the non-presence or presence of SVHCs to our customers. As with other types of product certifications that we routinely provide, we may incur liability and pay damages if our products do not conform to our certifications.
We are also subject to a variety of environmental laws and regulations in China, which impose limitations on the discharge of pollutants into the air and water and establish standards for the treatment, storage, and disposal of solid and hazardous wastes. The manufacturing of our products generates gaseous chemical wastes, liquid wastes, waste water, and other industrial wastes from various stages of the manufacturing process. Production sites in China are subject to regulation and periodic monitoring by the relevant environmental protection authorities. Environmental claims or the failure to comply with current or future regulations could result in the assessment of damages or imposition of fines against us, suspension of production, or cessation of operations.
The process to manufacture PCBs requires adherence to city, county, state, federal, and foreign environmental regulations regarding the storage, use, handling, and disposal of chemicals, solid wastes, and other hazardous materials, as well as compliance with air quality standards and chemical use reporting. In China, governmental authorities have adopted new rules and regulations governing environmental issues. An update to Chinese environmental waste water law was issued in late 2012, allowing for an interim period in which plants subject to such law may install equipment that meets the new regulatory regime. Our plants in China are not yet in full compliance with the newly adopted environmental regulations. There can be no assurance that violations will not occur in the future.
Employee theft or fraud could result in loss.
Certain of our employees have access to, or signature authority with respect to, bank accounts or other company assets, which could expose us to fraud or theft. In addition, certain employees have access to certain precious metals used in connection with our manufacturing and key information technology (IT) infrastructure and to customer and other information that is commercially valuable. Should any employee, for any reason, steal any such precious metals (which has occurred from time to time), compromise our IT systems, or misappropriate customer or other information, we could incur losses, including losses relating to claims by our customers against us, and the willingness of customers to do business with us may be damaged. Additionally, in the case of our defense business, we could be debarred from future participation in government programs. Any such losses may not be fully covered by insurance.
30
Table of Contents
Because we sell on a purchase order basis, we are subject to uncertainties and variability in demand by our customers that could decrease revenues and harm our operating results.
Although we have long-term contracts with many customers, those contracts generally do not contain volume commitments. We generally sell to customers on a purchase order basis. Our quick-turn orders are subject to particularly short lead times. Consequently, our sales are subject to short-term variability in demand by our customers. Customers submitting purchase orders may cancel, reduce, or delay their orders for a variety of reasons, subject to negotiations. The level and timing of orders placed by our customers may vary due to:
| | customer attempts to manage inventory; |
| | changes in customers manufacturing strategies, such as a decision by a customer to either diversify or consolidate the number of PCB manufacturers or backplane assembly service providers used or to manufacture or assemble its own products internally; |
| | variation in demand for our customers products; and |
| | changes in new product introductions. |
We have periodically experienced terminations, reductions, and delays in our customers orders. Further terminations, reductions, or delays in our customers orders could materially adversely affect our business, financial condition, and results of operations.
Increasingly, our customers are requesting that we enter into supply agreements with them that have restrictive terms and conditions. These agreements typically include provisions that increase our financial exposure, which could result in significant costs to us.
Increasingly, our customers are requesting that we enter into supply agreements with them. These agreements typically do not include volume commitments, but do include provisions that generally serve to increase our exposure for product liability and limited sales returns, which could result in higher costs to us as a result of such claims. In addition, these agreements typically contain provisions that seek to limit our operational and pricing flexibility and extend payment terms, which could materially adversely affect our cash flow, business, financial condition, and results of operations.
Our business has benefited from OEMs deciding to outsource their PCB manufacturing and backplane assembly needs to us. If OEMs choose to provide these services in-house or select other providers, our business could suffer.
Our future revenue growth partially depends on new outsourcing opportunities from OEMs. Current and prospective customers continuously evaluate our performance against other providers. They also evaluate the potential benefits of manufacturing their products themselves. To the extent that outsourcing opportunities are not available either due to OEM decisions to produce these products themselves or to use other providers, our financial results and future growth could be materially adversely affected.
Consolidation among our customers could materially adversely affect our business, financial condition, and results of operations.
Recently, some of our large customers have consolidated, and further consolidation of customers may occur. Depending on which organization becomes the controller of the supply chain function following the consolidation, we may not be retained as a preferred or approved supplier. In addition, product duplication could result in the termination of a product line that we currently support. While there is potential for increasing our position with the combined customer, there does exist the potential for decreased revenue if we are not retained as a continuing supplier. We also face the risk of increased pricing pressure from the combined customer because of its increased market share.
31
Table of Contents
We may need additional capital in the future to fund investments in our operations, refinance our indebtedness, and to maintain and grow our business, and such capital may not be available on a timely basis, on acceptable terms, or at all.
Our business is capital-intensive, and our ability to increase revenue, profit, and cash flow depends upon continued capital spending. To the extent that the funds generated by our ongoing operations are insufficient to cover our liquidity requirements, we may need to raise additional funds through financings. If we are unable to fund our operations and make capital expenditures as currently planned or if we do not have sufficient liquidity to service the interest and principal payments on our debt, it would have a material adverse effect on our business, financial condition, and results of operations. If we do not achieve our expected operating results, we would need to reallocate our sources and uses of operating cash flows. This may include borrowing additional funds to service debt payments, which may impair our ability to make investments in our business. Looking ahead at long-term needs, we may need to raise additional funds for a number of purposes, including the following:
| | to fund capital equipment purchases to increase production capacity, upgrade and expand our technological capabilities and replace aging equipment or introduce new products; |
| | to refinance our existing indebtedness; |
| | to fund our operations beyond 2016; |
| | to fund working capital requirements for future growth that we may experience; |
| | to enhance or expand the range of services we offer; |
| | to increase our sales and marketing activities; or |
| | to respond to competitive pressures or perceived opportunities, such as investment, acquisition, and international expansion activities. |
Should we need to raise funds through incurring additional debt, we may become subject to covenants even more restrictive than those contained in our current debt instruments. There can be no assurance that additional capital, including any future equity or debt financing, would be available on a timely basis, on favorable terms, or at all. If such funds are not available to us when required or on acceptable terms, our business, financial condition, and results of operations could be materially adversely affected.
Our operations could be materially adversely affected by a shortage of utilities or a discontinuation of priority supply status offered for such utilities.
The manufacturing of PCBs requires significant quantities of electricity and water. Our Asia Pacific operations have historically purchased substantially all of the electrical power for their manufacturing plants in China from local power plants. Because Chinas economy has recently been in a state of growth, the strain on the nations power plants is increasing, which has led to continuing power outages in various parts of the country. There may be times when our operations in China may be unable to obtain adequate sources of electricity to meet production requirements. Various regions in China have in the past experienced shortages of both electricity and water and unexpected interruptions of power supply. From time to time, the Chinese government rations electrical power, which can lead to unscheduled production interruptions at our manufacturing facilities.
In addition, certain of the areas in which our North America operations have manufacturing facilities, particularly in California, have experienced power and resource shortages from time to time, including mandatory periods without electrical power, changes to water availability, and significant increases in utility and resource costs. California has also recently experienced drought conditions, prompting the Governor of California to proclaim a Drought State of Emergency. Due to the severe drought conditions, some local and regional water districts and the state government are implementing policies or regulations that restrict water usage and increase the cost of water.
We do not generally maintain any back-up power generation facilities or reserves of water for our operations, so if we were to lose supplies of power or water at any of our facilities, we would be required to cease
32
Table of Contents
operations until such supply was restored. Any resulting cessation of operations could materially adversely affect our ability to meet our customers orders in a timely manner, thus potentially resulting in a loss of business, along with increased costs of manufacturing, and under-utilization of capacity. In addition, the sudden cessation of our power or water supply could damage our equipment, resulting in the need for costly repairs or maintenance, as well as damage to products in production, resulting in an increase in scrapped products.
For example, in the third quarter of 2014, one of our principal plants was affected by a five day unexpected power outage, which increased our manufacturing costs and caused delivery delays. There can be no assurance that our required utilities would not in the future experience material interruptions, which could have a material adverse effect on our business, financial condition, and results of operations.
Outages, computer viruses, break-ins, and similar events could disrupt our operations, and breaches of our security systems may cause us to incur significant legal and financial exposure.
We rely on information technology networks and systems, some of which are owned and operated by third parties, to process, transmit, and store electronic information. In particular, we depend on our information technology infrastructure for a variety of functions, including worldwide financial reporting, inventory management, procurement, invoicing, and email communications. Any of these systems may be susceptible to outages due to fire, floods, power loss, telecommunications failures, terrorist attacks, and similar events. Despite the implementation of network security measures, our systems and those of third parties on which we rely may also be vulnerable to computer viruses, break-ins, and similar disruptions. If we or our vendors are unable to prevent such outages and breaches, our operations could be disrupted. If unauthorized parties gain access to our information systems or such information is used in an unauthorized manner, misdirected, lost, or stolen during transmission, any theft or misuse of such information could result in, among other things, unfavorable publicity, governmental inquiry and oversight, difficulty in marketing our services, allegations by our customers that we have not performed our contractual obligations, litigation by affected parties, and possible financial obligations for damages related to the theft or misuse of such information, any of which could have a material adverse effect on our business, financial condition, and results of operations.
We may be unable to hire and retain sufficient qualified personnel, and the loss of any of our key executive officers could materially adversely affect our business, financial condition, and results of operations.
We believe that our future success will depend in large part on our ability to attract and retain highly skilled, knowledgeable, sophisticated, and qualified managerial and professional personnel. We may not be able to retain our executive officers and key personnel or attract additional qualified management in the future. We can make no assurances that future changes in executive management will not have a material adverse effect on our business, financial condition, or results of operations. Our business also depends on our continuing ability to recruit, train, and retain highly qualified employees, particularly engineering and sales and marketing personnel. The competition for these employees is intense, and the loss of these employees could harm our business. Further, our ability to successfully integrate acquired companies depends in part on our ability to retain key management and existing employees at the time of the acquisition.
In addition, key employees may depart for a variety of reasons, including because of issues relating to the difficulty of integration or accelerated retirement in connection with our acquisition of Viasystems. If key employees depart, the integration process may be more difficult and could have a material adverse effect on our business, financial condition, and results of operations. Furthermore, we may have to incur significant costs in identifying and hiring replacements for departing employees and may lose significant expertise and talent relating to our businesses, and our ability to realize the anticipated benefits of the acquisition of Viasystems may be adversely affected. In addition, there could be disruptions to or distractions for the workforce and management associated with integrating employees. Accordingly, no assurance can be given that we will be able to attract or retain key employees or that the loss of any key executive officers would not materially adversely affect our business, financial condition, and results of operations.
33
Table of Contents
Our manufacturing processes depend on the collective industry experience of our employees. If a significant number of these employees were to leave us, it could limit our ability to compete effectively and could materially adversely affect our business, financial condition, and results of operations.
We have limited patent or trade secret protection for our manufacturing processes. We rely on the collective experience of our employees involved in our manufacturing processes to ensure that we continuously evaluate and adopt new technologies in our industry. Although we are not dependent on any one employee or a small number of employees, if a significant number of our employees involved in our manufacturing processes were to leave our employment, and we were not able to replace these people with new employees with comparable experience, our manufacturing processes might suffer as we might be unable to keep up with innovations in the industry. As a result, we may lose our ability to continue to compete effectively. For example, we have experienced a significant amount of employee attrition in our China operations each year, which has negatively impacted our yield, costs of production, and service times.
We may be exposed to intellectual property infringement claims by third parties that could be costly to defend, could divert managements attention and resources, and if successful, could result in liability.
We rely on a combination of copyright, patent, trademark, and trade secret laws, confidentiality procedures, contractual provisions, and other measures to protect our proprietary information. All of these measures afford only limited protection. These measures may be invalidated, circumvented, or challenged, and others may develop technologies or processes that are similar or superior to our technology. We may not have the controls and procedures in place that are needed to adequately protect proprietary information. Despite our efforts to protect our proprietary rights, unauthorized parties may attempt to copy our products or obtain or use information that we regard as proprietary, which could materially adversely affect our business, financial condition, and results of operations.
Furthermore, there is a risk that we may infringe on the intellectual property rights of others. As is the case with many other companies in the PCB industry, we from time to time receive communications from third parties asserting patent rights to our products and enter into discussions with such third parties. Irrespective of the validity or the successful assertion of such claims, we could incur costs in either defending or settling any intellectual property disputes alleging infringement. If any claims are brought against the customers for such infringement, whether or not these have merit, we could be required to expend significant resources in defending such claims. In the event we are subject to any infringement claims, we may be required to spend a significant amount of money to develop non-infringing alternatives or obtain licenses. We may not be successful in developing such alternatives or in obtaining such licenses on reasonable terms or at all, which could disrupt the production processes, damage our reputation, and materially adversely affect our business, financial condition, and results of operations.
Our business, financial condition, and results of operations could be materially adversely affected by climate change initiatives.
Our manufacturing processes require that we purchase significant quantities of energy from third parties, which results in the generation of greenhouse gases, either directly on-site or indirectly at electric utilities. Both domestic and international legislation to address climate change by reducing greenhouse gas emissions could create increases in energy costs and price volatility. Considerable international attention is now focused on development of an international policy framework to guide international action to address climate change. Proposed and existing legislative efforts to control or limit greenhouse gas emissions could affect our energy sources and supply choices, as well as increase the cost of energy and raw materials that are derived from sources that generate greenhouse gas emissions.
Our business relationships may be subject to disruption due to uncertainty associated with the acquisition of Viasystems.
Parties with which we do business may experience uncertainty associated with our acquisition of Viasystems, including current or future business relationships with the combined company. Our business
34
Table of Contents
relationships may be subject to disruption, as customers, distributors, suppliers, vendors, and others may attempt to negotiate changes in existing business relationships or consider entering into business relationships with parties other than the combined company. These disruptions could have a material adverse effect on the business, financial condition, or results of operations of the combined company, including a material adverse effect on our ability to realize the anticipated benefits of the acquisition of Viasystems.
Failure to maintain good relations with the noncontrolling interest holder of a majority-owned subsidiary of TTM in China could materially adversely affect our ability to manage that operation.
A noncontrolling interest holder owns a 5% interest in a subsidiary of TTM that operates the Huiyang, China facility that became a part of our operations through the acquisition of Viasystems. The noncontrolling interest holder is affiliated with the Chinese government and has close ties to local economic development and other Chinese government agencies. The noncontrolling interest holder has certain rights to be consulted and to consent to certain operating and investment matters concerning the Huiyang facility and the board of directors of our subsidiary that operates the Huiyang facility. Failure to maintain good relations with the noncontrolling interest holder could materially adversely affect our ability to manage the operations of the plant.
Security breaches and other disruptions could compromise our information and expose us to liability, which could cause our business and reputation to suffer.
In the ordinary course of our business, we collect and store sensitive data in our data centers and on our networks, including intellectual property, our proprietary business information and that of our customers, suppliers and business partners, and personally identifiable information of our employees. The secure processing, maintenance and transmission of this information is critical to our operations. Despite our security measures, our information technology and infrastructure may be vulnerable to attacks by hackers or breached due to employee error, malfeasance or other disruptions. Any such breach could compromise our networks and the information stored there could be accessed, publicly disclosed, lost or stolen. Any such access, disclosure or other loss of information could result in legal claims or proceedings, disrupt our operations, damage our reputation, and cause a loss of confidence in our products and services, which could have a material adverse effect on our business, financial condition, results of operations or cash flows.
| ITEM 1B. | UNRESOLVED STAFF COMMENTS |
None.
35
Table of Contents
| ITEM 2. | PROPERTIES |
The following table describes our principal manufacturing facilities and our drilling and tooling process facility.
| U.S. Locations |
Operating Segment |
Leased Square Feet |
Owned Square Feet |
Total Square Feet |
||||||||||
| Anaheim, CA (ANA) |
PCB | | 97,000 | 97,000 | ||||||||||
| Cleveland, OH (CLE)(2) |
PCB | | 40,000 | 40,000 | ||||||||||
| Costa Mesa, CA(1) |
Headquarters | 11,775 | | 11,775 | ||||||||||
| Chippewa Falls, WI (CF) |
PCB | | 281,000 | 281,000 | ||||||||||
| El Paso, TX(2) |
29,000 | | 29,000 | |||||||||||
| Forest Grove, OR (FG) |
PCB | | 310,500 | 310,500 | ||||||||||
| Littleton, Colorado (DEN) |
PCB | 2,000 | 26,000 | 28,000 | ||||||||||
| Logan, UT (LG) |
PCB | | 129,300 | 129,300 | ||||||||||
| Milpitas, CA (MIL)(2) |
PCB | 62,000 | | 62,000 | ||||||||||
| North Jackson, OH (NJ) |
PCB | 9,000 | 75,000 | 84,000 | ||||||||||
| San Diego, CA (SD) |
PCB | 38,739 | | 38,739 | ||||||||||
| San Jose, CA (SJ) |
PCB | 40,000 | | 40,000 | ||||||||||
| Santa Ana, CA (SA) |
PCB | | 82,550 | 82,550 | ||||||||||
| Santa Clara, CA (SC) |
PCB | 18,304 | 49,115 | 67,419 | ||||||||||
| Stafford, CT (ST) |
PCB | 21,251 | 136,000 | 157,251 | ||||||||||
| Stafford Springs, CT (SS) |
PCB | 9,000 | 110,328 | 119,328 | ||||||||||
| Sterling,VA (STE) |
PCB | 101,000 | | 101,000 | ||||||||||
|
|
|
|
|
|
|
|||||||||
| Total |
342,069 | 1,336,793 | 1,678,862 | |||||||||||
| Foreign Locations |
||||||||||||||
| Mexico |
||||||||||||||
| Juarez, Chihuahua (JZ)(2) |
E-M Solutions |
205,000 | | 205,000 | ||||||||||
| Canada |
||||||||||||||
| Toronto (TOR) |
PCB | 15,000 | 93,000 | 108,000 | ||||||||||
| China |
||||||||||||||
| Hong Kong (OPCM) |
PCB | 86,982 | | 86,982 | ||||||||||
| Dongguan (DMC) |
PCB | | 1,322,803 | 1,322,803 | ||||||||||
| Guangzhou (GME) |
PCB | | 968,028 | 968,028 | ||||||||||
| Guangzhou (GZ) |
PCB | 106,000 | 2,250,000 | 2,356,000 | ||||||||||
| Huiyang (HY) |
PCB | | 400,000 | 400,000 | ||||||||||
| Shanghai(SH) |
E-M Solutions |
85,745 | | 85,745 | ||||||||||
| Shanghai (SH E-MS) |
E-M Solutions |
| 430,000 | 430,000 | ||||||||||
| Shanghai (SME) |
PCB | | 416,761 | 416,761 | ||||||||||
| Shanghai (SMST/SP) |
PCB | | 521,257 | 521,257 | ||||||||||
| Shanghai (SKE)(3) |
PCB | 3,294 | 135,207 | 138,501 | ||||||||||
| Shenzhen (SZ) |
E-M Solutions |
286,000 | | 286,000 | ||||||||||
| Zhongshan (ZS) |
PCB | | 1,140,000 | 1,140,000 | ||||||||||
|
|
|
|
|
|
|
|||||||||
| Total |
788,021 | 7,677,056 | 8,465,077 | |||||||||||
36
Table of Contents
We maintain our properties in good operating condition. We believe that our properties are suitable and adequate for us to operate at present levels, and the productive capacity and extent of utilization of the facilities are appropriate for our existing manufacturing requirements.
| (1) | Location of our headquarters and not a manufacturing facility |
| (2) | Facility / warehouse to be shutdown or consolidated into other facilities in 2016 |
| (3) | Drilling and tooling process facility |
| ITEM 3. | LEGAL PROCEEDINGS |
From time to time, we may become a party to various legal proceedings arising in the ordinary course of our business. There can be no assurance that we will prevail in any such litigation. We believe that the amount of any reasonably possible loss for known matters would not be material to our financial statements; however, the outcome of these actions is inherently difficult to predict. In the event of an adverse outcome, the ultimate potential loss could have a material adverse effect on our financial condition, results of operations, or cash flows in a particular period.
| ITEM 4. | MINE SAFETY DISCLOSURES |
Not applicable
PART II
| ITEM 5. | MARKET FOR REGISTRANTS COMMON EQUITY, RELATED STOCKHOLDER MATTERS AND ISSUER PURCHASES OF EQUITY SECURITIES |
Historical Trading Price
Our common stock has been listed on the Nasdaq Global Select Market under the symbol TTMI since September 21, 2000. The following table sets forth the quarterly high and low sales prices of our common stock as reported on the Nasdaq Global Select Market for the periods indicated.
| High | Low | |||||||
| 2015: |
||||||||
| First Quarter |
$ | 9.27 | $ | 6.87 | ||||
| Second Quarter |
$ | 10.93 | $ | 8.77 | ||||
| Third Quarter |
$ | 10.18 | $ | 6.09 | ||||
| Fourth Quarter |
$ | 8.31 | $ | 5.96 | ||||
| 2014: |
||||||||
| First Quarter |
$ | 8.75 | $ | 7.33 | ||||
| Second Quarter |
$ | 8.49 | $ | 7.24 | ||||
| Third Quarter |
$ | 8.44 | $ | 6.72 | ||||
| Fourth Quarter |
$ | 7.73 | $ | 5.59 | ||||
As of February 18, 2016, there were approximately 293 holders of record of our common stock. The closing sale price of our common stock on the Nasdaq Global Select Market on February 18, 2016 was $6.46.
Dividend Policy
TTM Technologies, Inc. has not declared or paid any dividends since 2000 and does not anticipate paying any cash dividends in the foreseeable future. TTM Technologies, Inc. presently intends to retain any future earnings to service debt and to finance future operations and the expansion of its business. In addition, TTM Technologies, Inc. debt agreements contain restrictions and limitations on the declaration and payment of dividends and distributions.
37
Table of Contents
STOCK PRICE PERFORMANCE GRAPH
The performance graph below compares, for the period from December 31, 2010 to December 28, 2015, the cumulative total stockholder return on our common stock against the cumulative total return of:
| | the NASDAQ Composite Index; and |
| | the Dow Jones U.S. Electrical Components & Equipment Index. |
The graph assumes $100 was invested in our common stock on December 31, 2010, and an investment in NASDAQ Composite Index and the Dow Jones US Electrical Components & Equipment Index. The stock performance shown on the graph below represents historical stock performance and is not necessarily indicative of future stock performance.
COMPARISON OF 5 YEAR CUMULATIVE TOTAL RETURN*
Among TTM Technologies, Inc., the NASDAQ Composite Index,
and the Dow Jones US Electrical Components & Equipment Index
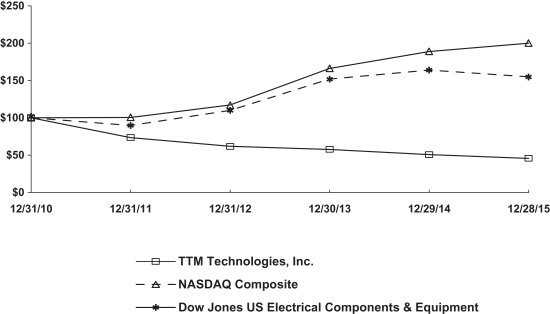
| * | $100 invested on December 31, 2010 in stock or index, including reinvestment of dividends. |
| 12/31/10 | 12/31/11 | 12/31/12 | 12/30/13 | 12/29/14 | 12/28/15 | |||||||||||||||||||
| TTM Technologies, Inc. |
100.00 | 73.46 | 61.60 | 57.57 | 50.60 | 45.64 | ||||||||||||||||||
| NASDAQ Composite |
100.00 | 100.53 | 116.92 | 166.19 | 188.78 | 199.95 | ||||||||||||||||||
| Dow Jones US Electrical Components & Equipment |
100.00 | 89.60 | 109.78 | 151.78 | 163.83 | 154.73 | ||||||||||||||||||
The performance graph above shall not be deemed filed for purposes of Section 18 of the Exchange Act, or otherwise subject to the liability of that section. The performance graph above will not be deemed incorporated by reference into any filing of our company under the Securities Act of 1933, as amended, or the Exchange Act.
38
Table of Contents
| ITEM 6. | SELECTED FINANCIAL DATA |
The selected historical financial data presented below are derived from our consolidated financial statements. The selected financial data should be read in conjunction with Item 7. Managements Discussion and Analysis of Financial Condition and Results of Operations and our consolidated financial statements and the notes thereto included elsewhere in this report.
| Year Ended | ||||||||||||||||||||
| December 28, 2015(1)(2) |
December 29, 2014(2) |
December 30, 2013(2) |
December 31, 2012 |
December 31, 2011 |
||||||||||||||||
| (In thousands, except per share data) | ||||||||||||||||||||
| Consolidated Statement of Operations Data: |
||||||||||||||||||||
| Net sales |
$ | 2,095,488 | $ | 1,325,717 | $ | 1,368,215 | $ | 1,348,668 | $ | 1,428,639 | ||||||||||
| Cost of goods sold |
1,785,351 | 1,131,028 | 1,150,372 | 1,123,669 | 1,127,326 | |||||||||||||||
|
|
|
|
|
|
|
|
|
|
|
|||||||||||
| Gross profit |
310,137 | 194,689 | 217,843 | 224,999 | 301,313 | |||||||||||||||
|
|
|
|
|
|
|
|
|
|
|
|||||||||||
| Operating expenses: |
||||||||||||||||||||
| Selling and marketing |
57,361 | 36,919 | 37,149 | 35,957 | 36,891 | |||||||||||||||
| General and administrative |
167,669 | 100,999 | 105,924 | 98,005 | 92,682 | |||||||||||||||
| Amortization of definite-lived intangibles |
18,888 | 8,387 | 9,332 | 14,637 | 17,311 | |||||||||||||||
| Gain on sale of assets |
(2,504 | ) | | (17,917 | ) | | | |||||||||||||
| Restructuring charges |
7,381 | | 3,445 | | | |||||||||||||||
| Impairment of long-lived assets |
| 1,845 | 10,782 | 18,082 | 48,125 | |||||||||||||||
| Impairment of goodwill and definite-lived intangibles |
| | | 200,335 | 15,184 | |||||||||||||||
|
|
|
|
|
|
|
|
|
|
|
|||||||||||
| Total operating expenses |
248,795 | 148,150 | 148,715 | 367,016 | 210,193 | |||||||||||||||
|
|
|
|
|
|
|
|
|
|
|
|||||||||||
| Operating income (loss) |
61,342 | 46,539 | 69,128 | (142,017 | ) | 91,120 | ||||||||||||||
| Other income (expense): |
||||||||||||||||||||
| Interest expense |
(59,753 | ) | (23,830 | ) | (24,031 | ) | (25,784 | ) | (26,504 | ) | ||||||||||
| Loss on extinguishment of debt |
(802 | ) | (506 | ) | (10,743 | ) | (5,527 | ) | | |||||||||||
| Other, net |
8,189 | 88 | 5,418 | 4,956 | 8,616 | |||||||||||||||
|
|
|
|
|
|
|
|
|
|
|
|||||||||||
| Total other expense, net |
(52,366 | ) | (24,248 | ) | (29,356 | ) | (26,355 | ) | (17,888 | ) | ||||||||||
| Income (loss) before income taxes |
8,976 | 22,291 | 39,772 | (168,372 | ) | 73,232 | ||||||||||||||
| Income tax provision |
(34,594 | ) | (7,598 | ) | (15,879 | ) | (12,728 | ) | (26,005 | ) | ||||||||||
|
|
|
|
|
|
|
|
|
|
|
|||||||||||
| Net (loss) income |
(25,618 | ) | 14,693 | 23,893 | (181,100 | ) | 47,227 | |||||||||||||
| Less: Net (income) loss attributable to the non-controlling interest |
(264 | ) | | (2,016 | ) | 6,505 | (5,359 | ) | ||||||||||||
|
|
|
|
|
|
|
|
|
|
|
|||||||||||
| Net (loss) income attributable to TTM Technologies, Inc. stockholders |
$ | (25,882 | ) | $ | 14,693 | $ | 21,877 | $ | (174,595 | ) | $ | 41,868 | ||||||||
|
|
|
|
|
|
|
|
|
|
|
|||||||||||
| (Loss) earnings per common share attributable to TTM Technologies, Inc. stockholders: |
||||||||||||||||||||
| Basic |
$ | (0.28 | ) | $ | 0.18 | $ | 0.27 | $ | (2.13 | ) | $ | 0.52 | ||||||||
| Diluted |
$ | (0.28 | ) | $ | 0.18 | $ | 0.26 | $ | (2.13 | ) | $ | 0.51 | ||||||||
| Weighted average common shares: |
||||||||||||||||||||
| Basic |
92,675 | 83,238 | 82,506 | 81,800 | 81,176 | |||||||||||||||
| Diluted |
92,675 | 83,941 | 83,132 | 81,800 | 81,944 | |||||||||||||||
| Other Financial Data: |
||||||||||||||||||||
| Depreciation of property, plant and equipment |
$ | 133,508 | $ | 95,349 | $ | 92,120 | $ | 84,286 | $ | 69,698 | ||||||||||
| (1) | Our results for the year ended December 28, 2015 include 211 days of activity of Viasystems Group, Inc., which we acquired on May 31, 2015. Additionally, our results include $34.4 million of bank fees and legal, accounting and other professional service costs associated with the acquisition of Viasystems. |
| (2) | Beginning in 2013, we operate on a 52 or 53 week year ending on the Monday nearest December 31. Fiscal 2015, 2014 and 2013 were 52 weeks and ended on December 28, 2015, December 29, 2014 and December 30, 2013, respectively. Prior to 2013, our fiscal year always ended on December 31. |
39
Table of Contents
| As of | ||||||||||||||||||||
| December 28, 2015 |
December 29, 2014 |
December 30, 2013 |
December 31, 2012 |
December 31, 2011 |
||||||||||||||||
| (In thousands) | ||||||||||||||||||||
| Consolidated Balance Sheet Data: |
||||||||||||||||||||
| Working capital |
$ | 277,526 | $ | 302,111 | $ | 346,988 | $ | 395,732 | $ | 234,394 | ||||||||||
| Total assets |
2,671,304 | 1,601,289 | 1,673,575 | 1,676,962 | 1,749,069 | |||||||||||||||
| Long-term debt, including current maturities |
1,201,957 | 502,687 | 573,743 | 557,545 | 489,400 | |||||||||||||||
| TTM Technologies, Inc. stockholders equity |
819,105 | 715,464 | 705,295 | 653,947 | 808,917 | |||||||||||||||
| Year Ended | ||||||||||||||||||||
| December 28, 2015 |
December 29, 2014 |
December 30, 2013 |
December 31, 2012 |
December 31, 2011 |
||||||||||||||||
| (In thousands) | ||||||||||||||||||||
| Supplemental Data: |
||||||||||||||||||||
| Adjusted EBITDA(1) |
$ | 285,673 | $ | 166,044 | $ | 181,293 | $ | 190,592 | $ | 258,245 | ||||||||||
| Net cash provided by operating activities |
237,462 | 129,810 | 71,388 | 182,565 | 179,345 | |||||||||||||||
| Net cash (used in) provided by investing activities |
(247,660 | ) | (108,571 | ) | (35,689 | ) | (136,444 | ) | (140,617 | ) | ||||||||||
| Net cash (used in) provided by financing activities |
(5,756 | ) | (77,141 | ) | 12,985 | 45,068 | (55,215 | ) | ||||||||||||
| (1) | EBITDA means earnings before interest expense, income taxes, depreciation and amortization. Adjusted EBITDA means earnings before interest expense, income taxes, depreciation, amortization, stock-based compensation, gain on sale of assets, acquisition-related costs, and impairments, restructuring and other charges. This is a non-GAAP financial measurement used by us to enhance the understanding of our operating results. Adjusted EBITDA is a key measure we use to evaluate our operations. We provide our adjusted EBITDA because we believe that investors and securities analysts will find adjusted EBITDA to be a useful measure for evaluating our operating performance and comparing our operating performance with that of similar companies that have different capital structures and for evaluating our ability to meet our future debt service, capital expenditures, and working capital requirements. However, adjusted EBITDA should not be considered as an alternative to cash flows from operating activities as a measure of liquidity or as an alternative to net income as a measure of operating results in accordance with accounting principles generally accepted in the United States. The following provides a reconciliation of adjusted EBITDA to the financial information in our consolidated statements of operations. |
| Year Ended | ||||||||||||||||||||
| December 28, 2015 |
December 29, 2014 |
December 30, 2013 |
December 31, 2012 |
December 31, 2011 |
||||||||||||||||
| (In thousands) | ||||||||||||||||||||
| Net (loss) income |
$ | (25,618 | ) | $ | 14,693 | $ | 23,893 | $ | (181,100 | ) | $ | 47,227 | ||||||||
| Add back items: |
||||||||||||||||||||
| Income tax provision |
34,594 | 7,598 | 15,879 | 12,728 | 26,005 | |||||||||||||||
| Interest expense |
59,753 | 23,830 | 24,031 | 25,784 | 26,504 | |||||||||||||||
| Depreciation of property, plant and equipment |
133,508 | 95,349 | 92,120 | 84,286 | 69,698 | |||||||||||||||
| Amortization of definite-lived intangibles |
18,888 | 8,387 | 9,332 | 14,684 | 17,427 | |||||||||||||||
|
|
|
|
|
|
|
|
|
|
|
|||||||||||
| EBITDA |
221,125 | 149,857 | 165,255 | (43,618 | ) | 186,861 | ||||||||||||||
| Stock-based compensation |
9,661 | 7,800 | 8,985 | 10,266 | 8,075 | |||||||||||||||
| Gain on sale of assets |
(2,504 | ) | | (17,917 | ) | | | |||||||||||||
| Acquisition-related costs |
34,448 | 5,981 | | | | |||||||||||||||
| Impairments, restructuring, and other charges |
22,943 | 2,406 | 24,970 | 223,944 | 63,309 | |||||||||||||||
|
|
|
|
|
|
|
|
|
|
|
|||||||||||
| Adjusted EBITDA |
$ | 285,673 | $ | 166,044 | $ | 181,293 | $ | 190,592 | $ | 258,245 | ||||||||||
|
|
|
|
|
|
|
|
|
|
|
|||||||||||
40
Table of Contents
| ITEM 7. | MANAGEMENTS DISCUSSION AND ANALYSIS OF FINANCIAL CONDITION AND RESULTS OF OPERATIONS |
This financial review presents our operating results for each of our three most recent fiscal years and our financial condition at December 28, 2015. Except for historical information contained herein, the following discussion contains forward-looking statements which are subject to known and unknown risks, uncertainties and other factors that may cause our actual results to differ materially from those expressed or implied by such forward-looking statements. We discuss such risks, uncertainties and other factors throughout this report and specifically under Item 1A of Part I of this report, Risk Factors. In addition, the following discussion should be read in connection with the information presented in our consolidated financial statements and the related notes to our consolidated financial statements.
COMPANY OVERVIEW
We are a leading global printed circuit board (PCB) manufacturer, focusing on quick-turn and technologically advanced PCBs and electro-mechanical solutions (E-M Solutions). We focus on providing time-to-market and advanced technology products and offer a one-stop manufacturing solution to our customers from engineering support to prototype development through final volume production. This one-stop manufacturing solution allows us to align technology development with the diverse needs of our customers and to enable them to reduce the time required to develop new products and bring them to market. We serve a diversified customer base consisting of approximately 1,500 customers in various markets throughout the world, including manufacturers of networking/communications infrastructure products, smartphones, tablets and ultra notebooks, as well as the aerospace and defense, automotive controls and information systems, high-end computing, and medical, industrial and instrumentation related products. Our customers include both original equipment manufacturers (OEMs) and electronic manufacturing services (EMS) providers.
RECENT DEVELOPMENTS
On May 31, 2015, we completed the acquisition of Viasystems Group, Inc. (Viasystems), for total consideration of $248.8 million in cash and 15.1 million shares of TTM common stock. Additionally, in connection with the completion of the acquisition, we assumed and refinanced Viasystems debt, which was approximately $669.0 million. Viasystems was a worldwide provider of complex multi-layer rigid, flexible, and rigid-flex PCBs and custom electronic assemblies. Viasystems products were found in a wide variety of commercial products, including automotive engine controls, hybrid converters, automotive electronics for navigation, safety, and entertainment, telecommunications switching equipment, data networking equipment, computer storage equipment, semiconductor test equipment, wind and solar energy applications, off-shore drilling equipment, communications applications, flight control systems, and complex industrial, medical, and other technical instruments. Viasystems E-M Solutions services were bundled with its PCB products to provide an integrated solution to customers. Viasystems operated 15 manufacturing facilities worldwide: eight in the United States, five in the Peoples Republic of China (China), one each in Canada and Mexico. Viasystems served a diversified customer base of over 1,000 customers in various markets throughout the world.
On September 29, 2015, we announced a consolidation plan that will result in the closure of our facilities in Cleveland, Ohio, Milpitas, California and Juarez, Mexico (the Plan). The Plan is part of our integration strategy to improve total plant utilization, operational performance and customer focus following our recent acquisition of Viasystems. In accordance with the Plan, we will combine our Cleveland and Milpitas facilities into our North Jackson, Ohio and Silicon Valley, California facilities, respectively, and close our Juarez facility. As a result, during the year ended December 28, 2015, we recognized total restructuring charges of $7.4 million. These charges primarily represent severance expense associated with the Plan and other global realignment restructuring efforts, and are expected to be paid out by June 2016. We estimate that we will incur total charges of approximately $10.0 million to $15.0 million related to these closures. Additionally, our first quarter 2016 financial results will be negatively impacted as a result of the planned closure of these facilities.
41
Table of Contents
FINANCIAL OVERVIEW
For the fiscal year ended 2015, we experienced higher demand in our Cellular Phone end market compared to that of the same period in 2014. This increase in demand resulted in higher capacity utilization at our advanced technology plants resulting in higher net sales and gross margins. Additionally, we had improved operating efficiencies at certain of our North American plants.
While our customers include both OEMs and EMS providers, we measure customers based on OEM companies as they are the ultimate end customers. Sales to our 5 largest customers accounted for 37%, 44% and 41% of our net sales in fiscal years 2015, 2014 and 2013, respectively. We sell to OEMs both directly and indirectly through EMS providers.
The following table shows the percentage of our net sales attributable to each of the principal end markets we served for the periods indicated:
| End Markets(1)(2) |
2015(4) | 2014 | 2013 | |||||||||
| Aerospace and Defense |
14 | % | 16 | % | 15 | % | ||||||
| Automotive(2) |
13 | 2 | 2 | |||||||||
| Cellular Phone(3) |
21 | 23 | 20 | |||||||||
| Computing/Storage/Peripherals(3) |
12 | 13 | 20 | |||||||||
| Medical/Industrial/Instrumentation/Other |
13 | 10 | 8 | |||||||||
| Networking/Communications |
25 | 33 | 32 | |||||||||
| Other(2)(3) |
2 | 3 | 3 | |||||||||
|
|
|
|
|
|
|
|||||||
| Total |
100 | % | 100 | % | 100 | % | ||||||
|
|
|
|
|
|
|
|||||||
| (1) | Sales to EMS companies are classified by the end markets of their OEM customers. |
| (2) | Certain reclassifications of prior year end market percentages have been made to conform to the current year presentation. Beginning 2015, Automotive has been reclassified from the Other end market. Additionally, beginning in the first quarter of 2013, we reclassified substrate PCBs, which were included in the Other end market, into the end markets that the substrate PCBs are sold into predominantly Cellular Phone. |
| (3) | Smartphones are included in the Cellular Phone end market, tablets are included in the Computing/Storage/Peripherals end market and other mobile devices such as e-readers are included in the Other end market. |
| (4) | Amounts includes 211 days of activity of Viasystems, which we acquired on May 31, 2015. |
We derive revenues primarily from the sale of PCBs and custom electronic assemblies using customer-supplied engineering and design plans. We recognize revenues when persuasive evidence of a sales arrangement exists, the sales terms are fixed or determinable, title and risk of loss have transferred, and collectability is reasonably assured generally when products are shipped to the customer. Net sales consist of gross sales less an allowance for returns, which typically have been less than 3% of gross sales. We provide our customers a limited right of return for defective PCBs and backplane assemblies. We record an estimate for sales returns and allowances at the time of sale based on historical results. Purchase orders may be cancelled prior to shipment. We generally charge customers a fee, based on the percentage completed, if an order is cancelled once it has entered production.
Cost of goods sold consists of materials, labor, outside services, and overhead expenses incurred in the manufacture and testing of our products. Shipping and handling fees and related freight costs and supplies associated with shipping products are also included as a component of cost of goods sold. Many factors affect our gross margin, including capacity utilization, product mix, production volume, and yield. We generally do not participate in any significant long-term contracts with suppliers, and we believe there are a number of potential suppliers for the raw materials we use.
Selling and marketing expenses consist primarily of salaries, labor related benefits, and commissions paid to our internal sales force, independent sales representatives, and our sales support staff, as well as costs associated with marketing materials and trade shows.
42
Table of Contents
General and administrative costs primarily include the salaries for executive, finance, accounting, information technology, facilities and human resources personnel, as well as insurance expenses, expenses for accounting and legal assistance, incentive compensation expense, and gains or losses on the sale or disposal of property, plant and equipment.
CRITICAL ACCOUNTING POLICIES AND ESTIMATES
Our consolidated financial statements included in this report have been prepared in accordance with accounting principles generally accepted in the United States of America. The preparation of these financial statements requires us to make estimates and assumptions that affect the reported amounts of assets, liabilities, net sales and expenses, and related disclosure of contingent assets and liabilities.
A critical accounting policy is defined as one that is both material to the presentation of our consolidated financial statements and requires us to make judgments that could have a material effect on our financial condition or results of operations. These policies require us to make assumptions about matters that are highly uncertain at the time of the estimate. Different estimates we could reasonably have used, or changes in the estimates that are reasonably likely to occur, or could have a material effect on our financial condition or results of operations.
We base our estimates on historical experience and on various other assumptions that are believed to be reasonable under the circumstances, the results of which form the basis for making judgments about the carrying values of assets and liabilities that are not readily apparent from other sources. Management has discussed the development, selection and disclosure of these estimates with the audit committee of our board of directors. Actual results may differ from these estimates under different assumptions or conditions.
Our critical accounting policies include asset valuation related to bad debts and inventory; sales returns and allowances; impairment of long-lived assets, including goodwill and intangible assets; derivative instruments and hedging activities; realizability of deferred tax assets; and determining self-insurance reserves.
Allowance for Doubtful Accounts
We provide customary credit terms to our customers and generally do not require collateral. We perform ongoing credit evaluations of the financial condition of our customers and maintain an allowance for doubtful accounts based upon historical collections experience and judgments as to expected collectability of accounts. Our actual bad debts may differ from our estimates.
Inventories
In assessing the realizability of inventories, we are required to make judgments as to future demand requirements and compare these with current and committed inventory levels. When the market value of inventory is less than the carrying value, the inventory cost is written down to its estimated net realizable value, thereby establishing a new cost basis. Our inventory requirements may change based on our projected customer demand, market conditions, technological and product life cycle changes, longer or shorter than expected usage periods, and other factors that could affect the valuation of our inventories. We maintain certain finished goods inventories near certain key customer locations in accordance with agreements with those customers. Although this inventory is typically supported by valid purchase orders, should these customers ultimately not purchase these inventories, our results of operations and financial condition would be adversely affected.
Sales Returns and Allowances
We derive revenues primarily from the sale of PCBs and custom electronic assemblies using customer-supplied engineering and design plans. We recognize revenue when persuasive evidence of a sales arrangement exists, the sales terms are fixed or determinable, title and risk of loss have transferred, and collectability is reasonably assured generally when products are shipped to the customer. We provide our customers a limited right of return for defective PCBs and backplane assemblies. We accrue an estimate for sales returns and allowances at the time of sale using our judgment based on historical results and anticipated returns as a result of current period sales. To the extent actual experience varies from our historical experience, revisions to these allowances may be required.
43
Table of Contents
Long-lived Assets
We have significant long-lived tangible and intangible assets consisting of property, plant and equipment, definite-lived intangibles, and goodwill. We review these assets for impairment whenever events or changes in circumstances indicate that the carrying amount of such assets may not be recoverable. In addition, we perform an impairment test related to goodwill at least annually. As necessary, we make judgments regarding future cash flow forecasts in the assessment of impairment.
During the fourth quarter of each year, and when events and circumstances warrant an evaluation, we perform an impairment assessment of goodwill, which may require the use of a fair-value based analysis. We first assesses qualitative factors to determine whether it is more likely than not that the fair value of a reporting unit is less than its carrying amount. If we conclude that it is more likely than not that the fair value of a reporting units is less than its carrying amount, we conduct a two-step quantitative goodwill impairment test. We determine the fair value of our reporting units based on discounted cash flows and market approach analyses as considered necessary. We consider factors such as the state of the economy and reduced expectations for future cash flows coupled with a decline in our market capitalization for a sustained period as indicators for potential goodwill impairment. If the reporting units carrying amount exceeds its estimated fair value, a second step must be performed to measure the amount of the goodwill impairment loss, if any. The second step compares the implied fair value of the reporting units goodwill, determined in the same manner as the amount of goodwill recognized in a business combination, with the carrying amount of such goodwill. If the carrying amount of the reporting units goodwill exceeds the implied fair value of that goodwill, an impairment loss is recognized in an amount equal to that excess. We periodically evaluate whether events and circumstances have occurred, such that the potential for reduced expectations for future cash flows coupled with a further decline in the market price of our stock and market capitalization may indicate that the remaining balance of goodwill and definite-lived intangible assets may not be recoverable. If factors indicate that assets are impaired, we would be required to reduce the carrying value of our goodwill and definite-lived intangible assets which may result in an impairment charge.
We also assess other long-lived assets, specifically definite-lived intangibles and property, plant and equipment, for potential impairment given similar impairment indicators. When indicators of impairment exist related to our long-lived tangible assets and definite-lived intangible assets, we use an estimate of the undiscounted net cash flows and comparison to like-kind assets, as appropriate, in measuring whether the carrying amount of the assets is recoverable. Measurement of the amount of impairment, if any, is based upon the difference between the assets carrying value and estimated fair value. Fair value is determined through various valuation techniques, including cost-based, market and income approaches as considered necessary, which involve judgments related to future cash flows and the application of the appropriate valuation model. During the years ended 2014 and 2013 we recorded impairment charges to reduce the carrying value of certain long-lived assets in the PCB operating segment. See Note 4 to our consolidated financial statements.
Assets Held for Sale We classify assets to be sold as assets held for sale when (i) we have approved and commit to a plan to sell the asset, (ii) the asset is available for immediate sale in its present condition, (iii) an active program to locate a buyer and other actions required to sell the asset have been initiated, (iv) the sale of the asset is probable, (v) the asset is being actively marketed for sale at a price that is reasonable in relation to its current fair value, and (vi) it is unlikely that significant changes to the plan will be made or that the plan will be withdrawn. Assets classified as held for sale are recorded at the lower of the carrying amount or fair value less the cost to sell.
Assets Held for Use If a decision to dispose of an asset or a business is made and the held for sale criteria are not met, it is considered held for use. Assets of the business are evaluated for recoverability in the following order: (i) assets other than goodwill, property and intangibles; (ii) property and intangibles subject to amortization; and (iii) goodwill. In evaluating the recoverability of property and intangible assets subject to amortization, in a held for use business, the carrying value is first compared to the sum of the undiscounted cash flows expected to result from the use and eventual disposition. If the carrying value exceeds the undiscounted expected cash flows, then a fair value analysis is performed. An impairment charge is recognized if the carrying value exceeds the fair value.
44
Table of Contents
Derivative Instruments and Hedging Activities
As a matter of policy, we use derivatives for risk management purposes, and we do not use derivatives for speculative purposes. Derivatives are typically entered into as hedges of changes in interest rates, currency exchange rates, and other risks.
When we determine to designate a derivative instrument as a cash flow hedge, we formally document the hedging relationship and its risk management objective and strategy for undertaking the hedge, the hedging instrument, the hedged item, the nature of the risk being hedged, how the hedging instruments effectiveness in offsetting the hedged risk will be assessed, and a description of the method of measuring ineffectiveness. We also formally assess, both at the hedges inception and on an ongoing basis, whether the derivative that is used in hedging transactions is highly effective in offsetting changes in cash flows of hedged items.
Derivative financial instruments are recognized as either assets or liabilities on the consolidated balance sheet with measurement at fair value. Fair value of the derivative instruments is determined using pricing models developed based on the underlying swap interest rate, foreign currency exchange rates, and other observable market data as appropriate. The values are also adjusted to reflect nonperformance risk of the counterparty and our company, as necessary. For derivatives that are designated as a cash flow hedge, changes in the fair value of the derivative are recognized in accumulated other comprehensive income, to the extent the derivative is effective at offsetting the changes in cash flow being hedged until the hedged item affects earnings. To the extent there is any hedge ineffectiveness, changes in fair value relating to the ineffective portion are immediately recognized in earnings. Changes in the fair value of derivatives that are not designated as hedges are recorded in earnings each period.
Income Taxes
Deferred income tax assets are reviewed for recoverability, and valuation allowances are provided, when necessary, to reduce deferred income tax assets to the amounts that are more likely than not to be realized based on our estimate of future taxable income. At December 28, 2015, we have net noncurrent deferred income tax liabilities of $13.1 million, which is net of the $84.7 million net noncurrent deferred tax assets. At December 28, 2015, our net noncurrent deferred income tax assets of $84.7 million are net of a valuation allowance of approximately $234.2 million. Should our expectations of taxable income change in future periods, it may be necessary to adjust our valuation allowance, which could affect our results of operations in the period such a determination is made. We record income tax provision or benefit during interim periods at a rate that is based on expected results for the full year. If future changes in market conditions cause actual results for the year to be more or less favorable than those expected, adjustments to the effective income tax rate could be required.
In addition, we are subject to income taxes in the United States and foreign jurisdictions. Significant judgment is required in determining our worldwide provision for income taxes. In the ordinary course of our business, there are many transactions for which the ultimate tax determination is uncertain. Additionally, our calculations of income taxes are based on our interpretations of applicable tax laws in the jurisdictions in which we file.
Self Insurance
We are primarily self-insured in North America for group health insurance and workers compensation benefits provided to our U.S. employees, and we purchase insurance to protect against annual claims at the individual and aggregate level. We estimate our exposure for claims incurred but not reported at the end of each reporting period. We use our judgment using our historical claim data and information and analysis provided by actuarial and claim advisors, our insurance carriers and brokers on an annual basis to estimate our liability for these claims. This liability is subject to individual insured stop-loss coverage of $200,000 per individual for the recently acquired Viasystems subsidiaries and $300,000 per individual for existing TTM subsidiaries for group health insurance and $250,000 for workers compensation benefits. Our actual claims experience may differ from our estimates.
45
Table of Contents
RESULTS OF OPERATIONS
The Viasystems acquisition occurred on May 31, 2015. Accordingly, the results of operations of Viasystems are not included in our fiscal years ended 2014 and 2013, and our fiscal year ended 2015 only includes the last seven fiscal months Viasystems 2015 results of operations. The acquisition has had and will continue to have a significant effect on our operations as discussed in the various comparisons noted below:
| For the Year Ended | ||||||||||||
| December 28, 2015 |
December 29, 2014 |
December 30, 2013 |
||||||||||
| Net sales |
100.0 | % | 100.0 | % | 100.0 | % | ||||||
| Cost of goods sold |
85.2 | 85.3 | 84.1 | |||||||||
|
|
|
|
|
|
|
|||||||
| Gross profit |
14.8 | 14.7 | 15.9 | |||||||||
|
|
|
|
|
|
|
|||||||
| Operating expenses: |
||||||||||||
| Selling and marketing |
2.7 | 2.8 | 2.7 | |||||||||
| General and administrative |
8.0 | 7.6 | 7.7 | |||||||||
| Amortization of definite-lived intangibles |
0.9 | 0.7 | 0.7 | |||||||||
| Gain on sale of assets |
(0.1 | ) | | (1.3 | ) | |||||||
| Restructuring charges |
0.4 | | 0.3 | |||||||||
| Impairment of long-lived assets |
| 0.1 | 0.8 | |||||||||
|
|
|
|
|
|
|
|||||||
| Total operating expenses |
11.9 | 11.2 | 10.9 | |||||||||
|
|
|
|
|
|
|
|||||||
| Operating income |
2.9 | 3.5 | 5.0 | |||||||||
| Other income (expense): |
||||||||||||
| Interest expense |
(2.9 | ) | (1.8 | ) | (1.7 | ) | ||||||
| Loss on extinguishment of debt |
| | (0.8 | ) | ||||||||
| Other, net |
0.4 | | 0.4 | |||||||||
|
|
|
|
|
|
|
|||||||
| Total other expense, net |
(2.5 | ) | (1.8 | ) | (2.1 | ) | ||||||
|
|
|
|
|
|
|
|||||||
| Income before income taxes |
0.4 | 1.7 | 2.9 | |||||||||
| Income tax provision |
(1.6 | ) | (0.6 | ) | (1.2 | ) | ||||||
|
|
|
|
|
|
|
|||||||
| Net (loss) income |
(1.2 | ) | 1.1 | 1.7 | ||||||||
| Less: Net income attributable to the non-controlling interest |
| | (0.1 | ) | ||||||||
|
|
|
|
|
|
|
|||||||
| Net (loss) income attributable to TTM Technologies, Inc. stockholders |
(1.2 | )% | 1.1 | % | 1.6 | % | ||||||
|
|
|
|
|
|
|
|||||||
As a result of the May 31, 2015 acquisition of Viasystems and the ongoing integration activities, we have reassessed our reportable operating segments and determined that we have two reportable operating segments: PCB and E-M Solutions. This determination was made based on the criteria of earning revenues and incurring expenses, our organizational structure which has segment managers who report to the chief operating decision maker and discrete financial information, and the aggregation of similar operating segments into reportable operating segments.
46
Table of Contents
The following table compares net sales by reportable segment for fiscal years ended 2015, 2014 and 2013:
| For the Year Ended | ||||||||||||
| December 28, 2015 |
December 29, 2014 |
December 30, 2013 |
||||||||||
| (In thousands) | ||||||||||||
| Net Sales: |
||||||||||||
| PCB |
$ | 1,944,041 | $ | 1,251,665 | $ | 1,305,862 | ||||||
| E-M Solutions |
158,655 | 76,545 | 65,202 | |||||||||
|
|
|
|
|
|
|
|||||||
| Total sales |
2,102,696 | 1,328,210 | 1,371,064 | |||||||||
| Inter-segment sales |
(7,208 | ) | (2,493 | ) | (2,849 | ) | ||||||
|
|
|
|
|
|
|
|||||||
| Total net sales |
$ | 2,095,488 | $ | 1,325,717 | $ | 1,368,215 | ||||||
|
|
|
|
|
|
|
|||||||
Net Sales
Total net sales increased $769.8 million, or 58.1%, from $1,325.7 million for the year ended December 29, 2014 to $2,095.5 million for the year ended December 28, 2015. Net sales for the PCB operating segment, excluding inter-segment sales, increased $687.7 million, or 55.0%, from $1,249.5 million for the year ended December 29, 2014 to $1,937.2 million for the year ended December 28, 2015. This increase is primarily due to the additional sales resulting from the acquisition of Viasystems, which accounted for $582.3 million in PCB sales for the year ended December 28, 2015. Additionally, the increase in PCB sales is due to higher demand in our Cellular Phone end markets, partially offset with lower demand in our Networking/Communications end market. These changes, including the sales from Viasystems, resulted in a 110% increase in PCB shipments from the year ended December 29, 2014. In addition, the average PCB selling price decreased 25%, which was driven by a product mix shift resulting from the acquisition. Net sales for the E-M Solutions operating segment, excluding inter-segment sales, increased $82.1 million, from $76.2 million for the year ended December 29, 2014 to $158.3 million for the year ended December 28, 2015. This increase is due to the acquisition of Viasystems, which accounted for $82.0 million in E-M Solutions sales for the year ended December 28, 2015.
Total net sales decreased $42.5 million, or 3.1%, from $1,368.2 million for the year ended December 30, 2013 to $1,325.7 million for the year ended December 29, 2014. Net sales for the PCB operating segment, excluding inter-segment sales, decreased $53.5 million, or 4.1%, from $1,303.0 million for the year ended December 30, 2013 to $1,249.5 million for the year ended December 29, 2014. This decrease was primarily due to the absence of net sales resulting from the sale of a controlling equity interest in a subsidiary in the second quarter of 2013, combined with lower demand in our Computing/Storage/Peripherals and Cellular Phone end markets in the first and second quarters of 2014. This decrease was partially offset by higher demand in our Cellular Phone end market in the second half of 2014. The overall decline in demand resulted in a 12% decrease in PCB shipments from the year December 30, 2013, and was partially offset by a 9% increase in the average PCB selling price, which was driven by product mix shift. Net sales for the E-M Solutions operating segment, excluding inter-segment sales, increased $11.0 million, or 16.9%, from $65.2 million for the year ended December 30, 2013 to $76.2 million for the year ended December 29, 2014. This increase was primarily due to the demand for backplane assemblies predominantly in our Networking/Communications end market.
The inter-segment sales are primarily sales from the PCB operating segment to the E-M Solutions operating segment.
Gross Margin
Overall gross margin increased from 14.7% for the year ended December 29, 2014 to 14.8% for the year ended December 28, 2015. Gross margin for the PCB operating segment increased from 15.0% for the year ended December 29, 2014 to 15.5% for the year ended December 28, 2015 primarily due to higher utilization at our advanced technology plants, partially offset by the acquisition of Viasystems with lower margins than our existing business and the $13.3 million of increased costs due to the fair value mark up of acquired inventory
47
Table of Contents
associated with the acquisition of Viasystems. Gross margin for the E-M Solutions operating segment decreased from 9.4% for the year ended December 29, 2014 to 6.6% for the year ended December 28, 2015 primarily due to the acquisition of Viasystems.
Overall gross margin decreased from 15.9% for the year ended December 30, 2013 to 14.7% for the year ended December 29, 2014. Gross margin for the PCB operating segment decreased from 16.3% for the year ended December 30, 2013 to 15.0% for the year ended December 29, 2014 primarily due to underutilization in the first and second quarters of 2014 caused by an increase in capacity to service an expected higher level of business which did not materialize. Additionally, in the third quarter of 2014, the PCB operating segment experienced a 5 day production shut down due to an unexpected power outage at one of our advanced technology production facilities which negatively impacted our productivity and yield improvement efforts as we were launching new products and significantly ramping for increased volumes. Gross margin for the E-M Solutions operating segment increased from 8.5% for the year ended December 30, 2013 to 9.4% for the year ended December 29, 2014 primarily due to higher volumes.
Selling and Marketing Expenses
Selling and marketing expenses increased $20.5 million, from $36.9 million for the year ended December 29, 2014 to $57.4 million for the year ended December 28, 2015. The increase primarily relates to additional marketing activity resulting from the acquisition of Viasystems. As a percentage of net sales, selling and marketing expenses were 2.8% for the year ended December 29, 2014, as compared to 2.7% for the year ended December 28, 2015. The decrease in selling and marketing expense as a percentage of net sales for the periods noted is primarily due to higher net sales.
Selling and marketing expenses decreased $0.2 million, or 0.5%, from $37.1 million for the year ended December 30, 2013 to $36.9 million for the year ended December 29, 2014. The decrease in selling and marketing expenses for the year ended December 29, 2014, was primarily due to reduced commissions and lower travel expenses over the comparable periods of the prior year. As a percentage of net sales, selling and marketing expenses were 2.7% and 2.8% for the years ended December 30, 2013 and December 29, 2014, respectively. The increase in selling and marketing expense as a percentage of net sales for the year ended December 29, 2014 was primarily due to lower net sales.
General and Administrative Expenses
General and administrative expenses increased $66.7 million from $101.0 million, or 7.6% of net sales, for the year ended December 30, 2014 to $167.7 million, or 8.0% of net sales, for the year ended December 28, 2015. The increase in expense is primarily due to $34.4 million of acquisition-related costs for the year ended December 28, 2015 related to the acquisition of Viasystems and seven months of general and administrative expense incurred related to Viasystems post acquisition through December 28, 2015.
General and administrative expenses decreased $4.9 million from $105.9 million, or 7.7% of net sales, for the year ended December 30, 2013 to $101.0 million, or 7.6% of net sales, for the year ended December 29, 2014. The decrease in general and administrative expense for the year ended December 29, 2014 is primarily due to costs savings resulting from the sale of our controlling equity interest in a subsidiary in the PCB operating segment and lower incentive compensation expense, offset by the $6.0 million of acquisition-related costs recorded in the third and fourth quarters of 2014.
Impairment of Long-Lived Assets and Restructuring Charges
For the year ended December 28, 2015, we incurred restructuring charges of $7.4 million related to the Plan announced on September 29, 2015, that will result in the closure of our facilities in Cleveland, Ohio, Milpitas, California, Juarez, Mexico and other global realignment efforts.
In connection with the Plan, during the year ended December 28, 2015, we recognized restructuring charges of $2.0 million in both our PCB and E-M Solutions segments and $3.4 million in our Corporate segment. These charges primarily represent severance expense associated with the Plan and other global realignment restructuring efforts and are expected to be paid out by June 2016. We estimate that we will incur total charges of approximately $10.0 million to $15.0 million related to these closures.
48
Table of Contents
For the year ended December 29, 2014 and December 30, 2013, in conjunction with the shutdown of the Suzhou, China facility, we recorded charges of $1.8 million and $10.8 million, respectively, primarily arising from the impairment of certain machinery and equipment. Additionally, in conjunction with the shutdown, we recorded restructuring charges of $3.4 million during the year ended December 30, 2013, consisting of separation costs associated with the layoff of 774 employees.
If forecasts and assumptions used to support the realizability of our long-lived assets change in the future, significant impairment or restructuring charges could result that would adversely affect our results of operations and financial condition.
Other Income (Expense)
Other expense, net increased $28.2 million from $24.2 million for the year ended December 29, 2014 to $52.4 million for the year ended December 28, 2015. The increase in other expense, net was primarily due to an increase in interest expense related to a new long-term borrowing and a revolver loan totaling $1,030.0 million at a weighted average interest rate of 5.7% that we secured in connection with the acquisition of Viasystems. The increase in other expense, net was partially offset by $6.4 million foreign currency and derivative transaction gains for the year ended December 28, 2015 compared to $1.2 million for the year ended December 29, 2014.
Other expense, net decreased $5.2 million from $29.4 million for the year ended December 30, 2013 to $24.2 million for year ended December 29, 2014. The decrease in other expense, net was primarily due to the absence of a $10.7 million loss on the extinguishment of debt related to repurchase of a portion of convertible senior notes due 2015 for the year ended December 30, 2013, offset by an increase in foreign currency transaction and derivative losses of $5.5 million, which includes a $3.6 million foreign currency transaction and derivative loss recognized in the first quarter of 2014 primarily due to the rapid depreciation of the RMB against the U.S. Dollar.
Income Taxes
Our effective tax rate for the years ended December 28, 2015 and December 29, 2014 was 385.4% and 34.1%, respectively. The provision for income taxes increased $27.0 million from an income tax expense of $7.6 million for the year ended December 29, 2014 to $34.6 million for the year ended December 28, 2015. The increase in income tax expense in 2015 is primarily due to the provision of a full valuation allowance on existing U.S. deferred tax assets, partially offset by the reversal of deferred tax liabilities related to our decision to indefinitely reinvest the foreign earnings attributable to our backplane assembly facility in Shanghai, China. Further, the income tax expense in 2015 is higher due to inclusion of Viasystems earnings from foreign subsidiaries in the second, third and fourth quarters of 2015.
Our effective tax rate is primarily impacted by tax rates in China and Hong Kong, the U.S. federal income tax rate, apportioned state income tax rates, generation of other credits and deductions available to us, valuation allowance establishment, and certain non-deductible items. Certain foreign losses generated are not more likely than not to be realizable, and thus no income tax benefit has been recognized on these losses. As of December 28, 2015, we had net deferred income tax liabilities of approximately $13.1 million; and as of December 29, 2014, we had net deferred income tax assets of approximately $2.9 million. As of the end of 2015, based on our forecast for future taxable earnings, we believe it is more likely than not that we will utilize the deferred income tax assets in future periods.
Our effective tax rate for the years ended December 29, 2014 and December 30, 2013 was 34.1% and 39.9%, respectively. The provision for income taxes decreased $8.3 million from an income tax expense of $15.9 million for the year ended December 30, 2013 to $7.6 million for the year ended December 29, 2014. The decrease in our provision for income taxes was primarily due to losses incurred for the first three quarters of 2014 compared to income in the same period of the prior year, combined with (i) a $1.5 million discrete tax benefit recorded in the first quarter of 2014 resulting from the retroactive approval of the high technology enterprise status for a Chinese subsidiary, (ii) a $0.7 million discrete tax benefit recorded in the third quarter of 2014 resulting from the research and development deduction at a Chinese subsidiary, and (iii) the absence of local withholding taxes of approximately $4.9 million related to the sale of a controlling equity interest in a subsidiary in the second quarter of 2013.
49
Table of Contents
Liquidity and Capital Resources
Our principal sources of liquidity have been cash provided by operations, the issuance of convertible senior notes, and term and revolving debt. Our principal uses of cash have been to acquire Viasystems, finance capital expenditures, meet debt service requirements, fund working capital requirements, and refinance existing debt. We anticipate that servicing debt, financing capital expenditures, financing acquisitions, and funding working capital requirements will continue to be the principal demands on our cash in the future.
Cash flow provided by operating activities during the year ended December 28, 2015 was $237.5 million as compared to $129.8 million in the same period in 2014. The improved cash flow was the result of stronger operational performance. As of December 28, 2015, we had net working capital of approximately $277.5 million compared to $302.1 million as of December 29, 2014. For the year ended December 28, 2015, cash cycle days of 46 days were held constant as compared to the previous year.
Net cash used in investing activities was approximately $247.7 million for the year ended December 28, 2015 primarily reflecting the acquisition of Viasystems, net of cash acquired, in the amount of $169.2 million, and purchases of property, plant and equipment, net of proceeds from sales of property, plant and equipment and assets held for sale of $78.5 million.
Net cash used in financing activities was approximately $5.8 million for the year ended December 28, 2015 reflecting proceeds from long-term debt and a revolving loan totaling $1,030.0 million, offset by the repayment of $968.9 million of debt, including the assumed long-term debt in the acquisition of $669.0 million, payoff of the 2012 credit agreement term loan, the payoff of the remaining 2015 convertible senior notes, and payment of debt issuance costs and original issue discount of $67.4 million associated with the new long-term debt and revolver loans.
As of December 28, 2015, we had unrestricted cash and cash equivalents of approximately $259.1 million, of which approximately $176.6 million was held by our foreign subsidiaries. Of the cash and cash equivalents held by our foreign subsidiaries as of December 28, 2015, $175.0 million was located in Asia and $1.6 million was located in Europe and other locations. Cash and cash equivalents held by our foreign locations are expected to be used in local operations.
Our 2016 capital expenditure plan is expected to be in the range of $110.0 million to $120 million. The expenditures will fund capital equipment purchases to increase production capacity, especially for advanced technology manufacturing, comply with changing environmental regulations, replace aging equipment, and expand our technological capabilities.
Term and Revolving Loans
On May 31, 2015, in conjunction with the acquisition of Viasystems, we entered into a $950.0 million Term Loan Credit Agreement (Term Loan). Additionally, we entered into a $150.0 million U.S. Asset-Based Lending Credit Agreement (U.S. ABL) and a $150.0 million Asia Asset-Based Lending Credit agreement (Asia ABL). We drew $80.0 million of the U.S. ABL at the closing of the acquisition of Viasystems.
The Term Loan Credit agreement was issued at a discount at 96.5% and bears interest at a floating rate of LIBOR, with a 1.0% LIBOR floor, plus an applicable interest margin of 5.0%. At December 28, 2015, the weighted average interest rate on the outstanding borrowings under the Term Loan was 6.0%. There is no provision, other than an event of default, for the interest margin to increase. The Term Loan will mature on May 31, 2021. The Term Loan is secured by a significant amount of our assets and our domestic subsidiaries and a pledge of 65% of the voting stock of our first tier foreign subsidiaries and is structurally senior to our convertible senior notes. See Convertible Senior Notes due 2020 below.
The U.S. ABL consists of three tranches comprised of a revolving credit facility of up to $150.0 million, a letter of credit facility of up to $75.0 million, and swingline loans of up to $30.0 million, provided that at no time may amounts outstanding under the tranches exceed in aggregate $150.0 million or the applicable borrowing base, which is a percentage of the principal amount of Eligible Accounts, as defined in the U.S. ABL agreement. Borrowings under the U.S. ABL bear interest at a floating rate of LIBOR plus a margin of 175 basis points. At
50
Table of Contents
December 28, 2015, the weighted average interest rate on the outstanding borrowings under the U.S. ABL was 2.17%. Beginning in 2016, the applicable margin can vary based on the remaining availability of the facility, from 150 to 200 basis points for LIBOR-based loans. The U.S. ABL will mature on May 31, 2020. Loans made under the U.S. ABL are secured first by all of our domestic cash, receivables and inventories as well as by a second position against a significant amount of our assets and our domestic subsidiaries and a pledge of 65% of the voting stock of our first tier foreign subsidiaries and are structurally senior to our convertible senior notes. See Convertible Senior Notes due 2020 below. At December 28, 2015, $80.0 million of the U.S. ABL was outstanding and classified as a current liability.
We and our domestic subsidiaries have fully and unconditionally guaranteed the full and timely payment of all Term Loan and U.S. ABL related obligations.
The Asia ABL consists of two tranches comprised of a revolving credit facility of up to $150.0 million and a letter of credit facility of up to $100.0 million provided that at no time may amounts outstanding under both tranches exceed in aggregate $150.0 million or the applicable borrowing base, which is a percentage of the principal amount of Eligible Accounts, as defined in the Asia ABL agreement. Borrowings under the Asia ABL bear interest at a floating rate of LIBOR plus 175 basis points. There is no provision, other than an event of default, for the interest margin to increase. The Asia ABL will mature on May 22, 2020. Loans made under the Asia ABL are secured by a portion of our Asia Pacific cash and receivables and are structurally senior to our domestic obligations, including our convertible senior notes. See Convertible Senior Notes due 2020 below. Our Asia Pacific subsidiary and certain of its subsidiaries have fully and unconditionally guaranteed the full and timely payment of all Asia ABL related obligations. At December 28, 2015, none of the Asia ABL was outstanding.
We are required to make scheduled payments of the outstanding Term Loan balance on a quarterly basis beginning October 1, 2015. On October 1, 2015 the scheduled principal payment of $2.4 million was made. Based on certain parameters defined in the Term Loan agreement, we may be required to make an additional principal payment on an annual basis. For 2015, we are required to make an additional annual payment of $61.1 million, which is required to be paid in March 2016. In addition to the $61.1 million additional annual payment, we also intend to repay an additional $10 million to $20 million of the Term Loan in March 2016. As a result of our intentions and including the already scheduled January 2016 payment, approximately $77.4 million has been classified as short-term debt. This additional annual payment reduces future required quarterly scheduled payments. Any other outstanding balances under the Term Loan are due at the maturity date of May 31, 2021. Borrowings under the Term Loan are subject to various financial and operating covenants including maintaining a maximum total leverage ratio. Under the occurrence of certain events, the U.S. ABL and the Asia ABL are subject to various financial and operational covenants, including maintaining minimum fixed charge coverage ratios. At December 28, 2015, we were in compliance with the covenants under the Term Loan, the U.S. ABL and the Asia ABL.
We are also required to pay a commitment fee of 0.375% per annum on any unused portion of the U.S. ABL or Asia ABL. The U.S. ABL commitment fee may vary from 0.25% to 0.375% based on utilization levels. We incurred total commitment fees related to unused borrowing availability of $0.8 million, $0.6 million and $0.4 million for fiscal years ended 2015, 2014 and 2013, respectively. As of December 28, 2015, the outstanding amount of the Term Loan was $947.6 million, of which $77.4 million we expect to pay within one year and is included as short-term debt, with the remaining $870.2 million included as long-term debt. Additionally, $80.0 million of the U.S. ABL and none of the Asia ABL was outstanding as of December 28, 2015. Available borrowing capacity under the U.S. ABL and Asia ABL was $65.4 million and $142.0 million, which includes $4.6 million and $8.0 million, respectively, of outstanding letters of credit mentioned below at December 28, 2015.
Letters of Credit
We have up to $75.0 million and $100.0 million Letters of Credit Facilities available under the U.S. ABL and the Asia ABL, respectively. As of December 28, 2015, letters of credit in the amount of $4.6 million were outstanding under the U.S. ABL and $8.0 million were outstanding under the Asia ABL. We have other standby
51
Table of Contents
letters of credit outstanding in the amount of $2.9 million which expire by April 2016. These other standby letters of credit are securitized by cash collateral. As such, we have recorded such cash as restricted on the consolidated condensed balance sheet as of December 28, 2015.
Chinese Revolver
We are party to a revolving loan credit facility with a lender in China. Under this arrangement, the lender has made available to us approximately $35.5 million in unsecured borrowing with all terms of the borrowing to be negotiated at the time the Chinese Revolver is drawn upon. There are no commitment fees on the unused portion of the Chinese Revolver, and this arrangement expires in December 2016. As of December 28, 2015, the Chinese Revolver had not been drawn upon.
Convertible Senior Notes due 2020
We issued 1.75% convertible senior notes due December 15, 2020, in a public offering for an aggregate principal amount of $250.0 million. The convertible senior notes bear interest at a rate of 1.75% per annum. Interest is payable semiannually in arrears on June 15 and December 15 of each year. The convertible senior notes are senior unsecured obligations and rank equally to our future unsecured senior indebtedness and senior in right of payment to any of our future subordinated indebtedness. Offering expenses are being amortized to interest expense over the term of the convertible senior notes.
Conversion: At any time prior to March 15, 2020, holders may convert their convertible senior notes into cash and, if applicable, into shares of our common stock based on a conversion rate of 103.7613 shares of our common stock per $1,000 principal amount of convertible senior notes, subject to adjustment, under the following circumstances: (1) during any calendar quarter beginning after March 31, 2014 (and only during such calendar quarter), if the last reported sale price of our common stock for at least 20 trading days during the 30 consecutive trading days ending on the last trading day of the immediately preceding calendar quarter is greater than or equal to 130% of the applicable conversion price on each applicable trading day of such preceding calendar quarter; (2) during the five business day period after any 10 consecutive trading day period in which the trading price per note for each day of that 10 consecutive trading day period was less than 98% of the product of the last reported sale price of our common stock and the conversion rate on such day; or (3) upon the occurrence of specified corporate transactions described in the indenture governing the notes. As of December 28, 2015, none of the conversion criteria had been met.
On or after March 15, 2020 until the close of business on the third scheduled trading day preceding the maturity date, holders may convert their notes at any time, regardless of the foregoing circumstances. Upon conversion, for each $1,000 principal amount of notes, we will pay shares of our common stock, cash or a combination of cash and shares of our common stock at our election, if applicable, based on a daily conversion value calculated on a proportionate basis for each day of the 80 trading day observation period. All conversions occurring on the same date or on or after March 15, 2020 shall be settled using the same settlement method. Additionally, in the event of a fundamental change as defined in the indenture governing the notes, or other conversion rate adjustments such as share splits or combinations, other distributions of shares, cash or other assets to stockholders, including self-tender transactions (Other Conversion Rate Adjustments), the conversion rate may be modified to adjust the number of shares per $1,000 principal amount of the notes. As of December 28, 2015, none of the criteria for a fundamental change or a conversion rate adjustment had been met.
The maximum number of shares issuable upon conversion, including the effect of a fundamental change and subject to Other Conversion Rate Adjustments, would be 32.4 million.
Note Repurchase: We are not permitted to redeem the convertible senior notes at any time prior to maturity. In the event of a fundamental change or certain default events, as defined in the indenture governing the notes, holders may require us to repurchase for cash all or a portion of their convertible senior notes at a price equal to 100% of the principal amount, plus any accrued and unpaid interest.
In connection with the issuance of the convertible senior notes due 2020, we entered into a convertible note hedge and warrant transaction (the Call Spread Transaction), with respect to our common stock. The convertible note hedge consists of our option to purchase up to 25.9 million common stock shares at a price of $9.64 per
52
Table of Contents
share. The hedge expires on December 15, 2020 and can only be executed upon the conversion of the above mentioned convertible senior notes due 2020. Additionally, we sold warrants to purchase 25.9 million shares of our common stock at a price of $14.26 per share. The warrants expire ratably from March 2021 through January 2022. The Call Spread Transaction has no effect on the terms of the convertible senior notes due 2020 and reduces potential dilution by effectively increasing the conversion price of the convertible senior notes due 2020 to $14.26 per share of our common stock.
Based on our current level of operations, we believe that cash generated from operations, cash on hand and cash from the issuance of term and revolving debt will be adequate to meet our currently anticipated capital expenditure, debt service, and working capital needs for the next 12 months.
Contractual Obligations and Commitments
The following table provides information on our contractual obligations as of December 28, 2015:
| Contractual Obligations(1) |
Total | Less Than 1 Year |
1 -
3 Years |
4 -
5 Years |
After 5 Years |
|||||||||||||||
| (In thousands) | ||||||||||||||||||||
| Long-term debt obligations |
$ | 1,027,625 | $ | 157,375 | $ | 27,125 | $ | 95,000 | $ | 748,125 | ||||||||||
| Convertible debt obligations |
250,000 | | | 250,000 | | |||||||||||||||
| Interest on debt obligations |
311,791 | 61,164 | 114,345 | 106,403 | 29,879 | |||||||||||||||
| Foreign currency forward contract liabilities |
51 | 51 | | | | |||||||||||||||
| Equipment payables |
14,251 | 14,251 | | | | |||||||||||||||
| Purchase obligations |
69,054 | 69,054 | | | | |||||||||||||||
| Operating lease commitments |
27,603 | 8,332 | 8,819 | 4,049 | 6,403 | |||||||||||||||
|
|
|
|
|
|
|
|
|
|
|
|||||||||||
| Total contractual obligations |
$ | 1,700,375 | $ | 310,227 | $ | 150,289 | $ | 455,452 | $ | 784,407 | ||||||||||
|
|
|
|
|
|
|
|
|
|
|
|||||||||||
| (1) | Unrecognized uncertain tax benefits of $15.4 million are not included in the table above as the settlement timing is uncertain. |
Off Balance Sheet Arrangements
We do not currently have, nor have we ever had, any relationships with unconsolidated entities or financial partnerships, such as entities often referred to as structured finance or special purpose entities, which would have been established for the purpose of facilitating off-balance sheet arrangements or other contractually narrow or limited purposes. In addition, we do not engage in trading activities involving non-exchange traded contracts. As a result, we are not materially exposed to any financing, liquidity, market, or credit risk that could arise if we had engaged in these relationships.
Seasonality
As manufacturers of electronic components, orders for our products generally correspond to the production schedules of our customers. We historically experience higher net sales in the third and fourth quarters due to end customer demand in the fourth quarter for consumer electronics products. Seasonal fluctuations also include the Chinese New Year holidays in the first quarter, which typically results in lower net sales. We attribute this decline to shutdowns of our customers manufacturing facilities surrounding the Chinese New Year public holidays, which normally occur in January or February of each year.
Recently Issued Accounting Standards
In November 2015 the Financial Accounting Standards Board (FASB) issued Accounting Standards Update (ASU) No. 2015-17, Balance Sheet Classification of Deferred Taxes, which requires entities with a classified balance sheet to present all deferred tax assets and liabilities as non-current. We adopted the provisions of this
53
Table of Contents
update in the fourth quarter of 2015 on a prospective basis. The impact on our consolidated financial statements was not material.
In September 2015, the FASB issued ASU 2015-16, Simplifying the Accounting for Measurement-Period Adjustments, which requires that an acquirer recognize adjustments to provisional values of assets acquired and liabilities assumed in a business combination in the reporting period in which the adjustment amounts are determined and not on a retrospective basis. We adopted ASU 2015-16 in the third quarter of 2015, and our adoption did not have a material impact on our consolidated financial statements.
In April 2015, the FASB issued ASU 2015-03, Imputation of Interest, which requires an entity to record debt issuance costs related to a note reported in the balance sheet as a direct deduction from the face amount of that note. The update is effective for annual periods ending after December 15, 2015. Early application is permitted. The standard requires the use of the retrospective transition method. The impact on our consolidated financial statements is not expected to be material.
In May 2014, the FASB issued ASU 2014-09, Revenue from Contracts with Customers, which requires an entity to recognize the amount of revenue to which it expects to be entitled for the transfer of promised goods or services to customers. ASU 2014-09 will replace most existing revenue recognition guidance in U.S. GAAP when it becomes effective. The new standard is effective for us at the beginning of fiscal year 2018, however application of the standard is allowed as early as the beginning of fiscal 2017. The standard permits the use of either the retrospective or cumulative effect transition method. We are evaluating the effect that ASU 2014-09 will have on our consolidated financial statements and related disclosures. We have not yet selected a transition method nor have we determined the effect of the standard on our ongoing financial reporting.
| ITEM 7A. | QUANTITATIVE AND QUALITATIVE DISCLOSURES ABOUT MARKET RISK |
In the normal course of business operations we are exposed to risks associated with fluctuations in interest rates and foreign currency exchange rates. We address these risks through controlled risk management that includes the use of derivative financial instruments to economically hedge or reduce these exposures. We do not enter into derivative financial instruments for trading or speculative purposes.
We have not experienced any losses to date on any derivative financial instruments due to counterparty credit risk.
To ensure the adequacy and effectiveness of our interest rate and foreign exchange hedge positions, we continually monitor our interest rate swap positions and foreign exchange forward positions, both on a stand-alone basis and in conjunction with their underlying interest rate and foreign currency exposures, from an accounting and economic perspective. However, given the inherent limitations of forecasting and the anticipatory nature of the exposures intended to be hedged, we cannot assure that such programs will offset more than a portion of the adverse financial impact resulting from unfavorable movements in either interest or foreign exchange rates. In addition, the timing of the accounting for recognition of gains and losses related to mark-to-market instruments for any given period may not coincide with the timing of gains and losses related to the underlying economic exposures and, therefore, may adversely affect our consolidated operating results and financial position.
Interest rate risk
Our business is exposed to interest rate risk resulting from fluctuations in interest rates. Our interest expense is more sensitive to fluctuations in the general level of LIBOR interest rates than to changes in rates in other markets. Increases in interest rates would increase interest expenses relating to the outstanding variable rate borrowings of certain foreign subsidiaries and increase the cost of debt. Fluctuations in interest rates can also lead to significant fluctuations in the fair value of the debt obligations.
As of December 28, 2015, approximately 19.6% of our long term debt was based on fixed rates. Based on our borrowings as of December 28, 2015, an assumed 100 basis point change in variable rates would cause our annual interest cost to change by $6.5 million.
54
Table of Contents
Debt Instruments
The table below presents information about certain of our debt instruments as of December 28, 2015 and December 29, 2014.
| As of December 28, 2015 | ||||||||||||||||||||||||||||||||||||
| 2016 | 2017 | 2018 | 2019 | 2020 | Thereafter | Total | Fair Market Value |
Weighted Average Interest Rate |
||||||||||||||||||||||||||||
| (In thousands) | ||||||||||||||||||||||||||||||||||||
| US$ Variable Rate |
$ | 157,375 | $ | | $ | 27,125 | $ | 47,500 | $ | 47,500 | $ | 748,125 | $ | 1,027,625 | $ | 935,000 | 5.70 | % | ||||||||||||||||||
| US$ Fixed Rate |
| | | | 250,000 | | 250,000 | 230,950 | 1.75 | % | ||||||||||||||||||||||||||
|
|
|
|
|
|
|
|
|
|
|
|
|
|
|
|
|
|||||||||||||||||||||
| Total |
$ | 157,375 | $ | | $ | 27,125 | $ | 47,500 | $ | 297,500 | $ | 748,125 | $ | 1,277,625 | $ | 1,165,950 | ||||||||||||||||||||
|
|
|
|
|
|
|
|
|
|
|
|
|
|
|
|
|
|||||||||||||||||||||
| As of December 29, 2014 | ||||||||||||||||||||||||||||||||||||
| 2015 | 2016 | 2017 | 2018 | 2019 | Thereafter | Total | Fair Market Value |
Weighted Average Interest Rate |
||||||||||||||||||||||||||||
| (In thousands) | ||||||||||||||||||||||||||||||||||||
| US$ Variable Rate |
$ | 96,200 | $ | 177,600 | | | | | $ | 273,800 | $ | 273,816 | 2.55 | % | ||||||||||||||||||||||
| US$ Fixed Rate |
32,399 | | | | | $ | 250,000 | 282,399 | 274,510 | 1.92 | % | |||||||||||||||||||||||||
|
|
|
|
|
|
|
|
|
|
|
|
|
|
|
|
|
|||||||||||||||||||||
| Total |
$ | 128,599 | $ | 177,600 | | | | $ | 250,000 | $ | 556,199 | $ | 548,326 | |||||||||||||||||||||||
|
|
|
|
|
|
|
|
|
|
|
|
|
|
|
|
|
|||||||||||||||||||||
Foreign currency risks
In the normal course of business we are exposed to risks associated with fluctuations in foreign currency exchange rates associated with transactions that are denominated in currencies other than our functional currencies, as well as the effects of translating amounts denominated in a foreign currency to the U.S. Dollar as a normal part of our financial reporting process. Certain of our Asia Pacific operations utilize the Renminbi (RMB) and the Hong Kong Dollar (HKD) as the functional currencies, which results in recognition of translation adjustments included as a component of other comprehensive income. Our foreign exchange exposure results primarily from employee-related and other costs of running operations in foreign countries, foreign currency denominated purchases and translation of balance sheet accounts denominated in foreign currencies. Our primary foreign exchange exposure is to the RMB. For the year ended December 28, 2015, our consolidated statement of operations includes a net unrealized foreign exchange loss of approximately $0.4 million.
We enter into foreign currency forward contracts to mitigate the impact of changes in foreign currency exchange rates and to reduce the volatility of purchases and other obligations generated in currencies other than the functional currencies. Our foreign subsidiaries may at times purchase forward exchange contracts to manage their foreign currency risks in relation to certain purchases of machinery denominated in foreign currencies other than our foreign functional currency. The notional amount of the foreign exchange contracts as of December 28, 2015 and December 29, 2014 was approximately $1.6 million and $29.1 million, respectively. We have designated certain of these foreign exchange contracts as cash flow hedges. To ensure the adequacy and effectiveness of our foreign exchange hedge positions, we continually monitor our foreign exchange forward positions, both on a stand-alone basis and in conjunction with their underlying foreign currency exposures, from an accounting and economic perspective. However, given the inherent limitations of forecasting and the anticipatory nature of the exposures intended to be hedged, we cannot assure that such programs will offset more than a portion of the adverse financial impact resulting from unfavorable movements in foreign exchange rates. In addition, the timing of the accounting for recognition of gains and losses related to mark-to-market instruments for any given period may not coincide with the timing of gains and losses related to the underlying economic exposures and, therefore, may adversely affect our consolidated operating results and financial position.
We do not engage in hedging to manage foreign currency risk related to revenue and expenses denominated in RMB and HKD, nor do we currently use derivative instruments to reduce exposure to foreign currency risk for a majority of our loans due from our foreign subsidiaries. However, we may consider the use of derivatives in the
55
Table of Contents
future. In general, our Chinese customers pay us in RMB, which partially mitigates this foreign currency exchange risk. Additionally, loans due from our foreign subsidiaries are, in some cases, denominated in currencies other than the RMB, thus providing a natural economic hedge, partially mitigating our RMB foreign currency exposure.
The table below presents information about certain of the foreign currency forward contracts as of December 28, 2015 and December 29, 2014:
| As of December 28, 2015 | As of December 29, 2014 | |||||||||||||||
| Notional Amount |
Average Contract Rate or Strike Amount |
Notional Amount |
Average Contract Rate or Strike Amount |
|||||||||||||
| (In thousands in USD) |
(In thousands in USD) |
|||||||||||||||
| Receive foreign currency/pay USD |
||||||||||||||||
| Euro |
$ | 502 | 1.23 | $ | 1,233 | 1.35 | ||||||||||
| Japanese Yen |
1,112 | 0.01 | 27,909 | 0.01 | ||||||||||||
|
|
|
|
|
|||||||||||||
| $ | 1,614 | $ | 29,142 | |||||||||||||
|
|
|
|
|
|||||||||||||
| Estimated fair value, net liability |
$ | (35 | ) | $ | (5,062 | ) | ||||||||||
|
|
|
|
|
|||||||||||||
| ITEM 8. | FINANCIAL STATEMENTS AND SUPPLEMENTARY DATA |
Reference is made to our consolidated financial statements, the notes thereto, and the report thereon, commencing on page 66 of this report, which consolidated financial statements, notes and report are incorporated herein by reference.
We operate on a 52 or 53 week year ending on the Monday nearest December 31. Fiscal years 2015 and 2014 were 52 weeks and ended December 28, 2015 and December 29, 2014, respectively, and each quarter of both fiscal years 2015 and 2014 contained 91 days.
| First Quarter |
Second Quarter |
Third Quarter |
Fourth Quarter |
|||||||||||||
| (In thousands, except per share data) | ||||||||||||||||
| Year Ended December 28, 2015:(1) |
||||||||||||||||
| Net sales |
$ | 329,164 | $ | 445,445 | $ | 652,005 | $ | 668,874 | ||||||||
| Gross profit |
51,559 | 61,190 | 89,118 | 108,270 | ||||||||||||
| Income (loss) before income taxes |
2,085 | (19,959 | ) | 6,592 | 20,258 | |||||||||||
| Net income (loss) |
3,446 | (36,583 | ) | (2,138 | ) | 9,657 | ||||||||||
| Net income (loss) attributable to TTM Technologies, Inc. stockholders |
3,446 | (36,612 | ) | (2,237 | ) | 9,521 | ||||||||||
| Earnings (loss) per share attributable to TTM Technologies, Inc. stockholders: |
||||||||||||||||
| Basic |
$ | 0.04 | $ | (0.41 | ) | $ | (0.02 | ) | $ | 0.10 | ||||||
| Diluted(2) |
$ | 0.04 | $ | (0.41 | ) | $ | (0.02 | ) | $ | 0.09 | ||||||
| Year Ended December 29, 2014:(3) |
||||||||||||||||
| Net sales |
$ | 291,895 | $ | 297,635 | $ | 345,275 | $ | 390,912 | ||||||||
| Gross profit |
38,506 | 38,600 | 49,108 | 68,475 | ||||||||||||
| Income (loss) before income taxes |
(5,654 | ) | (2,596 | ) | 8,037 | 22,504 | ||||||||||
| Net income (loss) |
(3,799 | ) | (3,104 | ) | 7,658 | 13,938 | ||||||||||
| Net income (loss) attributable to TTM Technologies, Inc. stockholders |
(3,799 | ) | (3,104 | ) | 7,658 | 13,938 | ||||||||||
| Earnings (loss) per share attributable to TTM Technologies, Inc. stockholders: |
||||||||||||||||
| Basic |
$ | (0.05 | ) | $ | (0.04 | ) | $ | 0.09 | $ | 0.17 | ||||||
| Diluted |
$ | (0.05 | ) | $ | (0.04 | ) | $ | 0.09 | $ | 0.17 | ||||||
56
Table of Contents
| (1) | Includes a $2.5 million gain on sale of assets in first quarter, 211 days of activity of Viasystems which we acquired May 31, 2015, acquisition costs of $34.4 million with a substantial portion recognized in the second quarter, and restructuring charges of $7.4 during third and fourth quarters. |
| (2) | For the fourth quarter, the dilutive effect of stock options or other common stock equivalents is calculated using the treasury stock method, while the dilutive effect of convertible senior notes is calculated using the if-converted method. |
| (3) | Includes a $0.5 million loss on extinguishment of debt in the first quarter and a $1.8 long-lived asset impairment charge in the second quarter. |
| ITEM 9. | CHANGES IN AND DISAGREEMENTS WITH ACCOUNTANTS ON ACCOUNTING AND FINANCIAL DISCLOSURE |
Not applicable.
| ITEM 9A. | CONTROLS AND PROCEDURES |
Evaluation of Disclosure Controls and Procedures
Our management, under the supervision and with the participation of our Chief Executive Officer (CEO) and Chief Financial Officer (CFO), has evaluated the effectiveness of the design and operation of our disclosure controls and procedures (as defined in Exchange Act Rules 13a-15(e) and 15d-15(e)) as of the end of the period covered by this Report. Based on this evaluation, our CEO and CFO have concluded that, as of December 28, 2015, such disclosure controls and procedures were effective to provide reasonable assurance that information we are required to disclose in reports that we file or submit under the Exchange Act is (i) recorded, processed, summarized and reported within the time periods specified in the SECs rules and forms and (ii) accumulated and communicated to our management, including our CEO and CFO, as appropriate to allow timely decisions regarding required disclosures.
Managements Report on Internal Control over Financial Reporting
Our management is responsible for establishing and maintaining adequate internal control over financial reporting, (as defined in Exchange Act Rules 13a-15(f) and 15d-15(f)) to provide reasonable assurance regarding the reliability of our financial reporting and the preparation of financial statements for external purposes in accordance with generally accepted accounting principles (GAAP). Under the supervision of and with the participation of our CEO and CFO, management conducted an assessment of the effectiveness of our internal control over financial reporting as of December 28, 2015 based on the criteria established in Internal Control Integrated Framework (2013) issued by the Committee of Sponsoring Organizations of the Treadway Commission (COSO). Based on this assessment, management concluded that our internal control over financial reporting was effective as of December 28, 2015.
We acquired Viasystems Group, Inc. (Viasystems) on May 31, 2015. Management excluded from its evaluation of the effectiveness of our internal control over financial reporting as of December 28, 2015 the acquired entitys internal control over financial reporting associated with 32% of total assets and 32% of total net sales included in our consolidated financial statements as of and for the year ended December 28, 2015.
The effectiveness of our internal control over financial reporting as of December 28, 2015 has been audited by KPMG LLP, an independent registered public accounting firm, as stated in their report, which appears under the heading Report of Independent Registered Public Accounting Firm on page 68 of this Report.
Inherent Limitations on Effectiveness of Controls
A control system, no matter how well designed and operated, can provide only reasonable, not absolute, assurance that the control systems objectives will be met. The design of a control system must reflect the fact that there are resource constraints, and the benefits of controls must be considered relative to their costs. Further, because of the inherent limitations, internal control over financial reporting may not prevent or detect misstatements due to error or fraud. These inherent limitations include the realities that judgments in decision-
57
Table of Contents
making can be faulty and that breakdowns can occur because of simple error or mistake. Controls also can be circumvented by the individual acts of some persons, by collusion of two or more people, or by management override of the controls. The design of any system of controls is based in part on certain assumptions about the likelihood of future events, and there can be no assurance that any design will succeed in achieving its stated goals under all potential future conditions. Projections of any evaluation of controls effectiveness to future periods are subject to risks that controls may become inadequate because of changes in conditions, or that the degree of compliance with policies or procedures may deteriorate.
Changes in Internal Control over Financial Reporting
As a result of the acquisition of Viasystems on May 31, 2015, we began implementing internal controls over financial reporting to include consolidation of the acquired entity, as well as acquisition-related accounting and disclosures. The integration of Viasystems represents a material change in our internal control over financial reporting. Management continues to be engaged in substantial efforts to evaluate the effectiveness of our internal control procedures and the design of those control procedures relating to the acquisition of Viasystems with the plan to complete and report its evaluation of the Viasystems internal control over financial reporting by January 2, 2017.
There were no other changes in our internal control over financial reporting (as defined in Rules 13a-15(f) and 15d-15(f) under the Exchange Act) during the quarter ended December 28, 2015 that have materially affected, or are reasonably likely to materially affect, our internal control over financial reporting.
| ITEM 9B. | OTHER INFORMATION |
Not applicable.
PART III
| ITEM 10. | DIRECTORS, EXECUTIVE OFFICERS AND CORPORATE GOVERNANCE |
The information required by this Item is incorporated herein by reference to the definitive Proxy Statement to be filed pursuant to Regulation 14A of the Exchange Act for our 2016 Annual Meeting of Stockholders.
| ITEM 11. | EXECUTIVE COMPENSATION. |
The information required by this Item is incorporated herein by reference to the definitive Proxy Statement to be filed pursuant to Regulation 14A of the Exchange Act for our 2016 Annual Meeting of Stockholders.
| ITEM 12. | SECURITY OWNERSHIP OF CERTAIN BENEFICIAL OWNERS AND MANAGEMENT AND RELATED STOCKHOLDER MATTERS. |
The information required by this Item is incorporated herein by reference to the definitive Proxy Statement to be filed pursuant to Regulation 14A of the Exchange Act for our 2016 Annual Meeting of Stockholders.
| ITEM 13. | CERTAIN RELATIONSHIPS AND RELATED TRANSACTIONS, AND DIRECTOR INDEPENDENCE. |
The information required by this Item is incorporated herein by reference to the definitive Proxy Statement to be filed pursuant to Regulation 14A of the Exchange Act for our 2016 Annual Meeting of Stockholders.
| ITEM 14. | PRINCIPAL ACCOUNTING FEES AND SERVICES. |
The information required by this Item is incorporated herein by reference to the definitive Proxy Statement to be filed pursuant to Regulation 14A of the Exchange Act for our 2016 Annual Meeting of Stockholders.
58
Table of Contents
PART IV
| ITEM 15. | EXHIBITS, FINANCIAL STATEMENT SCHEDULES |
| (a) | Financial Statements |
| Financial Statements are listed in the Index to Consolidated Financial Statements on page 66 of this Report. |
| (b) | Exhibits |
| Exhibit Number |
Exhibits |
|
| 2.1 | English translation of Equity Interest Transfer Agreement in relation to Dongguan Meadville Circuits Limited, dated March 13, 2013, by and between Shengyi Technology Co., Ltd. and the Registrant(1) | |
| 2.2** | English translation of Equity Interest Transfer Agreement in relation to Dongguan Shengyi Electronics Ltd., dated March 13, 2013, by and between Shengyi Technology Co., Ltd. and the Registrant(1) | |
| 2.3** | Agreement and Plan of Merger, by and among the Registrant, Viasystems Group, Inc. and Vector Acquisition Corp., dated September 21, 2014(2) | |
| 3.1 | Registrants Certificate of Incorporation, as amended June 3, 2011(3) | |
| 3.2 | Registrants Fourth Amended and Restated Bylaws(4) | |
| 4.1 | Indenture, dated as of May 14, 2008, between the Registrant and American Stock Transfer & Trust Company(5) | |
| 4.2 | First Supplemental Indenture, dated as of May 14, 2008, between the Registrant and American Stock Transfer & Trust Company(5) | |
| 4.3 | Form of Registrants common stock certificate(6) | |
| 4.4 | Sell-Down Registration Rights Agreement, dated December 23, 2009, by and among Meadville Holdings Limited, MTG Investment (BVI) Limited, and the Registrant(7) | |
| 4.5 | Registration Rights Agreement, dated as of April 9, 2010, by and among Tang Hsiang Chien, Su Sih (BVI) Limited, and the Registrant(8) | |
| 4.6 | Shareholders Agreement, dated as of April 9, 2010, by and among Meadville Holdings Limited; Su Sih (BVI) Limited; Tang Hsiang Chien; Tang Chung Yen, Tom; Tang Ying Ming, Mai; and the Registrant(8) | |
| 4.7 | First Amendment to Shareholders Agreement, dated September 14, 2012, by and among Tang Hsiang Chien; Su Sih (BVI) Limited; Tang Chung Yen, Tom; Tang Ying Ming, Mai; and the Registrant(9) | |
| 4.8 | Indenture, dated as of December 20, 2013, between the Registrant and American Stock Transfer & Trust Company, LLC(10) | |
| 4.9 | Registration Rights Agreement Memorandum of Understanding, by and among the Registrant, Hicks, Muse, Tate & Furst Equity Fund III, L.P., HM3 Coinvestors, L.P., HMTF Equity Fund IV (1999), L.P., HMTF Private Equity Fund IV (1999), L.P., Hicks, Muse PG-IV (1999), C.V., HM 4-P (1999) Coinvestors, L.P., HM 4-EQ (1999) Coinvestors, L.P., GSC Recovery II, L.P., and GSC Recovery IIA, L.P., dated September 21, 2014(2) | |
| 4.10 | Addendum to Registration Rights Agreement, by and among the Registrant, Su Sih (BVI) Limited, and Tang Hsiang Chien, dated September 21, 2014(2) | |
59
Table of Contents
| Exhibit Number |
Exhibits |
|
| 4.11 | Registration Rights Agreement, by and among TTM Technologies, Inc., Hicks, Muse, Tate & Furst Equity Fund III, L.P., HM3 Coinvestors, L.P., HMTF Equity Fund IV (1999), L.P., HMTF Private Equity Fund IV (1999), L.P., Hicks, Muse PG-IV (1999), C.V., HM 4-P (1999) Coinvestors, L.P., and HM 4-EQ (1999) Coinvestors, L.P. and GSC Recovery II, L.P. and GSC Recovery IIA, L.P., dated as of May 31, 2015(28) | |
| 4.12 | The First Amendment to the Registration Rights Agreement, originally dated as of April 9, 2010, by and among Meadville Holdings Limited, MTG Investment (BVI) Limited, and TTM Technologies, Inc.(30) | |
| 4.13 | The Second Amendment to the Shareholders Agreement, originally dated as of April 9, 2010, by and among Meadville Holdings Limited; Su Sih (BVI) Limited; Tang Hsiang Chien; Tang Chung Yen, Tom; Tang Ying Ming, Mai; and TTM Technologies, Inc.(30) | |
| 10.1 | Call Option Transaction Confirmation, dated as of May 8, 2008, between the Registrant and JPMorgan Chase Bank, National Association(5) | |
| 10.2 | Warrant Transaction Confirmation, dated as of May 8, 2008, between the Registrant and JPMorgan Chase Bank, National Association(5) | |
| 10.3 | Call Option Transaction Confirmation, dated as of May 8, 2008, between the Registrant and UBS AG(5) | |
| 10.4 | Warrant Transaction Confirmation, dated as of May 8, 2008, between the Registrant and UBS AG(5) | |
| 10.5 | Call Option Transaction Confirmation, dated as of May 16, 2008, between the Registrant and JPMorgan Chase Bank, National Association(11) | |
| 10.6 | Warrant Transaction Confirmation, dated as of May 16, 2008, between the Registrant and JPMorgan Chase Bank, National Association(11) | |
| 10.7 | Call Option Transaction Confirmation, dated as of May 16, 2008, between the Registrant and UBS AG(11) | |
| 10.8 | Warrant Transaction Confirmation, dated as of May 16, 2008, between the Registrant and UBS AG(11) | |
| 10.9 | 2006 Incentive Compensation Plan(12) | |
| 10.10 | Form of Stock Option Agreement pursuant to 2006 Incentive Compensation Plan(12) | |
| 10.11 | Form of Restricted Stock Unit Award Grant Notice pursuant to 2006 Incentive Compensation Plan(12) | |
| 10.12 | Form of Performance-Based RSU Grant Notice and Award Agreement pursuant to 2006 Incentive Compensation Plan and schedule of signatories(13) | |
| 10.13 | TTM Technologies, Inc. 2014 Incentive Compensation Plan(14) | |
| 10.14 | TTM Technologies, Inc. Form of Restricted Stock Unit Award Grant Notice pursuant to TTM Technologies, Inc. 2014 Incentive Compensation Plan(14) | |
| 10.15 | Form of Director and Officer Indemnification Agreement, dated December 10, 2014(15) | |
| 10.16 | Stock Purchase Agreement, dated November 16, 2009, by and among Meadville Holdings Limited, MTG Investment (BVI) Limited, the Registrant, TTM Technologies International, Inc., and TTM Hong Kong Limited (now known as TTM Technologies (Asia Pacific) Limited)(16) | |
60
Table of Contents
| Exhibit Number |
Exhibits |
|
| 10.17 | Form of Executive Change in Control Severance Agreement and schedule of agreements(17) | |
| 10.18 | Credit Agreement, dated November 16, 2009, as amended and restated on March 30, 2010 and as further amended on August 3, 2010 and July 22, 2011, respectively, by and among certain PCB Subsidiaries, the Registrant, the Lenders, and the other parties named therein(18) | |
| 10.19 | Waiver and Amendment Letter with The Hongkong and Shanghai Banking Corporation Limited, dated August 3, 2010(19) | |
| 10.20 | Special Security Agreement by and among Tang Hsiang Chien, Su Sih (BVI) Limited, the Registrant and the United States Department of Defense, dated October 19, 2010(20) | |
| 10.21 | Amendment Letter with The Hongkong and Shanghai Banking Corporation Limited, dated July 22, 2011(21) | |
| 10.22 | Executive and Director Deferred Compensation Plan(22) | |
| 10.23 | Facility Agreement, dated September 14, 2012, by and among the PCB Subsidiaries, the lenders, and the other parties named therein(9) | |
| 10.24 | Equity Awards Amendment Agreement, dated April 24, 2013 by and between the Registrant and Kent Alder(23) | |
| 10.25 | Call Option Transaction Confirmation, dated as of December 16, 2013, between the Registrant and JPMorgan Chase Bank, National Association, London Branch(10) | |
| 10.26 | Warrant Transaction Confirmation, dated as of December 16, 2013, between the Registrant and JPMorgan Chase Bank, National Association, London Branch(10) | |
| 10.27 | Call Option Transaction Confirmation, dated as of December 16, 2013, between the Registrant and RBC Capital Markets, LLC(10) | |
| 10.28 | Warrant Transaction Confirmation, dated as of December 16, 2013, between the Registrant and RBC Capital Markets, LLC(10) | |
| 10.29 | Call Option Transaction Confirmation, dated as of December 16, 2013, between the Registrant and Deutsche Bank AG, London Branch(10) | |
| 10.30 | Warrant Transaction Confirmation, dated as of December 16, 2013, between the Registrant and Deutsche Bank AG, London Branch(10) | |
| 10.31 | Call Option Transaction Confirmation, dated as of January 9, 2014, between the Registrant and JPMorgan Chase Bank, National Association, London Branch(24) | |
| 10.32 | Warrant Transaction Confirmation, dated as of January 9, 2014, between the Registrant and JPMorgan Chase Bank, National Association, London Branch(24) | |
| 10.33 | Call Option Transaction Confirmation, dated as of January 9, 2014, between the Registrant and RBC Capital Markets, LLC(24) | |
| 10.34 | Warrant Transaction Confirmation, dated as of January 9, 2014, between the Registrant and RBC Capital Markets, LLC(24) | |
| 10.35 | Call Option Transaction Confirmation, dated as of January 9, 2014, between the Registrant and Deutsche Bank AG, London Branch(24) | |
| 10.36 | Warrant Transaction Confirmation, dated as of January 9, 2014, between the Registrant and Deutsche Bank AG, London Branch(24) | |
61
Table of Contents
| Exhibit Number |
Exhibits |
|
| 10.37 | Voting Agreement, by and among the Company, Hicks, Muse, Tate & Furst Equity Fund III, L.P., HM3 Coinvestors, L.P., HMTF Equity Fund IV (1999), L.P., HMTF Private Equity Fund IV (1999), L.P., Hicks, Muse PG-IV (1999), C.V., HM 4-P (1999) Coinvestors, L.P., and HM 4-EQ (1999) Coinvestors, L.P., dated September 21, 2014(2) | |
| 10.38 | Voting Agreement, by and among the Company, GSC Recovery II, L.P., and GSC Recovery IIA, L.P., dated September 21, 2014(2) | |
| 10.39 | Commitment Letter, by and among the Company, JPMorgan Chase Bank, N.A., J.P. Morgan Securities LLC and Barclays Bank PLC, dated September 21, 2014(2) | |
| 10.40 | Amended and Restated Commitment Letter, by and among the Registrant, JPMorgan Chase Bank, N.A., J.P. Morgan Securities LLC, Barclays Bank PLC, and The Royal Bank of Scotland plc, dated October 23, 2014(25) | |
| 10.41 | TTM Technologies, Inc. Form of Restricted Stock Unit Award Grant Notice (for U.S. taxpayers) pursuant to TTM Technologies, Inc. 2014 Incentive Compensation Plan(26) | |
| 10.41 | TTM Technologies, Inc. Form of Restricted Stock Unit Award Grant Notice (for non-U.S. taxpayers) pursuant to TTM Technologies, Inc. 2014 Incentive Compensation Plan(26) | |
| 10.43 | TTM Technologies, Inc. Form of Performance-Based RSU Grant Notice and Award Agreement pursuant to TTM Technologies, Inc. 2014 Incentive Compensation Plan(26) | |
| 10.44 | Form of Executive Change in Control Severance Agreement and schedule of agreements(26) | |
| 10.45 | Facility Agreement, dated May 22, 2015, by and among TTM Technologies Enterprises (HK) Limited, The Hongkong and Shanghai Banking Corporation Limited, and the other parties named therein(27) | |
| 10.46 | Term Loan Credit Agreement, by and among TTM Technologies, Inc., as Borrower, the several Lenders from time to time parties thereto, JPMorgan Chase Bank, N.A., as Administrative Agent, Barclays Bank PLC, as Syndication Agent, and The Royal Bank of Scotland plc and HCBS Securities (USA) Inc., as Documentation Agents, dated as of May 31, 2015(28) | |
| 10.47 | ABL Credit Agreement, by and among TTM Technologies, Inc., as Borrower, the several Lenders from time to time parties thereto, JPMorgan Chase Bank, N.A., as Administrative Agent, Barclays Bank PLC, as Syndication Agent, and The Royal Bank of Scotland plc and HCBS Securities (USA) Inc., as Documentation Agents, dated as of May 31, 2015(28) | |
| 10.48 | TTM Technologies, Inc. Form of Restricted Stock Unit Award Grant Notice (for non-employee directors) pursuant to TTM Technologies, Inc. 2014 Incentive Compensation Plan(29) | |
| 12.1* | Statement of Computation of Ratio of Earnings to Fixed Charges | |
| 21.1* | Subsidiaries of the Registrant | |
| 23.1* | Consent of PricewaterhouseCoopers LLP, independent registered public accounting firm | |
| 23.2* | Consent of KPMG LLP, independent registered public accounting firm | |
| 31.1* | Certification of Chief Executive Officer | |
| 31.2* | Certification of Chief Financial Officer | |
| 32.1* | Certification of Chief Executive Officer | |
| 32.2* | Certification of Chief Financial Officer | |
62
Table of Contents
| Exhibit Number |
Exhibits |
|
| 101.INS* | XBRL Instance Document | |
| 101.SCH* | XBRL Taxonomy Extension Schema Document | |
| 101.CAL* | XBRL Taxonomy Extension Calculation Linkbase Document | |
| 101.DEF* | XBRL Taxonomy Extension Definition Linkbase Document | |
| 101.LAB* | XBRL Taxonomy Extension Label Linkbase Document | |
| 101.PRE* | XBRL Taxonomy Extension Presentation Linkbase Document | |
| (1) | Incorporated by reference to the Registrants Form 10-Q as filed with the Securities and Exchange Commission (the Commission) on May 7, 2013. |
| (2) | Incorporated by reference to the Registrants Form 8-K as filed with the Commission on September 22, 2014. |
| (3) | Incorporated by reference to the Registrants Form 8-K as filed with the Commission on June 6, 2011. |
| (4) | Incorporated by reference to the Registrants Form 8-K as filed with the Commission on March 2, 2011. |
| (5) | Incorporated by reference to the Registrants Form 8-K as filed with the Commission on May 14, 2008. |
| (6) | Incorporated by reference to the Registrants Form 8-K as filed with the Commission on August 30, 2005. |
| (7) | Incorporated by reference to the Registrants Form 8-K as filed with the Commission on December 23, 2009. |
| (8) | Incorporated by reference to the Registrants Form 8-K as filed with the Commission on April 13, 2010. |
| (9) | Incorporated by reference to the Registrants Form 8-K as filed with the Commission on September 19, 2012. |
| (10) | Incorporated by reference to the Registrants Form 8-K as filed with the Commission on December 20, 2013. |
| (11) | Incorporated by reference to the Registrants Form 8-K as filed with the Commission on May 22, 2008. |
| (12) | Incorporated by reference to the Registrants Form 10-K as filed with the Commission on March 16, 2007. |
| (13) | Incorporated by reference to the Registrants Form 8-K as filed with the Commission on March 30, 2010. |
| (14) | Incorporated by reference to the Registrants Form S-8 as filed with the Commission on August 13, 2014. |
| (15) | Incorporated by reference to the Registrants Form 8-K as filed with the Commission on December 15, 2014. |
| (16) | Incorporated by reference to the Registrants Form 8-K as filed with the Commission on November 16, 2009. |
| (17) | Incorporated by reference to the Registrants Form 8-K as filed with the Commission on August 5, 2014. |
| (18) | Incorporated by reference to the Registrants Form 8-K/A as filed with the Commission on August 5, 2010. |
| (19) | Incorporated by reference to the Registrants Form 8-K as filed with the Commission on August 5, 2010. |
| (20) | Incorporated by reference to the Registrants Form 8-K as filed with the Commission on October 22, 2010. |
| (21) | Incorporated by reference to the Registrants Form 8-K as filed with the Commission on July 27, 2011. |
| (22) | Incorporated by reference to the Registrants Form 8-K as filed with the Commission on September 19, 2011. |
| (23) | Incorporated by reference to the Registrants Form 10-Q as filed with the Commission on August 6, 2013. |
| (24) | Incorporated by reference to the Registrants Form 8-K as filed with the Commission on January 14, 2014. |
| (25) | Incorporated by reference to the Registrants Form 8-K as filed with the Commission on October 27, 2014. |
| (26) | Incorporated by reference to the Registrants Form 10-Q as filed with the Commission on May 5, 2015. |
| (27) | Incorporated by reference to the Registrants Form 8-K as filed with the Commission on May 29, 2015. |
| (28) | Incorporated by reference to the Registrants Form 8-K as filed with the Commission on June 2, 2015. |
63
Table of Contents
| (29) | Incorporated by reference to the Registrants Form 10-Q as filed with the Commission on August 10, 2015. |
| (30) | Incorporated by reference to the Registrants Form 8-K as filed with the Commission on January 4, 2016. |
| | Management contract or Compensation Plan |
| * | Filed herewith |
| ** | The appendices to this exhibit have been omitted in reliance on Item 601(b)(2) of Regulation S-K and will be furnished supplementally to the SEC upon request. |
| (c) | Financial Statement Schedules. |
| None. |
64
Table of Contents
Pursuant to the requirements of Section 13 or 15(d) of the Securities Exchange Act of 1934, the registrant has duly caused this Report to be signed on its behalf by the undersigned, thereunto duly authorized.
| TTM TECHNOLOGIES, INC. | ||
| By: | /s/ Thomas T. Edman |
|
| Thomas T. Edman President and Chief Executive Officer |
||
Date: February 24, 2016
Pursuant to the requirements of the Securities Exchange Act of 1934, this Report has been signed below by the following persons on behalf of the registrant and in the capacities and on the dates indicated.
| Name |
Title |
Date |
||
| /s/ Thomas T. Edman Thomas T. Edman |
President, Chief Executive Officer and Director (Principal Executive Officer) | February 24, 2016 | ||
| /s/ Todd B. Schull Todd B. Schull |
Executive Vice President, Chief Financial Officer and Treasurer (Principal Financial Officer and Principal Accounting Officer) | February 24, 2016 | ||
| /s/ Robert E. Klatell Robert E. Klatell |
Chairman of the Board | February 24, 2016 | ||
| /s/ Kenton K. Alder Kenton K. Alder |
Director | February 24, 2016 | ||
| /s/ Philip G. Franklin Philip G. Franklin |
Director | February 24, 2016 | ||
| /s/ Ronald W. Iverson Ronald W. Iverson |
Director | February 24, 2016 | ||
| /s/ John G. Mayer John G. Mayer |
Director | February 24, 2016 | ||
| /s/ Tang Chung Yen, Tom Tang Chung Yen, Tom |
Director | February 24, 2016 | ||
| /s/ Dov S. Zakheim Dov S. Zakheim |
Director | February 24, 2016 | ||
65
Table of Contents
TTM TECHNOLOGIES, INC.
Index to Consolidated Financial Statements
| 67 | ||||
| Consolidated Balance Sheets as of December 28, 2015 and December 29, 2014 |
70 | |||
| 71 | ||||
| 72 | ||||
| 73 | ||||
| 74 | ||||
| 75 |
66
Table of Contents
Report of Independent Registered Public Accounting Firm
The Board of Directors and Stockholders
TTM Technologies, Inc.:
We have audited the accompanying consolidated balance sheets of TTM Technologies, Inc. and subsidiaries as of December 28, 2015 and December 29, 2014, and the related consolidated statements of operations, comprehensive income (loss), stockholders equity, and cash flows for the years then ended. These consolidated financial statements are the responsibility of the Companys management. Our responsibility is to express an opinion on these consolidated financial statements based on our audits.
We conducted our audits in accordance with the standards of the Public Company Accounting Oversight Board (United States). Those standards require that we plan and perform the audit to obtain reasonable assurance about whether the financial statements are free of material misstatement. An audit includes examining, on a test basis, evidence supporting the amounts and disclosures in the financial statements. An audit also includes assessing the accounting principles used and significant estimates made by management, as well as evaluating the overall financial statement presentation. We believe that our audits provide a reasonable basis for our opinion.
In our opinion, the consolidated financial statements referred to above present fairly, in all material respects, the financial position of TTM Technologies, Inc. and subsidiaries as of December 28, 2015 and December 29, 2014, and the results of their operations and their cash flows for the years then ended, in conformity with U.S. generally accepted accounting principles.
We also have audited the adjustments to the 2013 consolidated financial statements to retrospectively adjust the disclosures for a change in the composition of reportable segments as described in Note 19. In our opinion, such adjustments are appropriate and have been properly applied. We were not engaged to audit, review, or apply any procedures to the 2013 consolidated financial statements of the Company other than with respect to the restated segment information and, accordingly, we do not express an opinion or any other form of assurance on the 2013 consolidated financial statements taken as a whole.
We also have audited, in accordance with the standards of the Public Company Accounting Oversight Board (United States), TTM Technologies, Inc.s internal control over financial reporting as of December 28, 2015, based on criteria established in Internal Control Integrated Framework (2013) issued by the Committee of Sponsoring Organizations of the Treadway Commission (COSO), and our report dated February 24, 2016, expressed an unqualified opinion on the effectiveness of the Companys internal control over financial reporting.
/s/ KPMG LLP
Irvine, California
February 24, 2016
67
Table of Contents
Report of Independent Registered Public Accounting Firm
The Board of Directors and Stockholders
TTM Technologies, Inc.:
We have audited TTM Technologies, Inc.s internal control over financial reporting as of December 28, 2015, based on criteria established in Internal Control Integrated Framework (2013) issued by the Committee of Sponsoring Organizations of the Treadway Commission (COSO). TTM Technologies, Inc.s management is responsible for maintaining effective internal control over financial reporting and for its assessment of the effectiveness of internal control over financial reporting, included in the accompanying Managements Report on Internal Control over Financial Reporting appearing under Item 9A. Our responsibility is to express an opinion on TTM Technologies, Inc.s internal control over financial reporting based on our audit.
We conducted our audit in accordance with the standards of the Public Company Accounting Oversight Board (United States). Those standards require that we plan and perform the audit to obtain reasonable assurance about whether effective internal control over financial reporting was maintained in all material respects. Our audit included obtaining an understanding of internal control over financial reporting, assessing the risk that a material weakness exists, and testing and evaluating the design and operating effectiveness of internal control based on the assessed risk. Our audit also included performing such other procedures as we considered necessary in the circumstances. We believe that our audit provides a reasonable basis for our opinion.
A companys internal control over financial reporting is a process designed to provide reasonable assurance regarding the reliability of financial reporting and the preparation of financial statements for external purposes in accordance with generally accepted accounting principles. A companys internal control over financial reporting includes those policies and procedures that (1) pertain to the maintenance of records that, in reasonable detail, accurately and fairly reflect the transactions and dispositions of the assets of the company; (2) provide reasonable assurance that transactions are recorded as necessary to permit preparation of financial statements in accordance with generally accepted accounting principles, and that receipts and expenditures of the company are being made only in accordance with authorizations of management and directors of the company; and (3) provide reasonable assurance regarding prevention or timely detection of unauthorized acquisition, use, or disposition of the companys assets that could have a material effect on the financial statements.
Because of its inherent limitations, internal control over financial reporting may not prevent or detect misstatements. Also, projections of any evaluation of effectiveness to future periods are subject to the risk that controls may become inadequate because of changes in conditions, or that the degree of compliance with the policies or procedures may deteriorate.
In our opinion, TTM Technologies, Inc. maintained, in all material respects, effective internal control over financial reporting as of December 28, 2015, based on criteria established in Internal Control Integrated Framework (2013) issued by COSO.
TTM Technologies, Inc. acquired Viasystems Group, Inc. during 2015, and management excluded from its assessment of the effectiveness of TTM Technologies, Inc.s internal control over financial reporting as of December 28, 2015, Viasystems Group, Inc.s internal control over financial reporting associated with 32% of total assets and 32% of total net sales included in the consolidated financial statements of TTM Technologies, Inc. and subsidiaries as of and for the year ended December 28, 2015. Our audit of internal control over financial reporting of TTM Technologies, Inc. also excluded an evaluation of the internal control over financial reporting of Viasystems Group, Inc.
We also have audited, in accordance with the standards of the Public Company Accounting Oversight Board (United States), the consolidated balance sheets of TTM Technologies, Inc. and subsidiaries as of December 28, 2015 and December 29, 2014, and the related consolidated statements of operations, comprehensive income (loss), stockholders equity, and cash flows for the years then ended, and our report dated February 24, 2016, expressed an unqualified opinion on those consolidated financial statements.
/s/ KPMG LLP
Irvine, California
February 24, 2016
68
Table of Contents
Report of Independent Registered Public Accounting Firm
To the Board of Directors and Stockholders of TTM Technologies, Inc.:
In our opinion, the consolidated statements of operations, comprehensive income (loss), stockholders equity, and cash flows for the year ended December 30, 2013, before the effects of the adjustments to retrospectively reflect the change in the composition of reportable segments described in Note 19, present fairly, in all material respects, the results of operations and cash flows of TTM Technologies, Inc. and its subsidiaries for the year ended December 30, 2013, in conformity with accounting principles generally accepted in the United States of America (the 2013 financial statements before the effects of the adjustments discussed in Note 19 are not presented herein). These financial statements are the responsibility of the Companys management. Our responsibility is to express an opinion on these financial statements based on our audit. We conducted our audit, before the effects of the adjustments described above, of these statements in accordance with the standards of the Public Company Accounting Oversight Board (United States). Those standards require that we plan and perform the audit to obtain reasonable assurance about whether the financial statements are free of material misstatement. An audit includes examining, on a test basis, evidence supporting the amounts and disclosures in the financial statements, assessing the accounting principles used and significant estimates made by management, and evaluating the overall financial statement presentation. We believe that our audit provides a reasonable basis for our opinion.
We were not engaged to audit, review, or apply any procedures to the adjustments to retrospectively reflect the change in the composition of reportable segments described in Note 19 and, accordingly, we do not express an opinion or any other form of assurance about whether such adjustments are appropriate and have been properly applied. Those adjustments were audited by other auditors.
/s/ PricewaterhouseCoopers LLP
Irvine, California
February 21, 2014
69
Table of Contents
Consolidated Balance Sheets
| As of | ||||||||
| December 28, 2015 |
December 29, 2014 |
|||||||
| (In thousands, except par value) | ||||||||
| ASSETS |
||||||||
| Current assets: |
||||||||
| Cash and cash equivalents |
$ | 259,100 | $ | 279,042 | ||||
| Restricted cash |
3,530 | | ||||||
| Accounts receivable, net |
456,000 | 312,867 | ||||||
| Inventories |
268,923 | 145,187 | ||||||
| Prepaid expenses and other current assets |
34,967 | 61,027 | ||||||
|
|
|
|
|
|||||
| Total current assets |
1,022,520 | 798,123 | ||||||
| Property, plant and equipment, net |
1,103,067 | 754,718 | ||||||
| Goodwill |
346,990 | 12,111 | ||||||
| Definite-lived intangibles, net |
150,874 | 19,250 | ||||||
| Deposits and other non-current assets |
47,853 | 17,087 | ||||||
|
|
|
|
|
|||||
| $ | 2,671,304 | $ | 1,601,289 | |||||
|
|
|
|
|
|||||
| LIABILITIES AND EQUITY |
||||||||
| Current liabilities: |
||||||||
| Short-term debt, including current portion of long-term debt, net of discount |
$ | 157,375 | $ | 128,045 | ||||
| Accounts payable |
377,222 | 235,276 | ||||||
| Accrued salaries, wages and benefits |
108,649 | 43,497 | ||||||
| Other accrued liabilities |
101,748 | 89,194 | ||||||
|
|
|
|
|
|||||
| Total current liabilities |
744,994 | 496,012 | ||||||
|
|
|
|
|
|||||
| Long-term debt, net of discount |
1,044,582 | 374,642 | ||||||
| Other long-term liabilities |
55,059 | 15,171 | ||||||
|
|
|
|
|
|||||
| Total long-term liabilities |
1,099,641 | 389,813 | ||||||
|
|
|
|
|
|||||
| Commitments and contingencies (Note 14) |
||||||||
| Equity: |
||||||||
| Common stock, $0.001 par value; 200,000 shares authorized, 99,137 and 83,345 shares issued and outstanding in 2015 and 2014, respectively |
99 | 83 | ||||||
| Additional paid-in capital |
745,608 | 586,709 | ||||||
| Retained earnings |
45,963 | 76,421 | ||||||
| Statutory surplus reserve |
25,812 | 21,236 | ||||||
| Accumulated other comprehensive income |
1,623 | 31,015 | ||||||
|
|
|
|
|
|||||
| Total TTM Technologies, Inc. stockholders equity |
819,105 | 715,464 | ||||||
| Noncontrolling interest |
7,564 | | ||||||
|
|
|
|
|
|||||
| Total equity |
826,669 | 715,464 | ||||||
|
|
|
|
|
|||||
| $ | 2,671,304 | $ | 1,601,289 | |||||
|
|
|
|
|
|||||
See accompanying notes to consolidated financial statements.
70
Table of Contents
Consolidated Statements of Operations
| Year Ended | ||||||||||||
| December 28, 2015 |
December 29, 2014 |
December 30, 2013 |
||||||||||
| (In thousands, except per share amounts) | ||||||||||||
| Net sales |
$ | 2,095,488 | $ | 1,325,717 | $ | 1,368,215 | ||||||
| Cost of goods sold |
1,785,351 | 1,131,028 | 1,150,372 | |||||||||
|
|
|
|
|
|
|
|||||||
| Gross profit |
310,137 | 194,689 | 217,843 | |||||||||
|
|
|
|
|
|
|
|||||||
| Operating expenses: |
||||||||||||
| Selling and marketing |
57,361 | 36,919 | 37,149 | |||||||||
| General and administrative |
167,669 | 100,999 | 105,924 | |||||||||
| Amortization of definite-lived intangibles |
18,888 | 8,387 | 9,332 | |||||||||
| Gain on sale of assets |
(2,504 | ) | | (17,917 | ) | |||||||
| Restructuring charges |
7,381 | | 3,445 | |||||||||
| Impairment of long-lived assets |
| 1,845 | 10,782 | |||||||||
|
|
|
|
|
|
|
|||||||
| Total operating expenses |
248,795 | 148,150 | 148,715 | |||||||||
|
|
|
|
|
|
|
|||||||
| Operating income |
61,342 | 46,539 | 69,128 | |||||||||
|
|
|
|
|
|
|
|||||||
| Other income (expense): |
||||||||||||
| Interest expense |
(59,753 | ) | (23,830 | ) | (24,031 | ) | ||||||
| Loss on extinguishment of debt |
(802 | ) | (506 | ) | (10,743 | ) | ||||||
| Other, net |
8,189 | 88 | 5,418 | |||||||||
|
|
|
|
|
|
|
|||||||
| Total other expense, net |
(52,366 | ) | (24,248 | ) | (29,356 | ) | ||||||
|
|
|
|
|
|
|
|||||||
| Income before income taxes |
8,976 | 22,291 | 39,772 | |||||||||
| Income tax provision |
(34,594 | ) | (7,598 | ) | (15,879 | ) | ||||||
|
|
|
|
|
|
|
|||||||
| Net (loss) income |
(25,618 | ) | 14,693 | 23,893 | ||||||||
| Less: Net income attributable to the non-controlling interest |
(264 | ) | | (2,016 | ) | |||||||
|
|
|
|
|
|
|
|||||||
| Net (loss) income attributable to TTM Technologies, Inc. stockholders |
$ | (25,882 | ) | $ | 14,693 | $ | 21,877 | |||||
|
|
|
|
|
|
|
|||||||
| (Loss) earnings per share attributable to TTM Technologies, Inc. stockholders: |
||||||||||||
| Basic (loss) earnings per share |
$ | (0.28 | ) | $ | 0.18 | $ | 0.27 | |||||
|
|
|
|
|
|
|
|||||||
| Diluted (loss) earnings per share |
$ | (0.28 | ) | $ | 0.18 | $ | 0.26 | |||||
|
|
|
|
|
|
|
|||||||
| Weighted-average shares used in computing per share amounts: |
||||||||||||
| Basic |
92,675 | 83,238 | 82,506 | |||||||||
|
|
|
|
|
|
|
|||||||
| Diluted |
92,675 | 83,941 | 83,132 | |||||||||
|
|
|
|
|
|
|
|||||||
See accompanying notes to consolidated financial statements.
71
Table of Contents
Consolidated Statements of Comprehensive Income (Loss)
| For the Year Ended | ||||||||||||
| December 28, 2015 |
December 29, 2014 |
December 30, 2013 |
||||||||||
| (In thousands) | ||||||||||||
| Net (loss) income |
$ | (25,618 | ) | $ | 14,693 | $ | 23,893 | |||||
| Other comprehensive (loss) income, net of tax: |
||||||||||||
| Foreign currency translation adjustments: |
||||||||||||
| Unrealized (loss) gain during the year, net |
(27,758 | ) | (14,841 | ) | 16,172 | |||||||
| Gain realized in the statement of operations |
(1,786 | ) | | (14,266 | ) | |||||||
|
|
|
|
|
|
|
|||||||
| Net |
(29,544 | ) | (14,841 | ) | 1,906 | |||||||
|
|
|
|
|
|
|
|||||||
| Net unrealized gains (losses) on cash flow hedges: |
||||||||||||
| Unrealized gain (loss) on effective cash flow hedges during the year, net |
(20 | ) | 43 | (1,726 | ) | |||||||
| Loss realized in the statement of operations |
172 | 146 | 128 | |||||||||
|
|
|
|
|
|
|
|||||||
| Net |
152 | 189 | (1,598 | ) | ||||||||
|
|
|
|
|
|
|
|||||||
| Net unrealized gains (losses) on available for sale securities: |
||||||||||||
| Unrealized loss on available for sale securities during the year |
| (20 | ) | (105 | ) | |||||||
| Loss realized in the statement of operations |
| 83 | 53 | |||||||||
|
|
|
|
|
|
|
|||||||
| Net |
| 63 | (52 | ) | ||||||||
|
|
|
|
|
|
|
|||||||
| Other comprehensive (loss) income, net of tax |
(29,392 | ) | (14,589 | ) | 256 | |||||||
|
|
|
|
|
|
|
|||||||
| Comprehensive (loss) income, net of tax |
(55,010 | ) | 104 | 24,149 | ||||||||
|
|
|
|
|
|
|
|||||||
| Less: Comprehensive (income) loss attributable to the non-controlling interest |
(264 | ) | | (3,417 | ) | |||||||
|
|
|
|
|
|
|
|||||||
| Comprehensive (loss) income attributable to TTM Technologies, Inc. stockholders |
$ | (55,274 | ) | $ | 104 | $ | 20,732 | |||||
|
|
|
|
|
|
|
|||||||
See accompanying notes to consolidated financial statements.
72
Table of Contents
Consolidated Statements of Stockholders Equity
| Additional Paid-In Capital |
Retained Earnings |
Statutory Surplus Reserve |
Accumulated Other Comprehensive Income (Loss) |
Total TTM Technologies, Inc Stockholders Equity |
Non-controlling Interest |
Total Equity |
||||||||||||||||||||||||||||||
| Common Stock | ||||||||||||||||||||||||||||||||||||
| Shares | Amount | |||||||||||||||||||||||||||||||||||
| (In thousands) | ||||||||||||||||||||||||||||||||||||
| Balance, December 31, 2012 |
81,937 | $ | 82 | $ | 546,029 | $ | 45,921 | $ | 15,166 | $ | 46,749 | $ | 653,947 | $ | 98,883 | $ | 752,830 | |||||||||||||||||||
| Net income |
| | | 21,877 | | | 21,877 | 2,016 | 23,893 | |||||||||||||||||||||||||||
| Other comprehensive loss |
| | | | | (1,145 | ) | (1,145 | ) | 1,401 | 256 | |||||||||||||||||||||||||
| Transfer to statutory surplus reserve |
| | | (3,526 | ) | 3,526 | | | | | ||||||||||||||||||||||||||
| Sale of controlling equity interest |
| | | | | | | (73,013 | ) | (73,013 | ) | |||||||||||||||||||||||||
| Purchase of non-controlling equity interest |
| | (71 | ) | | | | (71 | ) | (29,287 | ) | (29,358 | ) | |||||||||||||||||||||||
| Issuance and repurchase of convertible senior notes |
| | 30,310 | | | | 30,310 | | 30,310 | |||||||||||||||||||||||||||
| Purchase of convertible senior note hedge, net of tax benefit of $20,413 |
| | (37,909 | ) | | | | (37,909 | ) | | (37,909 | ) | ||||||||||||||||||||||||
| Issuance of warrants related to convertible senior notes |
| | 29,722 | | | | 29,722 | | 29,722 | |||||||||||||||||||||||||||
| Exercise of stock options |
47 | | 323 | | | | 323 | | 323 | |||||||||||||||||||||||||||
| Tax shortfall from stock awards exercised or released |
| | (744 | ) | | | | (744 | ) | | (744 | ) | ||||||||||||||||||||||||
| Issuance of common stock for performance-based restricted stock units |
104 | | | | | | | | | |||||||||||||||||||||||||||
| Issuance of common stock for restricted stock units |
567 | 1 | (1 | ) | | | | | | | ||||||||||||||||||||||||||
| Stock-based compensation |
| | 8,985 | | | | 8,985 | | 8,985 | |||||||||||||||||||||||||||
|
|
|
|
|
|
|
|
|
|
|
|
|
|
|
|
|
|
|
|||||||||||||||||||
| Balance, December 30, 2013 |
82,655 | 83 | 576,644 | 64,272 | 18,692 | 45,604 | 705,295 | | 705,295 | |||||||||||||||||||||||||||
| Net income |
| | | 14,693 | | | 14,693 | | 14,693 | |||||||||||||||||||||||||||
| Other comprehensive loss |
| | | | | (14,589 | ) | (14,589 | ) | | (14,589 | ) | ||||||||||||||||||||||||
| Transfer to statutory surplus reserve |
| | | (2,544 | ) | 2,544 | | | | | ||||||||||||||||||||||||||
| Issuance and repurchase of convertible senior notes |
| | 4,216 | | | | 4,216 | | 4,216 | |||||||||||||||||||||||||||
| Purchase of convertible senior note hedge, net of tax benefit of $2,964 |
| | (4,989 | ) | | | | (4,989 | ) | | (4,989 | ) | ||||||||||||||||||||||||
| Issuance of warrants related to convertible senior notes |
| | 4,053 | | | | 4,053 | | 4,053 | |||||||||||||||||||||||||||
| Tax shortfall from stock awards exercised or released |
| | (1,015 | ) | | | | (1,015 | ) | | (1,015 | ) | ||||||||||||||||||||||||
| Issuance of common stock for performance-based restricted stock units |
90 | | | | | | | | | |||||||||||||||||||||||||||
| Issuance of common stock for restricted stock units |
600 | | | | | | | | | |||||||||||||||||||||||||||
| Stock-based compensation |
| | 7,800 | | | | 7,800 | | 7,800 | |||||||||||||||||||||||||||
|
|
|
|
|
|
|
|
|
|
|
|
|
|
|
|
|
|
|
|||||||||||||||||||
| Balance, December 29, 2014 |
83,345 | 83 | 586,709 | 76,421 | 21,236 | 31,015 | 715,464 | | 715,464 | |||||||||||||||||||||||||||
| Net (loss) income |
| | | (25,882 | ) | | | (25,882 | ) | 264 | (25,618 | ) | ||||||||||||||||||||||||
| Other comprehensive loss |
| | | | | (29,392 | ) | (29,392 | ) | | (29,392 | ) | ||||||||||||||||||||||||
| Transfer to statutory surplus reserve |
| | | (4,576 | ) | 4,576 | | | | | ||||||||||||||||||||||||||
| Acquisition of Viasystems, Group, Inc. |
15,082 | 15 | 148,991 | | | | 149,006 | 7,300 | 156,306 | |||||||||||||||||||||||||||
| Exercise of stock options |
68 | | 495 | | | | 495 | | 495 | |||||||||||||||||||||||||||
| Tax shortfall from stock awards exercised or released |
| | (247 | ) | | | | (247 | ) | | (247 | ) | ||||||||||||||||||||||||
| Issuance of common stock for restricted stock units |
642 | 1 | (1 | ) | | | | | | | ||||||||||||||||||||||||||
| Stock-based compensation |
| | 9,661 | | | | 9,661 | | 9,661 | |||||||||||||||||||||||||||
|
|
|
|
|
|
|
|
|
|
|
|
|
|
|
|
|
|
|
|||||||||||||||||||
| Balance, December 28, 2015 |
99,137 | $ | 99 | $ | 745,608 | $ | 45,963 | $ | 25,812 | $ | 1,623 | $ | 819,105 | $ | 7,564 | $ | 826,669 | |||||||||||||||||||
|
|
|
|
|
|
|
|
|
|
|
|
|
|
|
|
|
|
|
|||||||||||||||||||
See accompanying notes to consolidated financial statements.
73
Table of Contents
Consolidated Statements of Cash Flows
| For the Year Ended | ||||||||||||
| December 28, 2015 |
December 29, 2014 |
December 30, 2013 |
||||||||||
| (In thousands) | ||||||||||||
| Cash flows from operating activities: |
||||||||||||
| Net (loss) income |
$ | (25,618 | ) | $ | 14,693 | $ | 23,893 | |||||
| Adjustments to reconcile net (loss) income to net cash provided by operating activities: |
||||||||||||
| Depreciation of property, plant and equipment |
133,508 | 95,349 | 92,120 | |||||||||
| Amortization of definite-lived intangible assets |
18,888 | 8,387 | 9,332 | |||||||||
| Amortization of convertible senior notes discount, debt discount and debt issuance costs |
15,451 | 10,165 | 8,466 | |||||||||
| Deferred income taxes |
23,892 | 2,018 | 8,116 | |||||||||
| Stock-based compensation |
9,661 | 7,800 | 8,985 | |||||||||
| Loss on extinguishment of debt |
802 | 506 | 10,743 | |||||||||
| Gain on sale of assets |
(2,504 | ) | | (17,917 | ) | |||||||
| Impairment of long-lived assets |
| 1,845 | 10,782 | |||||||||
| Other |
(4,396 | ) | 1,882 | 518 | ||||||||
| Payment of accreted interest on convertible senior notes |
(8,731 | ) | (1,324 | ) | (27,663 | ) | ||||||
| Changes in operating assets and liabilities, net of disposition: |
||||||||||||
| Accounts and notes receivable, net |
66,062 | (22,485 | ) | (96,394 | ) | |||||||
| Inventories |
8,482 | (7,113 | ) | (9,332 | ) | |||||||
| Prepaid expenses and other current assets |
15,781 | 2,292 | (10,347 | ) | ||||||||
| Accounts payable |
(31,916 | ) | 23,937 | 35,362 | ||||||||
| Accrued salaries, wages and benefits and other accrued expenses |
18,100 | (8,142 | ) | 24,724 | ||||||||
|
|
|
|
|
|
|
|||||||
| Net cash provided by operating activities |
237,462 | 129,810 | 71,388 | |||||||||
|
|
|
|
|
|
|
|||||||
| Cash flows from investing activities: |
||||||||||||
| Acquisition, net of cash acquired |
(169,162 | ) | | | ||||||||
| Designation of cash and cash equivalents to restricted cash |
(19 | ) | | | ||||||||
| Purchase of property, plant and equipment and equipment deposits |
(99,925 | ) | (109,624 | ) | (103,347 | ) | ||||||
| Proceeds from sale of property, plant and equipment and other assets |
21,446 | 1,053 | 67,658 | |||||||||
|
|
|
|
|
|
|
|||||||
| Net cash used in investing activities |
(247,660 | ) | (108,571 | ) | (35,689 | ) | ||||||
|
|
|
|
|
|
|
|||||||
| Cash flows from financing activities: |
||||||||||||
| Proceeds from long-term borrowings |
950,000 | | | |||||||||
| Proceeds from borrowings (repayments) of revolving loan |
80,000 | | (30,000 | ) | ||||||||
| Repayment of assumed long-term debt in acquisition |
(669,024 | ) | | | ||||||||
| Repayment of long-term debt |
(276,178 | ) | (96,204 | ) | | |||||||
| Proceeds from issuance of convertible senior notes |
| 30,000 | 220,000 | |||||||||
| Repurchase of convertible senior notes |
(23,664 | ) | (5,411 | ) | (113,055 | ) | ||||||
| Payment of debt issuance costs |
(34,135 | ) | (1,626 | ) | (6,325 | ) | ||||||
| Payment of original issue discount |
(33,250 | ) | | | ||||||||
| Purchase of convertible senior note hedge |
| (7,953 | ) | (58,322 | ) | |||||||
| Proceeds from warrants |
| 4,053 | 29,722 | |||||||||
| Payments for purchase of non-controlling interest |
| | (29,358 | ) | ||||||||
| Proceeds from exercise of stock options |
495 | | 323 | |||||||||
|
|
|
|
|
|
|
|||||||
| Net cash (used in) provided by financing activities |
(5,756 | ) | (77,141 | ) | 12,985 | |||||||
|
|
|
|
|
|
|
|||||||
| Effect of foreign currency exchange rates on cash and cash equivalents |
(3,988 | ) | 4,390 | (3,563 | ) | |||||||
|
|
|
|
|
|
|
|||||||
| Net (decrease) increase in cash and cash equivalents |
(19,942 | ) | (51,512 | ) | 45,121 | |||||||
| Cash and cash equivalents at beginning of year |
279,042 | 330,554 | 285,433 | |||||||||
|
|
|
|
|
|
|
|||||||
| Cash and cash equivalents at end of year |
$ | 259,100 | $ | 279,042 | $ | 330,554 | ||||||
|
|
|
|
|
|
|
|||||||
| Supplemental cash flow information: |
||||||||||||
| Cash paid, net for interest |
$ | 34,052 | $ | 14,072 | $ | 16,647 | ||||||
| Cash paid, net for income taxes |
14,495 | 297 | 6,065 | |||||||||
| Supplemental disclosure of noncash investing and financing activities: |
||||||||||||
| Property, plant and equipment recorded in equipment and accounts payable |
$ | 24,515 | $ | 49,144 | $ | 80,063 | ||||||
| Common stock issued in connection with Viasystems acquisition |
149,006 | | | |||||||||
See accompanying notes to consolidated financial statements.
74
Table of Contents
TTM TECHNOLOGIES, INC.
Notes to Consolidated Financial Statements
(Dollars and shares in thousands, except per share data)
| (1) | Nature of Operations and Basis of Presentation |
TTM Technologies, Inc. (the Company or TTM) is a major global printed circuit board (PCB) manufacturer, focusing on quick-turn and technologically advanced PCBs and electro-mechanical solutions (E-M Solutions). The Company provides time-to-market and advanced technology products and offers a one-stop manufacturing solution to customers from engineering support to prototype development through final volume production. This one-stop manufacturing solution allows the Company to align technology developments with the diverse needs of the Companys customers and to enable them to reduce the time required to develop new products and bring them to market.
The Company serves a diversified customer base in various markets throughout the world, including manufacturers of networking/communications infrastructure products, tablets and smartphones, as well as the aerospace and defense, automotive controls and information systems, high-end computing, and medical, industrial and instrumentation related products. The Companys customers include both original equipment manufacturers (OEMs) and electronic manufacturing services (EMS) providers.
The Company operates on a 52 or 53 week year ending on the Monday nearest December 31. Fiscal 2015, 2014 and 2013 were 52 weeks and ended on December 28, 2015, December 29, 2014, and December 30, 2013, respectively. All references to years relate to fiscal years unless otherwise noted.
| 2) | Summary of Significant Accounting Policies |
Use of Estimates
The preparation of financial statements in conformity with accounting principles generally accepted in the United States of America (U.S. GAAP) requires management to make estimates and assumptions that affect the reported amounts of assets and liabilities and disclosure of contingent assets and liabilities at the date of the financial statements and the reported amount of revenues and expenses during the reporting period. Such estimates include the sales return reserve; accounts receivable; inventories; goodwill; intangible assets and other long-lived assets; self insurance reserves; derivative instruments and hedging activities; product warranty liabilities; environmental liabilities; legal contingencies; income taxes; and others. These estimates and assumptions are based on managements best estimates and judgment. Management evaluates its estimates and assumptions on an ongoing basis using historical experience and other factors, including the economic environment, which management believes to be reasonable under the circumstances. Management adjusts such estimates and assumptions when facts and circumstances dictate. Unpredictable spending by OEM and EMS companies has also increased the uncertainty inherent in such estimates and assumptions. As future events and their effects cannot be determined with precision, actual results could differ from those estimates.
Principles of Consolidation
The consolidated financial statements include the accounts of TTM Technologies, Inc. and its subsidiaries. All intercompany accounts and transactions have been eliminated in consolidation.
Foreign Currency Translation and Transactions
The functional currency of certain of the Companys subsidiaries is either the Chinese Renminbi (RMB) or the Hong Kong Dollar. Accordingly, assets and liabilities are translated into U.S. dollars using period-end exchange rates. Sales and expenses are translated at the average exchange rates in effect during the period. The resulting translation gains or losses are recorded as a component of accumulated other comprehensive income in the consolidated statement of stockholders equity and the consolidated statement of comprehensive income (loss). Net gains resulting from foreign currency remeasurements and transactions are included in income as a component of other, net in the consolidated statements of operations and totaled $6,766, $2,378, and $6,113 for the years ended December 28, 2015, December 29, 2014 and December 30, 2013, respectively.
75
Table of Contents
TTM TECHNOLOGIES, INC.
Notes to Consolidated Financial Statements (Continued)
Cash Equivalents
The Company considers highly liquid investments with insignificant interest rate risk and original maturities to the Company of three months or less to be cash equivalents. Cash equivalents consist primarily of interest-bearing bank accounts and money market funds.
The Company considers highly liquid investments with an effective maturity to the Company of more than three months and less than one year to be short-term investments.
As of December 28, 2015, the Company had $3,530 of restricted cash related to the collaterization of certain letter of credit arrangements. These letter of credit arrangements are due to expire at various times during 2016.
Accounts Receivable and Allowance for Doubtful Accounts
Accounts receivable are reflected at estimated net realizable value, do not bear interest and do not generally require collateral. The Company performs credit evaluations of its customers and adjusts credit limits based upon payment history and the customers current creditworthiness. The Company maintains an allowance for doubtful accounts based upon a variety of factors. The Company reviews all open accounts and provides specific reserves for customer collection issues when it believes the loss is probable, considering such factors as the length of time receivables are past due, the financial condition of the customer, and historical experience. The Company also records a reserve for all customers, excluding those that have been specifically reserved for, based upon evaluation of historical losses.
The following summarizes the activity in the Companys allowance for doubtful accounts for the years ended December 28, 2015, December 29, 2014 and December 30, 2013:
| For the Year Ended | ||||||||||||
| December 28, 2015 |
December 29, 2014 |
December 30, 2013 |
||||||||||
| (In thousands) | ||||||||||||
| Balance at beginning of year |
$ | 696 | $ | 518 | $ | 1,680 | ||||||
| Additions charged to (reversals of) expense |
854 | 214 | (157 | ) | ||||||||
| Sale of a majority owned subsidiary |
| | (459 | ) | ||||||||
| Deductions |
(26 | ) | (34 | ) | (554 | ) | ||||||
| Effect of foreign currency exchange rates |
1 | (2 | ) | 8 | ||||||||
|
|
|
|
|
|
|
|||||||
| Balance at end of year |
$ | 1,525 | $ | 696 | $ | 518 | ||||||
|
|
|
|
|
|
|
|||||||
Inventories
Inventories are stated at the lower of cost (determined on a first-in, first-out and weighted average basis) or market. Assessments to value the inventory at the lower of the actual cost to purchase and / or manufacture the inventory, or the current estimated market value of the inventory, are based upon assumptions about future demand and market conditions. As a result of the Companys assessments, when the market value of inventory is less than the carrying value, the inventory cost is written down to the market value and the write down is recorded as a charge to cost of goods sold.
76
Table of Contents
TTM TECHNOLOGIES, INC.
Notes to Consolidated Financial Statements (Continued)
Property, Plant and Equipment, Net
Property, plant and equipment are recorded at cost. Depreciation expense is computed using the straight-line method over the estimated useful lives of the assets. Assets recorded under leasehold improvements are amortized using the straight-line method over the lesser of their useful lives or the related lease term. The Company uses the following estimated useful lives:
| Land use rights |
50-99 years | |||
| Buildings and improvements |
7-50 years | |||
| Machinery and equipment |
3-12 years | |||
| Furniture and fixtures |
3-7 years |
Upon retirement or other disposition of property, plant and equipment, the cost and related accumulated depreciation are removed from the accounts. The resulting gain or loss is included in the determination of operating income in the period incurred. Depreciation and amortization expense on property, plant and equipment was $133,508, $95,349, and $92,120 for the years ended December 28, 2015, December 29, 2014 and December 30, 2013, respectively.
The Company capitalizes interest on borrowings during the active construction period of major capital projects. Capitalized interest is amortized over the average useful lives of such assets, which primarily consist of buildings and machinery and equipment. The Company capitalized interest costs of $888, $551, and $1,125 during the years ended December 28, 2015, December 29, 2014 and December 30, 2013, respectively, in connection with various capital projects.
Major renewals and betterments are capitalized and depreciated over their estimated useful lives while minor expenditures for maintenance and repairs are included in operating income as incurred.
Goodwill
Goodwill represents the excess of purchase price of an acquisition over the fair value of net assets acquired. Goodwill is not amortized but instead is assessed for impairment, at a reporting unit level, annually and when events and circumstances warrant an evaluation. In making this assessment, management relies on a number of factors, including expected future operating results, business plans, economic projections, anticipated future cash flows, business trends and market conditions.
The Company has two reportable operating segments consisting of seven reporting units. The Company evaluates its goodwill on an annual basis in the fourth quarter or more frequently if it believes indicators of impairment exist. The Company first assesses qualitative factors to determine whether it is more likely than not that the fair value of a reporting unit is less than its carrying amount. If the Company concludes that it is more likely than not that the fair value of a reporting units is less than its carrying amount, it conducts a two-step quantitative goodwill impairment test. The first step of the impairment test involves comparing the fair values of the applicable reporting units with their carrying values. The Company estimates the fair values of its reporting units using a combination of the income and market approach. If the carrying amount of a reporting unit exceeds the reporting units fair value, the Company performs the second step of the goodwill impairment test. The second step of the goodwill impairment test involves comparing the implied fair value of the affected reporting units goodwill with the carrying value of that goodwill. The amount, by which the carrying value of the goodwill exceeds its implied fair value, if any, is recognized as an impairment loss. In the fourth quarter of 2015, the Company performed its annual impairment test qualitatively and concluded that goodwill was not impaired.
Intangible Assets
Intangible assets include customer relationships, technology and trade names, which are being amortized over their estimated useful lives using straight-line and accelerated methods. The estimated useful lives of such intangibles range from 3 years to 10 years.
77
Table of Contents
TTM TECHNOLOGIES, INC.
Notes to Consolidated Financial Statements (Continued)
Impairment of Long-lived Assets
Long-lived tangible assets, including property, plant and equipment, assets held for sale, and definite-lived intangible assets, are reviewed for impairment whenever events or changes in circumstances indicate that the carrying value of the asset or asset groups may not be recoverable. The Company regularly evaluates whether events or circumstances have occurred that indicate possible impairment and relies on a number of factors, including expected future operating results, business plans, economic projections, and anticipated future cash flows. The Company uses an estimate of the future undiscounted net cash flows and comparisons to like-kind assets, as appropriate, of the related asset or asset group over the remaining life in measuring whether the assets are recoverable. Measurement of the amount of impairment, if any, is based upon the difference between the assets carrying value and estimated fair value. Fair value is determined through various valuation techniques, including cost-based, market and income approaches as considered necessary. See Note 4 for information regarding the impairment of long-lived assets during the years ended 2014 and 2013.
The Company classifies assets to be sold as assets held for sale when (i) Company management has approved and commits to a plan to sell the asset; (ii) the asset is available for immediate sale in its present condition and is ready for sale; (iii) an active program to locate a buyer and other actions required to sell the asset have been initiated; (iv) the sale of the asset is probable; (v) the asset is being actively marketed for sale at a price that is reasonable in relation to its current fair value; and (vi) it is unlikely that significant changes to the plan will be made or that the plan will be withdrawn. Assets classified as held for sale are recorded at the lower of the carrying amount or fair value less the cost to sell and are a component of prepaid expenses and other current assets in the consolidated balance sheet.
The Company classifies assets held for use when a decision to dispose of an asset or a business is made and the held for sale criteria are not met. Assets of the business are evaluated for recoverability in the following order: (i) assets other than goodwill, property and intangibles; (ii) property and intangibles subject to amortization; and (iii) goodwill. In evaluating the recoverability of property and intangible assets subject to amortization, in a held for use business, the carrying value is first compared to the sum of the undiscounted cash flows expected to result from the use and eventual disposition. If the carrying value exceeds the undiscounted expected cash flows, then a fair value analysis is performed. An impairment charge is recognized if the carrying value exceeds the fair value.
Revenue Recognition
The Company derives its revenue primarily from the sale of PCBs using customer supplied engineering and design plans and recognizes revenue when: (i) persuasive evidence of a sales arrangement exists; (ii) the sales terms are fixed or determinable; (iii) title and risk of loss have transferred; and (iv) collectability is reasonably assured generally when products are shipped to the customer, except in situations in which title passes upon receipt of the products by the customer. In this case, revenues are recognized upon notification that customer receipt has occurred. The Company does not have customer acceptance provisions, but it does provide its customers a limited right of return for defective PCBs. The Company accrues an estimated amount for sales returns and allowances related to defective PCBs at the time of sale based on its ability to estimate sales returns and allowances using current and historical information. The reserve for sales returns and allowances is included as a reduction to revenue and accounts receivable, net. Shipping and handling fees and related freight costs and supplies associated with shipping products to customers are included as a component of cost of goods sold. Incremental warranty costs that are not related to sales returns are recorded in accrued expenses and cost of goods sold.
78
Table of Contents
TTM TECHNOLOGIES, INC.
Notes to Consolidated Financial Statements (Continued)
The following summarizes the activity in the Companys allowance for sales returns and allowances for the years ended December 28, 2015, December 29, 2014 and December 30, 2013:
| For the Year Ended | ||||||||||||
| December 28, 2015 |
December 29, 2014 |
December 30, 2013 |
||||||||||
| (In thousands) | ||||||||||||
| Balance at beginning of year |
$ | 6,890 | $ | 6,028 | $ | 9,320 | ||||||
| Additions charged to expense |
21,728 | 38,440 | 33,154 | |||||||||
| Sale of a majority owned subsidiary |
| | (347 | ) | ||||||||
| Deductions |
(20,832 | ) | (37,578 | ) | (36,104 | ) | ||||||
| Effect of foreign currency exchange rates |
3 | | 5 | |||||||||
|
|
|
|
|
|
|
|||||||
| Balance at end of year |
$ | 7,789 | $ | 6,890 | $ | 6,028 | ||||||
|
|
|
|
|
|
|
|||||||
Stock-Based Compensation
The Company recognizes stock-based compensation expense in its consolidated financial statements for its incentive compensation plan awards.
The incentive compensation plan awards include performance-based restricted stock units, restricted stock units, and stock options and the associated compensation expense is based on the grant date fair value of the awards, net of estimated forfeitures, as well as an assessment of probability of the performance-based awards vesting. Compensation expense for the incentive compensation plan awards is recognized on a straight line basis over the vesting period of the awards. The fair value of performance-based restricted stock units is estimated on the grant date using a Monte Carlo simulation model based on the underlying common stock closing price as of the date of grant, the expected term, stock price volatility, and risk-free interest rates. The fair value of restricted stock units is measured on the grant date based on the quoted closing market price of the Companys common stock. The fair value of the stock options is estimated on the grant date using the Black-Scholes option pricing model based on the underlying common stock closing price as of the date of grant, the expected term, stock price volatility, and risk-free interest rates.
Income Taxes
Income taxes are accounted for under the asset and liability method. Deferred income tax assets or liabilities are recognized for the future tax consequences attributable to differences between the financial statement carrying amounts of assets and liabilities and their respective tax bases and operating loss and tax credit carryforwards. Deferred income tax assets and liabilities are measured using enacted tax rates expected to apply to taxable income in the years in which those temporary differences are expected to be settled or realized. The effect on deferred income tax assets and liabilities of a change in tax rates is recognized in income in the period that includes the enactment date. Deferred income tax assets are reviewed for recoverability, and the Company records a valuation allowance to reduce its deferred income tax assets when it is more likely than not that all or some portion of the deferred income tax assets will not be realized.
The Company has various foreign subsidiaries formed or acquired to conduct or support its business outside the United States. The Company does not provide for U.S. income taxes on undistributed earnings for certain subsidiaries in China as management expects the foreign earnings will be indefinitely reinvested in such foreign jurisdictions. For certain subsidiaries within the China, indefinite investment of undistributed earnings has not been asserted between the respective subsidiaries and their foreign parent entity and therefore, a deferred tax liability for the foreign tax impacts has been recorded on the undistributed earnings of these subsidiaries.
The Company recognizes the effect of income tax positions only if those positions are more likely than not of being sustained. Recognized income tax positions are measured at the largest amount that is greater than 50
79
Table of Contents
TTM TECHNOLOGIES, INC.
Notes to Consolidated Financial Statements (Continued)
percent likely to be realized. Changes in recognition or measurement are reflected in the period in which the change in judgment occurs. Estimated interest and penalties related to underpayment of income taxes are recorded as a component of income tax provision in the consolidated statement of operations.
Self Insurance
The Company is primarily self insured in North America for group health insurance and workers compensation benefits provided to U.S. employees. The Company also purchases stop loss insurance to protect against annual claims per individual and at an aggregate level. The individual insured stop loss on the Companys self insurance is $200 per individual for the recently acquired Viasystems subsidiaries and $300 per individual for the existing TTM subsidiaries for group health insurance and $250 per individual for workers compensation benefits. Self insurance liabilities are estimated for claims incurred but not paid based on judgment, using the Companys historical claim data and information and analysis provided by actuarial and claim advisors, the Companys insurance carrier and brokers. The Company has accrued $5,182 and $5,032 for self insurance liabilities as of December 28, 2015 and December 29, 2014, respectively, and these amounts are reflected within accrued salaries, wages and benefits in the consolidated balance sheets.
Group health insurance and workers compensation benefits for the Companys plants in China are fully insured with third parties.
Convertible Debt
The accounting standards for convertible debt instruments that may be fully or partially settled in cash upon conversion require the debt and equity components to be separately accounted for in a manner that reflects the Companys nonconvertible borrowing rate when interest expense is recognized in subsequent periods. The amount recorded as debt is based on the fair value of the debt component as a standalone instrument, determined using an average interest rate for similar nonconvertible debt issued by entities with credit ratings comparable to the Companys at the time of issuance. The difference between the debt recorded at inception and its principal amount is to be accreted to principal through interest expense through the estimated life of the note.
Derivative Instruments and Hedging Activities
Derivative financial instruments are recognized as either assets or liabilities in the consolidated balance sheet at their respective fair values. As a matter of policy, the Company uses derivatives for risk management purposes. The Company does not use derivatives for speculative purposes.
Derivatives are typically entered into as hedges for changes in interest rates, currency exchange rates, and other risks. When the Company determines to designate a derivative instrument as a cash flow hedge, the Company formally documents the hedging relationship and its risk management objective and strategy for undertaking the hedge, the hedging instrument, the hedged item, the nature of the risk being hedged, how the hedging instruments effectiveness in offsetting the hedged risk will be assessed, and a description of the method of measuring ineffectiveness. The Company also formally assesses, both at the hedges inception and on an ongoing basis, whether the derivative that is used in hedging transactions is highly effective in offsetting changes in cash flows of hedged items.
Fair value of the derivative instruments is determined using pricing models developed based on the underlying swap interest rate, foreign currency exchange rates, and other observable market data as appropriate. The values are also adjusted to reflect nonperformance risk of the counterparty and the Company, as necessary. For derivatives that are designated as a cash flow hedge, changes in the fair value of the derivative are recognized in accumulated other comprehensive income, to the extent the derivative is effective at offsetting the changes in cash flow being hedged until the hedged item affects earnings. To the extent there is any hedge ineffectiveness, changes in fair value relating to the ineffective portion are immediately recognized in earnings. Changes in the fair value of derivatives that are not designated as hedges are recorded in earnings each period.
80
Table of Contents
TTM TECHNOLOGIES, INC.
Notes to Consolidated Financial Statements (Continued)
Value Added and Sales Tax Collected from Customers
As a part of the Companys normal course of business, value added and sales taxes are collected from customers. Such taxes collected are remitted, in a timely manner, to the appropriate governmental tax authority on behalf of the customer. The Companys policy is to present revenue and costs, net of value added and sales taxes.
Fair Value Measures
The Company measures at fair value certain of its financial and non-financial assets and liabilities by using a fair value hierarchy that prioritizes the inputs to valuation techniques used to measure fair value. Fair value is the price that would be received to sell an asset or paid to transfer a liability in an orderly transaction between market participants at the measurement date, essentially an exit price, based on the highest and best use of the asset or liability. The levels of the fair value hierarchy are:
Level 1 Quoted market prices in active markets for identical assets or liabilities;
Level 2 Significant other observable inputs (e.g., quoted prices for similar items in active markets, quoted prices for identical or similar items in markets that are not active, inputs other than quoted prices that are observable, such as interest rate and yield curves, and market-corroborated inputs); and
Level 3 Unobservable inputs in which there is little or no market data, which require the reporting unit to develop its own assumptions.
Environmental Accrual
Accruals for estimated costs for environmental obligations generally are recognized no later than the date when the Company identifies what cleanup measures, if any, are likely to be required to address the environmental condition. Included in such obligations are the estimated direct costs to investigate and address the conditions, and the associated engineering, legal and consulting costs. In making these estimates, the Company considers information that is currently available, existing technology, enacted laws and regulations, and its estimates of the timing of the required remedial actions. Such accruals are initially measured on a discounted basis and are adjusted as further information becomes available or circumstances change and are accreted to the payable amount over time.
Earnings Per Share
Basic earnings per common share excludes dilution and is computed by dividing net income attributable to TTM Technologies, Inc. stockholders by the weighted average number of common shares outstanding during the period. Diluted earnings per common share reflect the potential dilution that could occur if stock options, convertible senior notes or other common stock equivalents were exercised or converted into common stock. The dilutive effect of stock options or other common stock equivalents is calculated using the treasury stock method, while the dilutive effect of convertible senior notes is calculated using the if-converted method.
Comprehensive Income
Comprehensive income includes changes to equity accounts that were not the result of transactions with stockholders. Comprehensive income is comprised of net income (loss), changes in the cumulative foreign currency translation adjustments and realized and unrealized gains or losses on hedged derivative instruments and available for sale securities.
Loss Contingencies
The Company establishes an accrual for an estimated loss contingency when it is both probable that an asset has been impaired or that a liability has been incurred and the amount of the loss can be reasonably estimated. Any legal fees expected to be incurred in connection with a contingency are expensed as incurred.
81
Table of Contents
TTM TECHNOLOGIES, INC.
Notes to Consolidated Financial Statements (Continued)
Recently Adopted and Issued Accounting Standards
In November 2015 the Financial Accounting Standards Board (FASB) issued Accounting Standards Update (ASU) No. 2015-17, Balance Sheet Classification of Deferred Taxes, which requires entities with a classified balance sheet to present all deferred tax assets and liabilities as non-current. We adopted the provisions of this update in the fourth quarter of 2015 on a prospective basis. The impact on the Companys consolidated financial statements was not material.
In September 2015, the FASB issued ASU 2015-16, Simplifying the Accounting for Measurement-Period Adjustments, which requires that an acquirer recognize adjustments to provisional values of assets acquired and liabilities assumed in a business combination in the reporting period in which the adjustment amounts are determined and not on a retrospective basis. The Company adopted ASU 2015-16 in the third quarter of 2015, and the Companys adoption did not have a material impact on its consolidated financial statements.
In April 2015, the FASB issued ASU 2015-03, Imputation of Interest, which requires an entity to record debt issuance costs related to a note reported in the balance sheet as a direct deduction from the face amount of that note. The update is effective for annual periods ending after December 15, 2015. Early application is permitted. The standard requires the use of the retrospective transition method. The impact on the Companys consolidated financial statements is not expected to be material.
In May 2014, the FASB issued ASU 2014-09, Revenue from Contracts with Customers, which requires an entity to recognize the amount of revenue to which it expects to be entitled for the transfer of promised goods or services to customers. The ASU will replace most existing revenue recognition guidance in U.S. GAAP when it becomes effective. The new standard is effective for the Company at the beginning of fiscal year 2018, however application of the standard is allowed as early as the beginning of fiscal 2017. The standard permits the use of either the retrospective or cumulative effect transition method. The Company is evaluating the effect that ASU 2014-09 will have on its consolidated financial statements and related disclosures. The Company has not yet selected a transition method nor has it determined the effect of the standard on its ongoing financial reporting.
| (3) | Acquisition of Viasystems Group, Inc. |
On May 31, 2015, the Company completed the acquisition of Viasystems Group, Inc. (Viasystems), for total consideration of $248,824 in cash and 15,082 shares of TTM common stock with a fair value of $149,006, to acquire all of the outstanding shares of capital stock and other equity rights of Viasystems. Additionally, in connection with the completion of the acquisition, the Company assumed and refinanced Viasystems debt, which was approximately $669,024 as of May 31, 2015. Viasystems was a worldwide provider of complex multi-layer rigid, flexible, and rigid-flex PCBs and custom electronic assemblies. Viasystems products were found in a wide variety of commercial products, including automotive engine controls, hybrid converters, automotive electronics for navigation, safety, and entertainment, telecommunications switching equipment, data networking equipment, computer storage equipment, semiconductor test equipment, wind and solar energy applications, off-shore drilling equipment, communications applications, flight control systems, and complex industrial, medical, and other technical instruments. Viasystems E-M Solutions services have been be bundled with its PCB products to provide an integrated solution to customers. Viasystems operated 15 manufacturing facilities worldwide: eight in the United States, five in the Peoples Republic of China (China), and one each in Canada and Mexico. Viasystems served a diversified customer base of over 1,000 customers in various markets throughout the world.
Bank fees and legal, accounting, and other professional service costs associated with the acquisition of Viasystems of $34,448 and $5,981 for the years ended December 28, 2015 and December 29, 2014, respectively, have been expensed and recorded as general and administrative expense in the consolidated statements of operations. There were no bank fees and legal, accounting, and other professional service costs associated with the acquisition of Viasystems for the year ended December 30, 2013.
82
Table of Contents
TTM TECHNOLOGIES, INC.
Notes to Consolidated Financial Statements (Continued)
The following summarizes the components of the purchase price:
| (In thousands) | ||||
| Value of TTM common stock issued |
$ | 149,006 | ||
| Cash consideration |
248,824 | |||
|
|
|
|||
| 397,830 | ||||
| Debt assumed |
669,024 | |||
|
|
|
|||
| Enterprise value |
$ | 1,066,854 | ||
|
|
|
|||
The value of the shares of the Companys common stock used in determining the purchase price was $9.88 per share, the closing price of the Companys common stock on May 29, 2015, the last business day prior to the effective date of the acquisition.
Preliminary Purchase Price Allocation
The purchase price of the Viasystems acquisition was allocated to tangible and intangible assets acquired, liabilities assumed and noncontrolling interest based on preliminary estimates the fair value at the date of the acquisition (May 31, 2015). The excess of the purchase price over the fair value of net assets acquired and noncontrolling interest was allocated to goodwill. The fair value assigned to intangible assets acquired was based on estimates and assumptions made by management at the time of acquisition.
The fair values assigned are based on reasonable methods applicable to the nature of the assets acquired, liabilities assumed and noncontrolling interest. The following summarizes the preliminary estimated fair values of net assets acquired and noncontrolling interest:
| (In thousands) | ||||
| Cash |
$ | 79,662 | ||
| Restricted cash |
3,510 | |||
| Accounts and notes receivables ($216,259 contractual gross receivables) |
209,196 | |||
| Inventories |
132,216 | |||
| Prepaid expenses and other current assets |
30,633 | |||
| Property, plant and equipment |
427,457 | |||
| Identifiable intangible assets |
150,500 | |||
| Goodwill |
334,870 | |||
| Deposits and other noncurrent assets |
1,157 | |||
| Current liabilities |
(253,263 | ) | ||
| Long-term debt |
(669,024 | ) | ||
| Other liabilities |
(41,784 | ) | ||
| Noncontrolling interest |
(7,300 | ) | ||
|
|
|
|||
| Total |
$ | 397,830 | ||
|
|
|
|||
Due to the fact that the Viasystems acquisition has just recently occurred, the magnitude of the transaction, and as significant information to be obtained and analyzed resides in a foreign jurisdiction, the Companys fair value estimates for the purchase price allocation are preliminary and may change during the allowable measurement period, which is up to the point the Company obtains and analyzes the information that existed as of the date of the acquisition necessary to determine the fair values of the assets acquired, liabilities assumed and noncontrolling interest, but in no case to exceed more than one year from the date of acquisition. As of
83
Table of Contents
TTM TECHNOLOGIES, INC.
Notes to Consolidated Financial Statements (Continued)
December 28, 2015, the Company had not finalized the determination of fair values allocated to deferred taxes, goodwill, tax uncertainties, income taxes payable, and other liabilities. Any changes in the fair values of the liabilities assumed during the measurement period may result in material adjustments to goodwill.
Inventories
The Company acquired $132,216 of inventories as a result of the acquisition, which includes a fair value step up of $14,200. Finished goods were valued at estimated selling prices less costs of disposal and a reasonable profit allowance for the selling effort. Work-in-process inventory was valued at estimated selling prices less costs to complete, costs of disposal and a reasonable profit allowance for the completion and selling effort. The fair value step amount was charged to cost of goods sold over normal inventory turn periods and as of December 28, 2015 has been fully absorbed into cost of goods sold. Raw materials were valued at estimated replacement cost.
Property, Plant and Equipment
The fair value of property, plant and equipment was determined by utilizing three approaches: the cost, sales comparison, and income capitalization approaches, each including management assumptions. Each approach assumes valuation of the property at the propertys highest and best use.
Noncontrolling Interest
Noncontrolling interest consists of a 5% equity interest in a manufacturing facility in Huiyang, China. The fair value was determined by utilizing a combination of income and market comparable approaches. The income approach was used to estimate the total enterprise value of the noncontrolling interest by estimating discounted future cash flows. The market comparable approach indicates the fair value of the noncontrolling interest based on a comparison to comparable enterprises in similar lines of business that are publicly traded.
Identifiable Intangible Assets
Acquired identifiable intangible assets include customer relationships and technology. The fair value of the identifiable intangible assets was determined using various income approach methods including excess earnings to determine the present value of expected future cash flows for each identifiable intangible asset based on discount rates which incorporate a risk premium to take into account the risks inherent in those expected cash flows. The expected cash flows were estimated based on forecasted revenues and costs adjusted based on the expectations of market participants. The Company used risk adjusted discount rates between 13% and 14% to discount the expected future cash flows under the income approach. The preliminary estimated fair value assigned to each class of intangible assets and the related weighted average amortization periods are as follows:
| Estimated fair value |
Weighted-average amortization period |
|||||||
| (In thousands) | ||||||||
| Customer relationships |
$ | 147,500 | 8.1 years | |||||
| Technology |
3,000 | 3.0 years | ||||||
|
|
|
|||||||
| $ | 150,500 | |||||||
|
|
|
|||||||
Goodwill
Goodwill represents the excess of the Viasystems purchase price over the fair value of assets acquired, liabilities assumed and noncontrolling interest. During the year ended December 28, 2015, goodwill was adjusted to reflect:
| | a decrease in cash by $2,561 and restricted cash by $32 as a result of additional information received regarding the collateralization of specific letters of credit; |
84
Table of Contents
TTM TECHNOLOGIES, INC.
Notes to Consolidated Financial Statements (Continued)
| | an increase in trade and notes receivable by $1,063 as a result of additional information received regarding the collectability of such trade and notes receivable; |
| | a decrease in fair value of inventory by $6,061 resulting from additional information received regarding the valuation of inventory; |
| | a decrease in current assets of $390 as a result of additional information regarding value of current assets; |
| | a decrease in property, plant and equipment by $25,379 due to additional information received regarding the valuation of certain property acquired; |
| | an increase in intangible assets by $4,000 resulting from additional information received regarding the valuation of identifiable intangible assets; |
| | an increase in other noncurrent assets by $485 primarily related to a long-term below market lease asset; |
| | an increase in current liabilities by $5,423 due to a reassessment of product claims and other amounts due to vendors, and an decrease in other noncurrent liabilities by $637 primarily related to noncurrent deferred taxes; and |
| | an increase in noncontrolling interest by $3,277 resulting from additional information received regarding the valuation. |
Prior to the Companys acquisition of Viasystems, the Company had two reportable operating segments based on geographical location of operations, North America and Asia Pacific, consistent with the nature of its operations. Due to the acquisition, the Company has reassessed its reportable operating segments and determined that it has two reportable operating segments, PCB and E-M Solutions. The excess purchase price over the fair value of assets acquired, liabilities assumed and noncontrolling interest has been allocated to the PCB reportable operating segment given that Viasystems was primarily a worldwide provider of complex multi-layer rigid, flexible, and rigid-flex PCBs.
The Company believes that the acquisition of Viasystems will produce the following significant benefits:
| | Strengthens the Companys Position as a Global Market Leader. The combination of the Company and Viasystems is expected to create one of the largest and most diversified PCB manufacturers in the world. The addition of Viasystems adds new product technologies, production and development solutions, and customer base. |
| | Enhances End Market and Customer Diversification and Provides Entry to Attractive Automotive Markets. The Company believes that the combination will expand and diversify the Companys customer base, end markets served, and product suite. The combination should significantly increase the Companys presence in the automotive end market. In addition, the combination is expected to expand the Companys presence in the Medical, Industrial and Instrumentation, Networking / Communications, and Aerospace / Defense end markets. |
The Company believes that these primary factors support the amount of goodwill recognized as a result of the purchase price paid for Viasystems, in relation to other acquired tangible and intangible assets. The goodwill acquired in the acquisition is not expected to be deductible for income tax purposes subject to certain tax elections that are currently being considered.
Results of Operations
Included in the consolidated statement of operations are net sales from the Viasystems operations of $664,341, excluding intercompany sales, for the year ended December 28, 2015. Net losses included in the consolidated statement of operations from the Viasystems operations for the year ended December 28, 2015 have not been reported as it is impracticable to do so given the integration and other efficiency and cost saving measures in process during the year ended December 28, 2015.
85
Table of Contents
TTM TECHNOLOGIES, INC.
Notes to Consolidated Financial Statements (Continued)
Pro forma Financial Information
The unaudited pro forma financial information in the table below gives effect to this acquisition as if it had occurred at the beginning of fiscal 2014. The pro forma financial information presented includes the effects of adjustments related to the fair value step up of acquired inventory, amortization of acquired intangible assets and depreciation of acquired fixed assets, and other non-recurring transactions costs directly associated with the acquisitions such as legal, accounting and banking fees.
| Year Ended | ||||||||
| December 28, 2015 |
December 29, 2014 |
|||||||
| (In thousands, except per share data) | ||||||||
| Net sales |
$ | 2,602,304 | $ | 2,529,819 | ||||
| Net loss attributable to TTM Technologies, Inc. stockholders |
(13,827 | ) | (12,186 | ) | ||||
| Basic loss per share |
$ | (0.15 | ) | $ | (0.12 | ) | ||
|
|
|
|
|
|||||
| Dilutive loss per share |
$ | (0.15 | ) | $ | (0.12 | ) | ||
|
|
|
|
|
|||||
The pro forma financial information as presented above is for informational purposes only and is not necessarily indicative of the actual results that would have been achieved had the Viasystems acquisition occurred at the beginning of the earliest period presented, or the results that may be achieved in future periods.
| (4) | Restructuring and Impairment Charges |
Consolidation Plan and Restructuring Activities
On September 29, 2015, the Company announced a consolidation plan that will result in the closure of the Companys facilities in Cleveland, Ohio, Milpitas, California and Juarez, Mexico (the Consolidation Plan) and the layoff of approximately 480 employees at these sites. The Consolidation Plan is part of the Companys integration strategy to improve total plant utilization, operational performance and customer focus following its recent acquisition of Viasystems. In accordance with the Consolidation Plan, the Company will combine its Cleveland and Milpitas facilities into its North Jackson, Ohio and Silicon Valley, California facilities, respectively, and close its Juarez facility.
In connection with the Consolidation Plan and other global realignment restructuring efforts during the year ended December 28, 2015, the Company recognized a total of $6,832 in employee separation costs. These costs were classified as restructuring charges in the consolidated statement of operations. The Company recognized $2,050 of employee separation costs in its PCB operating segment, $2,039 in its E-M Solutions operating segment, and $2,743 in its Corporate operating segment. As of December 28, 2015, $6,044 of accrued separation costs remain for employees yet to be separated and are included as a component of accrued salaries, wages and benefits in the consolidated balance sheet. The Company expects the remaining employees to be separated and a significant amount of the remaining accrued restructuring costs to be paid by June 2016.
Additionally, during the year ended December 28, 2015, the Company incurred $549 in contract termination costs primarily related to building operating leases associated with the down-sizing of its St. Louis, Missouri corporate office, which is included in the Corporate operating segment. These estimated contract termination costs are included as a component of other accrued expenses in the consolidated balance sheet.
86
Table of Contents
TTM TECHNOLOGIES, INC.
Notes to Consolidated Financial Statements (Continued)
The below table shows the utilization of the accrued restructuring costs during the year ended December 28 2015:
| Severance |
Contract Termination |
Total | ||||||||||
| (In thousands) | ||||||||||||
| Accrued at December 29, 2014 |
$ | | $ | | $ | | ||||||
| Charged to expense |
6,832 | 549 | 7,381 | |||||||||
| Amount paid |
(788 | ) | (14 | ) | (802 | ) | ||||||
|
|
|
|
|
|
|
|||||||
| Accrued at December 28, 2015 |
$ | 6,044 | $ | 535 | $ | 6,579 | ||||||
|
|
|
|
|
|
|
|||||||
The Company also recorded other exit costs of $878 related to inventory write-downs associated with the consolidation of the Milpitas facility to other Silicon Valley, California facilities during the year ended December 28, 2015. These costs have been recorded as a component of cost of goods sold in the consolidated statement of operations.
The Company estimates that it will incur total charges related to the Plan of approximately $10,000 to $15,000.
Impairment and Sale of Suzhou, China Manufacturing Facility
The Company ceased manufacturing at its Meadville Aspocomp (Suzhou) Electronic Co., Ltd. subsidiary, which held its Suzhou, China manufacturing facility, and shut down its operations in 2013. As a result, the Company determined that certain long-lived assets were impaired and as such, recorded charges of $1,845 and $10,782 for the years ended December 29, 2014 and December 30, 2013, respectively, primarily related to machinery and equipment held for sale.
Additionally, as a result of the shutdown, the Company laid-off 774 employees at this site and recorded $3,445 in employee separation costs for the year ended December 30, 2013. These costs were classified as restructuring charges in the consolidated statement of operations. As of December 28, 2015 all employees had been separated.
In the fourth quarter of 2014, the Company commenced the process of selling this subsidiary and classified its net assets of $21,031 as assets held for sale at December 29, 2014. Assets held for sale were included in prepaid expenses and other current assets in the December 29, 2014 consolidated balance sheet.
During the year ended December 28, 2015, the Company sold its Meadville Aspocomp (Suzhou) Electronic Co., Ltd. subsidiary for $21,275 and recognized a gain of $2,504.
The Suzhou, China manufacturing facility is included in the PCB operating segment.
87
Table of Contents
TTM TECHNOLOGIES, INC.
Notes to Consolidated Financial Statements (Continued)
| (5) | Composition of Certain Consolidated Financial Statement Captions |
| As of | ||||||||
| December 28, 2015 |
December 29, 2014 |
|||||||
| (In thousands) | ||||||||
| Inventories: |
||||||||
| Raw materials |
$ | 70,577 | $ | 44,477 | ||||
| Work-in-process |
97,193 | 57,544 | ||||||
| Finished goods |
101,153 | 43,166 | ||||||
|
|
|
|
|
|||||
| $ | 268,923 | $ | 145,187 | |||||
|
|
|
|
|
|||||
| Property, plant and equipment, net: |
||||||||
| Land and land use rights |
$ | 91,571 | $ | 31,093 | ||||
| Buildings and improvements |
446,763 | 247,404 | ||||||
| Machinery and equipment |
1,058,565 | 854,829 | ||||||
| Construction-in-progress, furniture and fixtures and other |
39,550 | 43,527 | ||||||
|
|
|
|
|
|||||
| 1,636,449 | 1,176,853 | |||||||
| Less: Accumulated depreciation |
(533,382 | ) | (422,135 | ) | ||||
|
|
|
|
|
|||||
| $ | 1,103,067 | $ | 754,718 | |||||
|
|
|
|
|
|||||
| Other accrued liabilities: |
||||||||
| Interest |
$ | 14,473 | $ | 581 | ||||
| Equipment payable |
14,251 | 47,212 | ||||||
| Other |
73,024 | 41,401 | ||||||
|
|
|
|
|
|||||
| $ | 101,748 | $ | 89,194 | |||||
|
|
|
|
|
|||||
| (6) | Goodwill |
As of December 28, 2015 and December 29, 2014, goodwill was as follows:
| Total | ||||
| (In thousands) | ||||
| Balance as of December 30, 2013 |
$ | 12,120 | ||
| Foreign currency translation adjustment |
(9 | ) | ||
|
|
|
|||
| Balance as of December 29, 2014 |
12,111 | |||
| Goodwill recognized during the year |
334,870 | |||
| Foreign currency translation adjustment |
9 | |||
|
|
|
|||
| Balance as of December 28, 2015 |
$ | 346,990 | ||
|
|
|
|||
Goodwill balances include foreign currency translation adjustments related to foreign subsidiaries with functional currencies other than the U.S. Dollar. All of the Companys goodwill is included as a component of the PCB reportable operating segment.
In the fourth quarter of 2015, the Company performed its annual impairment test qualitatively and concluded that it was more likely than not that there was no impairment to goodwill. The Company will continue to evaluate its goodwill on an annual basis during its fourth fiscal quarter and whenever events or changes in
88
Table of Contents
TTM TECHNOLOGIES, INC.
Notes to Consolidated Financial Statements (Continued)
circumstances such as significant adverse changes in business climate or operating results, changes in management strategy, coupled with a decline in the market price of our stock and market capitalization indicate that there may be a potential impairment. If factors indicate that assets are impaired, we would be required to reduce the carrying value of our goodwill and definite-lived intangible assets, which may result in an impairment charge.
| (7) | Definite-lived Intangibles |
As of December 28, 2015 and December 29, 2014, the components of definite-lived intangibles were as follows:
| Gross Amount |
Accumulated Amortization |
Foreign Currency Translation Adjustment |
Net Carrying Amount |
Weighted Average Amortization Period |
||||||||||||||||
| (In thousands) | (years) | |||||||||||||||||||
| December 28, 2015: |
||||||||||||||||||||
| Customer relationships |
$ | 91,492 | $ | (80,152 | ) | $ | 426 | $ | 11,766 | 9.2 | ||||||||||
| Trade name |
10,302 | (10,313 | ) | 11 | | 6.0 | ||||||||||||||
| Acquired intangibles from Viasystems acquisition |
||||||||||||||||||||
| Customer relationships |
147,500 | (10,815 | ) | | 136,685 | 8.1 | ||||||||||||||
| Technology |
3,000 | (577 | ) | | 2,423 | 3.0 | ||||||||||||||
|
|
|
|
|
|
|
|
|
|||||||||||||
| $ | 252,294 | $ | (101,857 | ) | $ | 437 | $ | 150,874 | ||||||||||||
|
|
|
|
|
|
|
|
|
|||||||||||||
| December 29, 2014: |
||||||||||||||||||||
| Customer relationships |
$ | 91,492 | $ | (74,486 | ) | $ | 445 | $ | 17,451 | 9.2 | ||||||||||
| Trade name |
10,302 | (8,520 | ) | 17 | 1,799 | 6.0 | ||||||||||||||
|
|
|
|
|
|
|
|
|
|||||||||||||
| $ | 101,794 | $ | (83,006 | ) | $ | 462 | $ | 19,250 | ||||||||||||
|
|
|
|
|
|
|
|
|
|||||||||||||
The December 28, 2015 and December 29, 2014 definite-lived intangible balances include foreign currency translation adjustments related to foreign subsidiaries with functional currencies other than the U.S. Dollar.
Definite-lived intangibles are generally amortized using the straight line method of amortization over the useful life, with the exception of certain customer relationship intangibles, which are amortized using an accelerated method of amortization based on estimated cash flows. Amortization expense was $18,888, $8,387, and $9,332 for the years ended December 28, 2015, December 29, 2014 and December 30, 2013, respectively.
Estimated aggregate amortization for definite-lived intangible assets for the next five years and thereafter is as follows:
| (In thousands) | ||||
| 2016 |
$ | 23,870 | ||
| 2017 |
23,647 | |||
| 2018 |
22,889 | |||
| 2019 |
18,746 | |||
| 2020 |
18,746 | |||
| Thereafter |
42,976 | |||
|
|
|
|||
| $ | 150,874 | |||
|
|
|
|||
89
Table of Contents
TTM TECHNOLOGIES, INC.
Notes to Consolidated Financial Statements (Continued)
| (8) | Long-term Debt and Letters of Credit |
The following table summarizes the long-term debt of the Company as of December 28, 2015 and December 29, 2014:
| Average Effective Interest Rate as of December 28, 2015 |
December 28, 2015 |
Average Effective Interest Rate as of December 29, 2014 |
December 29, 2014 |
|||||||||||||
| (In thousands) | ||||||||||||||||
| Term loan due May 2021 |
6.00 | % | $ | 947,625 | | | ||||||||||
| U.S. ABL revolving loan due May 2020 |
2.17 | % | 80,000 | | | |||||||||||
| Convertible Senior Notes due December 2020 |
1.75 | % | 250,000 | 1.75 | % | $ | 250,000 | |||||||||
| Convertible Senior Notes due May 2015 |
| | 3.25 | % | 32,395 | |||||||||||
| Term loan due September 2016 |
| | 2.55 | % | 273,800 | |||||||||||
| Other |
| | 6.00 | % | 4 | |||||||||||
|
|
|
|
|
|||||||||||||
| 1,277,625 | 556,199 | |||||||||||||||
| Less: Unamortized discount |
(75,668 | ) | (53,512 | ) | ||||||||||||
|
|
|
|
|
|||||||||||||
| 1,201,957 | 502,687 | |||||||||||||||
| Less: current maturities |
(157,375 | ) | (128,045 | ) | ||||||||||||
|
|
|
|
|
|||||||||||||
| Long-term debt, less current maturities |
$ | 1,044,582 | $ | 374,642 | ||||||||||||
|
|
|
|
|
|||||||||||||
The fiscal calendar maturities of long-term debt through 2020 and thereafter are as follows:
| (In thousands) | ||||
| 2016 |
$ | 157,375 | ||
| 2017 |
| |||
| 2018 |
27,125 | |||
| 2019 |
47,500 | |||
| 2020 |
297,500 | |||
| Thereafter |
748,125 | |||
|
|
|
|||
| $ | 1,277,625 | |||
|
|
|
|||
Term and Revolving Loans
On May 31, 2015, in conjunction with the acquisition of Viasystems, the Company entered into a $950,000 Term Loan Credit Agreement (Term Loan). Additionally, the Company entered into a $150,000 U.S. Asset-Based Lending Credit Agreement (U.S. ABL) and a $150,000 Asia Asset-Based Lending Credit agreement (Asia ABL) (collectively the ABL Revolving Loans). The Company drew $80,000 of the U.S. ABL at the closing of the acquisition of Viasystems.
The Term Loan was issued at a discount at 96.5% and bears interest at a floating rate of LIBOR, with a 1.0% LIBOR floor, plus an applicable interest margin of 5.0%, or JP Morgan Chase Banks prime rate, with a 2% floor, plus a margin of 4%, at the Companys option. At December 28, 2015, the weighted average interest rate on the outstanding borrowings under the Term Loan was 6.0%. There is no provision, other than an event of default, for the interest margin to increase. The Term Loan will mature on May 31, 2021. The Term Loan is
90
Table of Contents
TTM TECHNOLOGIES, INC.
Notes to Consolidated Financial Statements (Continued)
secured by a significant amount of the assets of the Company and its domestic subsidiaries and a pledge of 65% of voting stock of the Companys first tier foreign subsidiaries and is structurally senior to the Companys convertible senior notes. See Convertible Senior Notes below.
The U.S. ABL consists of three tranches comprised of a revolving credit facility of up to $150,000, a letter of credit facility of up to $75,000, and swingline loans of up to $30,000, provided that at no time may amounts outstanding under the tranches exceed in aggregate $150,000 or the applicable borrowing base, which is a percentage of the principal amount of Eligible Accounts, as defined in the U.S. ABL agreement. Borrowings under the U.S. ABL bear interest at either a floating rate of LIBOR plus a margin of 175 basis points or JP Morgan Chase Banks prime rate plus a margin of 75 basis points, at the Companys option. At December 28, 2015, the weighted average interest rate on the outstanding borrowings under the U.S. ABL was 2.17%. Beginning in 2016, the applicable margin can vary based on the remaining availability of the facility, from 150 to 200 basis points for LIBOR-based loans and from 50 to 100 basis points for JP Morgan Chase Banks prime rate-based loans. Other than availability and an event of default, there are no other provisions for the interest margin to increase. The U.S. ABL will mature on May 31, 2020. Loans made under the U.S. ABL are secured first by all of the Companys domestic cash, receivables and inventories as well as by a second position against a significant amount of the assets of the Company and its domestic subsidiaries and a pledge of 65% of voting stock of the Companys first tier foreign subsidiaries and are structurally senior to the Companys convertible senior notes. See Convertible Senior Notes below. At December 28, 2015, $80,000 of the U.S. ABL was outstanding and classified as short-term debt.
The Company and its domestic subsidiaries have fully and unconditionally guaranteed the full and timely payment of all Term Loan and U.S. ABL related obligations.
The Asia ABL consists of two tranches comprised of a revolving credit facility of up to $150,000 and a letter of credit facility of up to $100,000, provided that at no time may amounts outstanding under both tranches exceed in aggregate $150,000 or the applicable borrowing base, which is a percentage of the principal amount of Eligible Accounts, as defined in the Asia ABL agreement. Borrowings under the Asia ABL bear interest at a floating rate of LIBOR plus 175 basis points. There is no provision, other than an event of default, for the interest margin to increase. The Asia ABL will mature on May 22, 2020. Loans made under the Asia ABL are secured by a portion of the Companys Asia Pacific cash and receivables and are structurally senior to the Companys domestic obligations, including the convertible senior notes. See Convertible Senior Notes below. The Companys Asia Pacific subsidiary and certain of its subsidiaries have fully and unconditionally guaranteed the full and timely payment of all Asia ABL related obligations. At December 28, 2015, none of the Asia ABL was outstanding.
The Company is required to make scheduled payments of the outstanding Term Loan balance on a quarterly basis beginning October 1, 2015. On October 1, 2015, the first scheduled principal payment of $2,375 was made. Based on certain parameters defined in the Term Loan agreement, the Company may be required to make an additional principal payment on an annual basis. For 2015, the Company is required to make an additional annual payment of $61,107, which is required to be paid in March 2016. In addition to the $61,107 additional annual payment, the Company also intends to repay an additional $10,000 to $20,000 of the Term Loan in March 2016. As a result of the Companys intentions and considering the already scheduled January 2016 payment, $77,375 has been classified as short-term debt. This additional annual payment reduces future required quarterly scheduled payments. Any other outstanding balances under the Term Loan are due at the maturity date of May 31, 2021. Borrowings under the Term Loan are subject to various financial and operating covenants including maintaining a maximum total leverage ratio. Under the occurrence of certain events, the U.S. ABL and the Asia ABL are subject to various financial and operational covenants, including maintaining minimum fixed charge coverage ratios. At December 28, 2015, the Company was in compliance with the covenants under the Term Loan, the U.S. ABL and the Asia ABL.
As of December 28, 2015, remaining unamortized debt discount and debt issuance costs were $30,242 and $30,921, respectively. The debt discount is recorded as a reduction of the Term Loan and is amortized over the
91
Table of Contents
TTM TECHNOLOGIES, INC.
Notes to Consolidated Financial Statements (Continued)
duration of the Term Loan. The debt issuance costs are included in other non-current assets and are amortized to interest expense over the duration of the Term Loan and ABL Revolving Loans. The debt discount and the debt issuance costs related to the Term Loan are amortized into interest expense using an effective interest rate of 7.50%. The debt issuance costs related to the ABL Revolving Loans are amortized into interest expense using the straight line method of amortization over the duration of the ABL Revolving Loans. At December 28, 2015, the remaining amortization period for the unamortized debt discount and debt issuance costs was 5.4 years.
The Company is required to pay a commitment fee of 0.375% per annum on any unused portion of the U.S. ABL or Asia ABL. The U.S. ABL commitment fee may vary from 0.25% to 0.375% based on utilization levels. Additionally, the Company also paid commitment fees of 0.5% per annum on the unused portion of the $90,000 senior secured revolving loan associated with the terminated 2012 credit agreement for the years ended December 28, 2015, December 29, 2014 and December 30, 2013. The Company incurred total commitment fees related to unused borrowing availability of $763, $600, and $442 for the years ended December 28, 2015, December 29, 2014 and December 30, 2013, respectively. As of December 28, 2015, the outstanding amount of the Term Loan was $947,625, of which $77,375 the Company expects to repay within one year and is included as short-term debt, with the remaining $870,250 included as long-term debt. Additionally, $80,000 of the U.S. ABL and none of the Asia ABL was outstanding as of December 28, 2015. Available borrowing capacity under the U.S. ABL and Asia ABL was $65,444 and $142,018, which considers letters of credit outstanding of $4,556 and $7,982 mentioned below, respectively, at December 28, 2015.
Convertible Senior Notes
Convertible Senior Notes due 2020
The Company issued 1.75% convertible senior notes due December 15, 2020, in a public offering for an aggregate principal amount of $250,000 in 2013. The convertible senior notes bear interest at a rate of 1.75% per annum. Interest is payable semiannually in arrears on June 15 and December 15 of each year. The convertible senior notes are senior unsecured obligations and rank equally to the Companys future unsecured senior indebtedness and are senior in right of payment to any of the Companys future subordinated indebtedness.
Conversion: At any time prior to March 15, 2020, holders may convert their convertible senior notes into cash and, if applicable, into shares of the Companys common stock based on a conversion rate of 103.7613 shares of the Companys common stock per $1 principal amount of convertible senior notes, subject to adjustment, under the following circumstances: (1) during any calendar quarter beginning after March 31, 2014 (and only during such calendar quarter), if the last reported sale price of our common stock for at least 20 trading days during the 30 consecutive trading days ending on the last trading day of the immediately preceding calendar quarter is greater than or equal to 130% of the applicable conversion price on each applicable trading day of such preceding calendar quarter; (2) during the five business day period after any 10 consecutive trading day period in which the trading price per note for each day of that 10 consecutive trading day period was less than 98% of the product of the last reported sale price of the Companys common stock and the conversion rate on such day; or (3) upon the occurrence of specified corporate transactions described in the indenture governing the notes. As of December 28, 2015, none of the conversion criteria had been met.
On or after March 15, 2020 until the close of business on the third scheduled trading day preceding the maturity date, holders may convert their notes at any time, regardless of the foregoing circumstances. Upon conversion, for each $1 principal amount of notes, the Company will pay shares of our common stock, cash or a combination of cash and shares of our common stock at its election, if applicable, based on a daily conversion value calculated on a proportionate basis for each day of the 80 trading day observation period. All conversions occurring on the same date or on or after March 15, 2020 shall be settled using the same settlement method. Additionally, in the event of a fundamental change as defined in the indenture governing the notes, or other conversion rate adjustments such as share splits or combinations, other distributions of shares, cash or other
92
Table of Contents
TTM TECHNOLOGIES, INC.
Notes to Consolidated Financial Statements (Continued)
assets to stockholders, including self-tender transactions (Other Conversion Rate Adjustments), the conversion rate may be modified to adjust the number of shares per $1 principal amount of the notes. As of December 28, 2015, none of the criteria for a fundamental change or a conversion rate adjustment had been met.
The maximum number of shares issuable upon conversion, including the effect of a fundamental change and subject to Other Conversion Rate Adjustments, would be 32,425.
Note Repurchase: The Company is not permitted to redeem the convertible senior notes at any time prior to maturity. In the event of a fundamental change or certain default events, as defined in the indenture governing the notes, holders may require the Company to repurchase for cash all or a portion of their convertible senior notes at a price equal to 100% of the principal amount, plus any accrued and unpaid interest.
Convertible Note Hedge and Warrant Transaction: In connection with the issuance of the convertible senior notes due 2020, the Company entered into a convertible note hedge and warrant transaction (Call Spread Transaction), with respect to the Companys common stock. The convertible note hedge consists of the Companys option to purchase up to 25,940 common stock shares at a price of $9.64 per share. The hedge expires on December 15, 2020 and can only be executed upon the conversion of the above mentioned convertible senior notes due 2020. Additionally, the Company sold warrants to purchase 25,940 shares of its common stock at a price of $14.26 per share. The warrants expire ratably from March 2021 through January 2022. The 2020 Call Spread Transaction has no effect on the terms of the convertible senior notes due 2020 and reduces potential dilution by effectively increasing the conversion price of the convertible senior notes due 2020 to $14.26 per share of the Companys common stock.
Convertible Senior Notes due 2015
The Company issued 3.25% convertible senior notes due on May 15, 2015, in a public offering for an aggregate principal amount of $175,000. During the year ended, 2015, the outstanding principal of $32,395 plus accrued interest was paid in full.
As of December 28, 2015 and December 29, 2014, the following summarizes the equity components of the convertible senior notes:
| As of December 28, 2015 | As of December 29, 2014 | |||||||||||||||||||||||
| Embedded conversion option Convertible Senior Notes |
Embedded conversion option Convertible Senior Notes Issuance Costs |
Total | Embedded conversion option Convertible Senior Notes |
Embedded conversion option Convertible Senior Notes Issuance Costs |
Total | |||||||||||||||||||
| (in thousands) | ||||||||||||||||||||||||
| Equity components: |
||||||||||||||||||||||||
| Additional paid-in capital: |
||||||||||||||||||||||||
| Convertible senior notes due 2020 |
$ | 60,227 | $ | (1,916 | ) | $ | 58,311 | $ | 60,227 | $ | (1,916 | ) | $ | 58,311 | ||||||||||
| Convertible senior notes due 2015 |
| | | 39,781 | (1,413 | ) | 38,368 | |||||||||||||||||
|
|
|
|
|
|
|
|
|
|
|
|
|
|||||||||||||
| Total |
$ | 60,227 | $ | (1,916 | ) | $ | 58,311 | $ | 100,008 | $ | (3,329 | ) | $ | 96,679 | ||||||||||
|
|
|
|
|
|
|
|
|
|
|
|
|
|||||||||||||
93
Table of Contents
TTM TECHNOLOGIES, INC.
Notes to Consolidated Financial Statements (Continued)
The components of interest expense resulting from the convertible senior notes for the years ended December 28, 2015, December 29, 2014 and December 30, 2013 were as follows:
| For the Year Ended | ||||||||||||
| December 28, 2015 |
December 29 2014 |
December 30, 2013 |
||||||||||
| (In thousands) | ||||||||||||
| Contractual coupon interest |
||||||||||||
| Convertible Senior Notes due 2020 |
$ | 4,375 | $ | 4,367 | $ | 107 | ||||||
| Convertible Senior Notes due 2015 |
395 | 1,053 | 5,559 | |||||||||
|
|
|
|
|
|
|
|||||||
| $ | 4,770 | $ | 5,420 | $ | 5,666 | |||||||
|
|
|
|
|
|
|
|||||||
| Amortization of debt discount |
||||||||||||
| Convertible Senior Notes due 2020 |
$ | 7,532 | $ | 7,102 | $ | 167 | ||||||
| Convertible Senior Notes due 2015 |
554 | 1,395 | 6,780 | |||||||||
|
|
|
|
|
|
|
|||||||
| $ | 8,086 | $ | 8,497 | $ | 6,947 | |||||||
|
|
|
|
|
|
|
|||||||
| Amortization of debt issuance costs |
||||||||||||
| Convertible Senior Notes due 2020 |
$ | 755 | $ | 712 | $ | 16 | ||||||
| Convertible Senior Notes due 2015 |
56 | 141 | 684 | |||||||||
|
|
|
|
|
|
|
|||||||
| $ | 811 | $ | 853 | $ | 700 | |||||||
|
|
|
|
|
|
|
|||||||
As of December 28, 2015 and December 29, 2014, remaining unamortized debt issuance costs included in other non-current assets were $4,552 and $5,363, respectively. The debt issuance costs and debt discount are being amortized to interest expense over the term of the convertible senior notes using the effective interest rate method. At December 28, 2015, the remaining weighted average amortization period for the unamortized senior convertible note discount and debt issuance costs was 5.0 years.
For the years ended December 28, 2015, December 29, 2014 and December 30, 2013, the amortization of the convertible senior notes due 2015 debt discount and debt issuance costs is based on an effective interest rate of 8.37%. For the years ended December 28, 2015, December 29, 2014 and December 30, 2013, the amortization of the convertible senior notes due 2020 debt discount and debt issuance costs is based on an effective interest rate of 6.48%.
Loss on Extinguishment of Debt
The Company became a party to its current Term Loan and ABL Revolving Loans during the year ended 2015 in order to refinance and pay in full the remaining outstanding amount of $225,700 under an existing 2012 credit agreement, as well as to finance the acquisition of Viasystems and refinance Viasystems outstanding debt. As a result, the Company recognized losses of approximately $802 during the year ended December 28, 2015 resulting from the write off of the remaining unamortized debt issuance costs associated with the terminated 2012 credit agreement.
Additionally, in January 2014 and in December 2013, the Company repurchased $6,541 and $136,091, respectively, of its convertible senior notes due 2015 both at approximately 103.4% of their principal amounts. The repurchases were accounted for as extinguishments of debt and, accordingly, the Company recognized losses of approximately $506 for the year ended December 29, 2014 and $10,743 for the year ended December 30, 2013, primarily associated with the premium paid to repurchase the convertible senior notes and the recognition of related unamortized debt discount and issuance costs.
94
Table of Contents
TTM TECHNOLOGIES, INC.
Notes to Consolidated Financial Statements (Continued)
Letters of Credit
The Company has up to $75,000 and $100,000 Letters of Credit Facilities under the U.S. ABL and the Asia ABL, respectively, as mentioned above. As of December 28, 2015, letters of credit in the amount of $4,556 were outstanding under the U.S. ABL and $7,982 were outstanding under the Asia ABL. The Company has other standby letters of credit outstanding in the amount of $2,894 which expire by April 2016. These other standby letters of credit are securitized by cash collateral. As such, the Company has recorded such cash as restricted on the consolidated balance sheet as of December 28, 2015. There were no such arrangements at December 29, 2014.
Other Credit Facility
Additionally, the Company is party to a revolving loan credit facility (Chinese Revolver) with a lender in China. Under this arrangement, the lender has made available to the Company approximately $35,500 in unsecured borrowing with all terms of the borrowing to be negotiated at the time the Chinese Revolver is drawn upon. There are no commitment fees on the unused portion of the Chinese Revolver, and this arrangement expires in December 2016. As of December 28, 2015, the Chinese Revolver had not been drawn upon.
| (9) | Income Taxes |
The components of income (loss) before income taxes for the years ended December 28, 2015, December 29, 2014 and December 30, 2013 are:
| For the Year Ended | ||||||||||||
| December 28, 2015 |
December 29, 2014 |
December 30, 2013 |
||||||||||
| (In thousands) | ||||||||||||
| United States |
$ | (104,068 | ) | $ | (3,201 | ) | $ | (2,247 | ) | |||
| Foreign |
113,044 | 25,492 | 42,019 | |||||||||
|
|
|
|
|
|
|
|||||||
| Income before income taxes |
$ | 8,976 | $ | 22,291 | $ | 39,772 | ||||||
|
|
|
|
|
|
|
|||||||
The Company expects its foreign earnings attributable to all foreign subsidiaries will be indefinitely reinvested in such foreign jurisdictions and, therefore, no deferred tax liabilities for U.S. income taxes on undistributed earnings are recorded. The undistributed earnings of the foreign subsidiaries amounted to approximately $620,339 as of December 28, 2015. The determination of unrecognized deferred tax liability related to these undistributed earnings is not practicable. Foreign earnings attributable to certain manufacturing subsidiaries within China may be repatriated to the parent holding company located in Hong Kong, and therefore, a deferred tax liability of approximately $4,740 for the foreign tax impacts has been recorded on the undistributed earnings of these subsidiaries.
After the acquisition of Viasystems, the Company determined it will indefinitely reinvest the undistributed earnings from the backplane assembly facility in Shanghai, China. As such, the previously recognized deferred tax liability of $8,281 for U.S. income taxes on these undistributed earnings was reversed as income tax benefit in 2015.
95
Table of Contents
TTM TECHNOLOGIES, INC.
Notes to Consolidated Financial Statements (Continued)
The components of income tax provision for the years ended December 28, 2015, December 29, 2014 and December 30, 2013 are:
| For the Year Ended | ||||||||||||
| December 28, 2015 |
December 29, 2014 |
December 30, 2013 |
||||||||||
| (In thousands) | ||||||||||||
| Current (provision) benefit: |
||||||||||||
| Federal |
$ | 477 | $ | 1,717 | $ | 6,684 | ||||||
| State |
(345 | ) | (216 | ) | 643 | |||||||
| Foreign |
(19,379 | ) | (5,385 | ) | (14,466 | ) | ||||||
|
|
|
|
|
|
|
|||||||
| Total current |
(19,247 | ) | (3,884 | ) | (7,139 | ) | ||||||
|
|
|
|
|
|
|
|||||||
| Deferred (provision) benefit: |
||||||||||||
| Federal |
(10,084 | ) | (829 | ) | (5,038 | ) | ||||||
| State |
(2,184 | ) | 133 | (5,337 | ) | |||||||
| Foreign |
(3,079 | ) | (3,018 | ) | 1,635 | |||||||
|
|
|
|
|
|
|
|||||||
| Total deferred |
(15,347 | ) | (3,714 | ) | (8,740 | ) | ||||||
|
|
|
|
|
|
|
|||||||
| Total provision |
$ | (34,594 | ) | $ | (7,598 | ) | $ | (15,879 | ) | |||
|
|
|
|
|
|
|
|||||||
The following is a reconciliation of the (provision) benefit for income taxes at the statutory federal income tax rate compared to the Companys provision for income taxes for the years ended December 28, 2015, December 29, 2014 and December 30, 2013:
| For the Year Ended | ||||||||||||
| December 28, 2015 |
December 29, 2014 |
December 30, 2013 |
||||||||||
| Statutory federal income tax |
$ | (3,052 | ) | $ | (7,579 | ) | $ | (13,523 | ) | |||
| State income taxes, net of federal benefit and state tax credits |
(345 | ) | (84 | ) | 890 | |||||||
| Foreign deemed dividends |
(5,691 | ) | | | ||||||||
| Acquisition related expenses |
(7,692 | ) | | | ||||||||
| Intercompany profit in inventory elimination |
596 | | | |||||||||
| Permanently reinvested earnings assertion |
8,281 | | | |||||||||
| Foreign tax differential on foreign earnings |
15,543 | (6,243 | ) | (3,759 | ) | |||||||
| Change in valuation allowance |
(39,148 | ) | 5,321 | (2,370 | ) | |||||||
| Uncertain tax positions |
(3,911 | ) | | | ||||||||
| Federal research and development credits |
1,270 | 1,020 | 1,044 | |||||||||
| Loss on extinguishment of debt |
| | 2,393 | |||||||||
| Other |
(445 | ) | (33 | ) | (554 | ) | ||||||
|
|
|
|
|
|
|
|||||||
| Total provision for income taxes |
$ | (34,594 | ) | $ | (7,598 | ) | $ | (15,879 | ) | |||
|
|
|
|
|
|
|
|||||||
96
Table of Contents
TTM TECHNOLOGIES, INC.
Notes to Consolidated Financial Statements (Continued)
Deferred income taxes reflect the net tax effects of temporary differences between the carrying amounts of assets and liabilities for financial reporting purposes and the amounts used for income tax purposes. The significant components of the net deferred income tax assets as of December 28, 2015 and December 29, 2014 are as follows:
| As of | ||||||||
| December 28, 2015 |
December 29, 2014 |
|||||||
| (In thousands) | ||||||||
| Deferred income tax assets: |
||||||||
| Net operating loss carryforwards |
$ | 223,456 | $ | 26,644 | ||||
| Goodwill and intangible amortization |
| 11,071 | ||||||
| Reserves and accruals |
36,137 | 11,415 | ||||||
| Tax credit carryforwards |
19,719 | 6,101 | ||||||
| Stock-based compensation |
4,609 | 3,624 | ||||||
| Original issue discount on convertible senior notes |
18,876 | 22,029 | ||||||
| Property, plant and equipment |
12,945 | 16,375 | ||||||
| Other deferred income tax assets |
3,172 | 3,804 | ||||||
|
|
|
|
|
|||||
| 318,914 | 101,063 | |||||||
| Less: valuation allowance |
(234,192 | ) | (38,839 | ) | ||||
|
|
|
|
|
|||||
| 84,722 | 62,224 | |||||||
| Deferred income tax liabilities: |
||||||||
| Discount on convertible senior notes |
(16,495 | ) | (19,315 | ) | ||||
| Unrealized gain on currency translation |
| (2,979 | ) | |||||
| Repatriation of foreign earnings |
(4,776 | ) | (8,823 | ) | ||||
| Property, plant and equipment basis differences |
(34,716 | ) | (28,194 | ) | ||||
| Goodwill and intangible amortization |
(41,790 | ) | | |||||
| Other deferred income tax assets |
(93 | ) | | |||||
|
|
|
|
|
|||||
| Net deferred income tax (liabilities) assets |
$ | (13,148 | ) | $ | 2,913 | |||
|
|
|
|
|
|||||
| Deferred income tax assets (liabilities), net: |
||||||||
| Current deferred income taxes |
$ | | $ | 10,147 | ||||
| Noncurrent deferred income taxes |
(13,148 | ) | (7,234 | ) | ||||
As of December 28, 2015, the Company had the following net operating loss (NOL) carryforwards: $478,916 in the U.S. for federal, $589,468 in various U.S. states, $50,492 in China, $36,606 in Hong Kong and $345 in the Netherlands. The U.S. federal NOLs expire in 2021 through 2035, the various U.S. states NOLs expire in 2016 through 2035, the China NOLs expire in 2016 through 2020 and the Netherlands NOLs expire in 2017. Further, the Companys tax credits were approximately $22,696 of which $9,210 carryforward indefinitely.
In connection with the Companys acquisition of Viasystems, there was more than a 50% change in ownership under Section 382 of the Internal Revenue Code of 1986, as amended, and regulations issued there under. As a consequence, the utilization of the acquired Viasystems U.S. NOLs is limited to approximately $9,400 per year. In addition, the Company recognizes certain gains built in at the time of the ownership change, which increase the limitation by approximately $48,500 for each of the first 5 years after the acquisition. Any unused limitation in a year can be carried over to succeeding years.
97
Table of Contents
TTM TECHNOLOGIES, INC.
Notes to Consolidated Financial Statements (Continued)
A valuation allowance is provided when it is more likely than not that all or some portion of the deferred income tax assets will not be realized. Before the acquisition of Viasystems, the Company had net U.S. deferred tax assets. Upon acquisition, the Company now has recorded an income tax expense of $19,593 to establish a full valuation allowance on all of its deferred tax assets such as its NOL and tax credits in the United States. Certain subsidiaries within China continue to have net operating loss carryforwards in various tax jurisdictions that the Company has determined are not more likely than not to be utilized. Based on historical performance and future expectations of these subsidiaries, the Company does not anticipate sufficient taxable income to utilize these net operating loss carryforwards. As a result, a full valuation allowance has been recorded for these subsidiaries at December 28, 2015. For the remaining net deferred income tax asset, management has determined that it is more likely than not that the results of future operations will generate sufficient taxable income to realize the net deferred tax asset.
The following summarizes the activity in the Companys valuation allowance for the years ended December 28, 2015, December 29, 2014 and December 30, 2013:
| For the Year Ended | ||||||||||||
| December 28, 2015 |
December 29, 2014 |
December 30, 2013 |
||||||||||
| (In thousands) | ||||||||||||
| Balance at beginning of year |
$ | 38,839 | $ | 44,160 | $ | 41,790 | ||||||
| Additions related to acquisition |
177,699 | | | |||||||||
| Additions charged to expense |
39,149 | 6,458 | 6,763 | |||||||||
| Reduction related to sale of foreign subsidiary |
(21,495 | ) | | | ||||||||
| Deductions |
| (11,779 | ) | (4,393 | ) | |||||||
|
|
|
|
|
|
|
|||||||
| Balance at end of year |
$ | 234,192 | $ | 38,839 | $ | 44,160 | ||||||
|
|
|
|
|
|
|
|||||||
Certain entities within China operated under the high technology enterprise (HNTE) status and tax holidays, which were effective for the years ended December 28, 2015, December 29, 2014 and December 30, 2013. The HNTE and tax holidays decreased Chinese taxes by $7,600, $1,877 and $3,187, which (decreased) increased both basic and dilutive (loss) earnings per share by $(0.08), $0.02 and $0.04, for the years ended December 28, 2015, December 29, 2014 and December 30, 2013, respectively. HTNE status and tax holidays expire at various dates through 2017 and the Company expects to continue to file for renewal of such HNTE status and tax holidays for the foreseeable future.
A reconciliation of the beginning and ending amount of unrecognized tax benefits, exclusive of accrued interest and penalties, is as follows:
| For the Year Ended | ||||||||||||
| December 28, 2015 |
December 29, 2014 |
December 30, 2013 |
||||||||||
| (In thousands) | ||||||||||||
| Beginning balance |
$ | 2,441 | $ | 2,298 | $ | 2,424 | ||||||
| Additions related to acquisition |
11,293 | | | |||||||||
| Additions based on tax positions related to the current year |
3,349 | 220 | 322 | |||||||||
| Additions for tax positions of prior years |
14 | 286 | | |||||||||
| Reductions for tax positions of prior years |
(1,371 | ) | | (448 | ) | |||||||
| Lapse of statute |
(322 | ) | (363 | ) | | |||||||
|
|
|
|
|
|
|
|||||||
| Ending balance |
$ | 15,404 | $ | 2,441 | $ | 2,298 | ||||||
|
|
|
|
|
|
|
|||||||
98
Table of Contents
TTM TECHNOLOGIES, INC.
Notes to Consolidated Financial Statements (Continued)
As of December 28, 2015 and December 29, 2014, the Company recorded unrecognized tax benefits of $10,649 and $31, respectively, as well as interest and penalties of $12,202 and $22, respectively, to other long-term liabilities. The Company has also recorded unrecognized tax benefits of $4,755 and $1,385 against certain deferred tax assets as of December 28, 2015 and December 29 2014, respectively. The amount of unrecognized tax benefits that would, if recognized, reduce the Companys effective income tax rate in any future periods is $22,851 including interest and penalties. The Company expects its unrecognized tax benefits to decrease by $2,595 along with related interest of $4,017 over the next 12 months due to expiring statutes.
As of December 28, 2015, the Company is subject to (i) U.S. federal income tax examination for tax years from 1998 to 2015, (ii) state and local income tax examination for tax years 2002 to 2015, and (iii) foreign income tax examinations generally for tax years from 2005 to 2015.
| (10) | Financial Instruments |
Derivatives
The Company enters into foreign currency forward contracts to mitigate the impact of changes in foreign currency exchange rates and to reduce the volatility of purchases of equipment generated in currencies other than the functional currencies. The Companys foreign subsidiaries may at times purchase forward exchange contracts to manage its foreign currency risks in relation to certain purchases of machinery denominated in foreign currencies other than the Companys foreign functional currency. The notional amount of the foreign exchange contracts as of December 28, 2015 and December 29, 2014 was approximately $1,614 and $29,142, respectively. The Company has designated certain of these foreign exchange contracts as cash flow hedges.
The fair values of derivative instruments in the consolidated balance sheets are as follows:
| Asset / (Liability) Fair Value as of |
||||||||||
| Balance Sheet Location |
December 28, 2015 |
December 29, 2014 |
||||||||
| (In thousands) | ||||||||||
| Cash flow derivative instruments designated as hedges: |
||||||||||
| Foreign exchange contracts |
Other accrued expenses | $ | | $ | (12 | ) | ||||
| Foreign exchange contracts |
Deposits and other non-current assets | | | |||||||
| Cash flow derivative instruments not designated as hedges: |
||||||||||
| Foreign exchange contracts |
Prepaid expenses and other current assets | 16 | | |||||||
| Foreign exchange contracts |
Other accrued expenses | (51 | ) | (5,050 | ) | |||||
|
|
|
|
|
|||||||
| $ | (35 | ) | $ | (5,062 | ) | |||||
|
|
|
|
|
|||||||
99
Table of Contents
TTM TECHNOLOGIES, INC.
Notes to Consolidated Financial Statements (Continued)
The following table provides information about the amounts recorded in accumulated other comprehensive income related to derivatives designated as cash flow hedges, as well as the amounts recorded in each caption in the consolidated statements of operations when derivative amounts are reclassified out of accumulated other comprehensive income for the years ended December 28, 2015, December 29, 2014 and December 30, 2013:
| For the Year Ended | ||||||||||||||||||||||||||||||||||||||
| December 28, 2015 | December 29, 2014 | December 30, 2013 | ||||||||||||||||||||||||||||||||||||
| Effective Portion |
Ineffective Portion |
Effective Portion |
Ineffective Portion |
Effective Portion |
Ineffective Portion |
|||||||||||||||||||||||||||||||||
| Financial Statement Caption |
Gain/(Loss) Recognized in Other Comprehensive Income |
Gain/(Loss) Reclassified into Income |
Gain/ (Loss) Recognized into Income |
Gain/(Loss) Recognized in Other Comprehensive Income |
Gain/(Loss) Reclassified into Income |
Gain/ (Loss) Recognized into Income |
Gain/(Loss) Recognized in Other Comprehensive Income |
Gain/(Loss) Reclassified into Income |
Gain/ (Loss) Recognized into Income |
|||||||||||||||||||||||||||||
| (In thousands) | ||||||||||||||||||||||||||||||||||||||
| Cash flow hedge: |
||||||||||||||||||||||||||||||||||||||
| Foreign currency forward |
Depreciation expense |
$ | (20 | ) | $ | (172 | ) | | $ | 43 | $ | (146 | ) | | $ | (1,726 | ) | $ | (128 | ) | | |||||||||||||||||
|
|
|
|
|
|
|
|
|
|
|
|
|
|
|
|
|
|
|
|||||||||||||||||||||
| $ | (20 | ) | $ | (172 | ) | | $ | 43 | $ | (146 | ) | | $ | (1,726 | ) | $ | (128 | ) | | |||||||||||||||||||
|
|
|
|
|
|
|
|
|
|
|
|
|
|
|
|
|
|
|
|||||||||||||||||||||
The following provides a summary of the activity associated with the designated cash flow hedges reflected in accumulated other comprehensive income for the years ended December 28, 2015, December 29, 2014 and December 30, 2013:
| For the Year Ended | ||||||||||||
| December 28, 2015 |
December 29, 2014 |
December 30, 2013 |
||||||||||
| (In thousands) | ||||||||||||
| Beginning balance, net of tax |
$ | (1,424 | ) | $ | (1,613 | ) | $ | (15 | ) | |||
| Changes in fair value gain (loss), net of tax |
(20 | ) | 43 | (1,726 | ) | |||||||
| Reclassification to earnings, net of tax |
172 | 146 | 128 | |||||||||
|
|
|
|
|
|
|
|||||||
| Ending balance, net of tax |
$ | (1,272 | ) | $ | (1,424 | ) | $ | (1,613 | ) | |||
|
|
|
|
|
|
|
|||||||
The Company expects that approximately $172 of the accumulated other comprehensive income will be reclassified into the statement of operations, net of tax, in the next 12 months.
The net gain (loss) recognized in other, net in the consolidated statements of operations on derivative instruments not designated as hedges is as follows for the years December 28, 2015, December 29, 2014 and December 30, 2013:
| For the Year Ended | ||||||||||||
| December 28, 2015 |
December 29, 2014 |
December 30, 2013 |
||||||||||
| (In thousands) | ||||||||||||
| Derivative instruments not designated as hedges: |
||||||||||||
| Foreign exchange contracts |
$ | (374 | ) | $ | (3,579 | ) | $ | (2,381 | ) | |||
| Interest rate swap |
| | 620 | |||||||||
|
|
|
|
|
|
|
|||||||
| $ | (374 | ) | $ | (3,579 | ) | $ | (1,761 | ) | ||||
|
|
|
|
|
|
|
|||||||
The Company had entered into a two-year pay-fixed, receive floating (1-month LIBOR), amortizing interest rate swap arrangement with an initial notional amount of $146,500, which expired during the year ended December 30, 2013. For the year ended 2013, the Company did not designate this interest rate swap as a cash flow hedge as the borrowings attributable to this interest rate swap were paid in full. The change in the fair value of this interest rate swap during the year ended December 30, 2013 was recorded as other, net in the consolidated statement of operations.
100
Table of Contents
TTM TECHNOLOGIES, INC.
Notes to Consolidated Financial Statements (Continued)
| (11) | Accumulated Other Comprehensive Income |
The following provides a summary of the components of accumulated other comprehensive income, net of tax as of December 28, 2015, December 29, 2014 and December 30, 2013:
| Foreign Currency Translation |
Gains (Losses) on Cash Flow Hedges |
Unrealized Gains (Losses) on Available for Sale Securities |
Total | |||||||||||||
| (In thousands) | ||||||||||||||||
| Ending balance at December 30, 2013 |
$ | 47,280 | $ | (1,613 | ) | $ | (63 | ) | $ | 45,604 | ||||||
| Other comprehensive income (loss) before reclassifications |
(14,841 | ) | 43 | (20 | ) | (14,818 | ) | |||||||||
| Amounts reclassified from accumulated other comprehensive income |
| 146 | 83 | 229 | ||||||||||||
|
|
|
|
|
|
|
|
|
|||||||||
| Net year to date period other comprehensive income (loss) |
(14,841 | ) | 189 | 63 | (14,589 | ) | ||||||||||
|
|
|
|
|
|
|
|
|
|||||||||
| Ending balance at December 29, 2014 |
32,439 | (1,424 | ) | | 31,015 | |||||||||||
| Other comprehensive loss before reclassifications |
(27,758 | ) | (20 | ) | | (27,778 | ) | |||||||||
| Amounts reclassified from accumulated other comprehensive income |
(1,786 | ) | 172 | | (1,614 | ) | ||||||||||
|
|
|
|
|
|
|
|
|
|||||||||
| Net year to date period other comprehensive income (loss) |
(29,544 | ) | 152 | | (29,392 | ) | ||||||||||
|
|
|
|
|
|
|
|
|
|||||||||
| Ending balance at December 28, 2015 |
$ | 2,895 | $ | (1,272 | ) | $ | | $ | 1,623 | |||||||
|
|
|
|
|
|
|
|
|
|||||||||
The following provides a summary of reclassifications out of accumulated other comprehensive income, net of tax for the years ended December 28, 2015, December 29, 2014 and December 30, 2013:
| Amount Reclassified from Accumulated Other Comprehensive Income For the Year Ended |
||||||||||||||
| Details about Accumulated Other Components |
Statement of Operations Location |
December 28, 2015 |
December 29, 2014 |
December 30, 2013 |
||||||||||
| Loss on cash flow hedges |
Depreciation expense, net of tax | $ | 172 | $ | 146 | $ | 128 | |||||||
|
|
|
|
|
|
|
|||||||||
| Loss on available for sale securities |
Other, net, net of tax | $ | | $ | 83 | $ | 53 | |||||||
|
|
|
|
|
|
|
|||||||||
| Gain on foreign currency translation |
Gain on sale of assets, net of tax | $ | (1,786 | ) | $ | | $ | (14,266 | ) | |||||
|
|
|
|
|
|
|
|||||||||
| (12) | Significant Customers and Concentration of Credit Risk |
In the normal course of business, the Company extends credit to its customers, which are in diverse end markets. Many customers to which the Company extends credit are located outside the United States. The Company performs ongoing credit evaluations of customers, does not require collateral, and considers the credit risk profile of the entity from which the receivable is due in further evaluating collection risk.
101
Table of Contents
TTM TECHNOLOGIES, INC.
Notes to Consolidated Financial Statements (Continued)
The Companys customers include both OEMs and EMS companies. The Companys OEM customers often direct a significant portion of their purchases through EMS companies. While the Companys customers include both OEM and EMS providers, the Company measures customer concentration based on OEM companies, as they are the ultimate end customers.
For the years ended December 28, 2015, December 29, 2014 and December 30, 2013, one customer accounted for approximately 20%, 21% and 20%, respectively, of the Companys net sales. There were no other customers that accounted for 10% or more of net sales for the years ended December 28, 2015, December 29, 2014 and December 30, 2013.
| (13) | Fair Value Measures |
The Company measures at fair value its financial and non-financial assets by using a fair value hierarchy that prioritizes the inputs to valuation techniques used to measure fair value. Fair value is the price that would be received to sell an asset or paid to transfer a liability in an orderly transaction between market participants at the measurement date, essentially an exit price, based on the highest and best use of the asset or liability.
The carrying amount and estimated fair value of the Companys financial instruments as of December 28, 2015 and December 29, 2014 were as follows:
| As of | ||||||||||||||||
| December 28, 2015 | December 29, 2014 | |||||||||||||||
| Carrying Amount |
Fair Value | Carrying Amount |
Fair Value | |||||||||||||
| (In thousands) | ||||||||||||||||
| Derivative assets, current |
$ | 16 | $ | 16 | | | ||||||||||
| Derivative liabilities, current |
51 | 51 | $ | 5,062 | $ | 5,062 | ||||||||||
| Term and Revolving Loans |
997,383 | 935,000 | 273,804 | 273,820 | ||||||||||||
| Convertible Senior Notes due 2020 |
204,574 | 230,950 | 197,042 | 241,875 | ||||||||||||
| Convertible Senior Notes due 2015 |
| | 31,841 | 32,631 | ||||||||||||
The fair value of the derivative instruments was determined using pricing models developed based on the foreign currency exchange rates and other observable market data, including quoted market prices, as appropriate.
The fair value of the long-term debt was estimated based on quoted market prices or discounting the debt over its life using current market rates for similar debt as of December 28, 2015 and December 29, 2014, which are considered Level 1 and Level 2 inputs.
The fair value of the convertible senior notes was estimated based on quoted market prices of the securities on an active exchange, which are considered Level 1 and Level 2 inputs.
As of December 28, 2015 and December 29, 2014, the Companys other financial instruments also included cash and cash equivalents, accounts receivable, accounts payable and equipment payables. Due to short-term maturities, the carrying amount of these instruments approximates fair value. Our cash and cash equivalents at December 28, 2015 consisted of $82,545 held in the U.S., with the remaining $176,555 held by foreign subsidiaries.
102
Table of Contents
TTM TECHNOLOGIES, INC.
Notes to Consolidated Financial Statements (Continued)
As of December 28, 2015 and December 29, 2014, the following financial assets and liabilities were measured at fair value on a recurring basis using the type of inputs shown:
| Fair Value Measurements Using: | ||||||||||||||||
| As of December 28, 2015 |
Level 1 Inputs | Level 2 Inputs | Level 3 Inputs | |||||||||||||
| (In thousands) | ||||||||||||||||
| Foreign exchange derivative liabilities |
$ | 51 | | $ | 51 | | ||||||||||
| Foreign exchange derivative assets |
16 | | 16 | | ||||||||||||
| Fair Value Measurements Using: | ||||||||||||||||
| As of December 29, 2014 |
Level 1 Inputs | Level 2 Inputs | Level 3 Inputs | |||||||||||||
| (In thousands) | ||||||||||||||||
| Money market funds |
$ | 129,012 | $ | 129,012 | | | ||||||||||
| Foreign exchange derivative liabilities |
5,062 | | $ | 5,062 | | |||||||||||
There were no transfers of financial assets or liabilities between Level 1 and Level 2 inputs for the years ended December 28, 2015 and December 29, 2014.
The majority of the Companys non-financial assets and liabilities, which include goodwill, intangible assets, inventories, and property, plant and equipment, are not required to be carried at fair value on a recurring basis. However, if certain triggering events occur (or are tested at least annually for goodwill) such that a non-financial instrument is required to be evaluated for impairment, based upon a comparison of the non-financial instruments fair value to its carrying value, an impairment is recorded to reduce the carrying value to the fair value, if the carrying value exceeds the fair value.
For the years ended December 29, 2014 and December 30, 2013, the following assets were measured at fair value on a nonrecurring basis using the type of inputs shown:
| Fair Value Measurements Using: | ||||||||||||||||||||
| December 29, 2014 |
Level 1 Inputs |
Level 2 Inputs |
Level 3 Inputs |
Total Losses for the Year Ended December 29, 2014 |
||||||||||||||||
| (In thousands) | ||||||||||||||||||||
| Assets held for sale |
$ | 21,031 | | $ | 21,031 | | $ | 1,845 | ||||||||||||
|
|
|
|||||||||||||||||||
| Fair Value Measurements Using: | ||||||||||||||||||||
| December 30, 2013 |
Level 1 Inputs |
Level 2 Inputs |
Level 3 Inputs |
Total Losses for the Year Ended December 30, 2013 |
||||||||||||||||
| (In thousands) | ||||||||||||||||||||
| Assets held for sale |
$ | 2,519 | | $ | 2,519 | | $ | 10,782 | ||||||||||||
|
|
|
|||||||||||||||||||
There was no impairment of long-lived assets recognized in the year ended December 28, 2015.
The fair values of assets held for sale were primarily determined using appraisals and comparable prices of similar assets, which are considered to be Level 2 inputs.
103
Table of Contents
TTM TECHNOLOGIES, INC.
Notes to Consolidated Financial Statements (Continued)
| (14) | Commitments and Contingencies |
Operating Leases
The Company leases some of its manufacturing and assembly plants, a sales office and equipment under noncancellable operating leases that expire at various dates through 2024. Certain real property leases contain renewal provisions at the Companys option. Most of the leases require the Company to pay for certain other costs such as property taxes and maintenance. Certain leases also contain rent escalation clauses (step rents) that require additional rental amounts in the later years of the term. Rent expense for leases with step rents is recognized on a straight-line basis over the minimum lease term.
The following is a schedule of future minimum lease payments as of December 28, 2015:
| Operating Leases | ||||
| (In thousands) | ||||
| 2016 |
$ | 8,332 | ||
| 2017 |
6,057 | |||
| 2018 |
2,762 | |||
| 2019 |
2,419 | |||
| 2020 |
1,630 | |||
| Thereafter |
6,403 | |||
|
|
|
|||
| Total minimum lease payments |
$ | 27,603 | ||
|
|
|
|||
Total rent expense for the years ended December 28, 2015, December 29, 2014, and December 30, 2013, was approximately $7,362, $3,731 and $3,364, respectively.
Legal Matters
The Company is subject to various legal matters, which it considers normal for its business activities. While the Company currently believes that the amount of any reasonably possible loss for known matters would not be material to the Companys financial condition, the outcome of these actions is inherently difficult to predict. In the event of an adverse outcome, the ultimate potential loss could have a material adverse effect on the Companys financial condition or results of operations in a particular period. The Company has accrued amounts for its loss contingencies which are probable and estimable as of December 28, 2015 and December 29, 2014. However, these amounts are not material to the consolidated financial statements of the Company.
Environmental Matters
The process to manufacture PCBs requires adherence to city, county, state, federal, and foreign environmental regulations regarding the storage, use, handling and disposal of chemicals, solid wastes and other hazardous materials, as well as compliance with air quality standards and chemical use reporting. The Company believes that its facilities in the United States, Canada and Mexico comply in all material respects with applicable environmental laws and regulations. In China, governmental authorities have adopted new rules and regulations governing environmental issues. An update to the Chinese environmental waste water law was issued in late 2012, allowing for an interim period in which plants subject to such law may install equipment that meets the new regulatory regime. Some of the Companys plants in China are not yet in full compliance with the updated environmental regulations. The Company believes it has developed plans acceptable to the Chinese government and is in the process of implementing these plans. The Company does not anticipate any immediate risk of government fines or temporary closure of its Chinese plants. The Company has established and enacted an investment plan related to the efforts to come into full compliance with the new regulations. The 2016 capital expenditure costs expected for these plans are included in the Companys capital expenditure projections.
104
Table of Contents
TTM TECHNOLOGIES, INC.
Notes to Consolidated Financial Statements (Continued)
| (15) | Stock-Based Compensation |
Incentive Compensation Plan
The Company maintains the 2014 Incentive Compensation Plan (the Plan), which allows for the issuance of up to 5,288 shares through its expiration date of February 2024.
The Plan provides for the grant of incentive stock options and nonqualified stock options to the Companys key employees, non-employee directors and consultants. Other types of awards such as performance-based restricted stock units (PRUs), restricted stock units (RSUs), and stock appreciation rights are also permitted. The exercise price for options and awards is determined by the compensation committee of the board of directors and, for options intended to qualify as incentive stock options, may not be less than the fair market value as determined by the closing stock price at the date of the grant. Each option and award shall vest and expire as determined by the compensation committee of the board of directors, with options, PRUs and RSUs generally vesting over three years for employees and one year for non-employee directors. Options, PRUs and RSUs do not have voting rights. Options expire no later than ten years from the grant date. All grants provide for accelerated vesting if there is a change in control, as defined in the Plan. Upon the exercise of outstanding stock options or vesting of RSUs and PRUs, the Companys practice is to issue new registered shares that are reserved for issuance under the Plan.
As of December 28, 2015, 572 PRUs, 2,294 RSUs and 420 stock options were outstanding under the Plan. Included in the 572 PRUs outstanding as of December 28, 2015 are 271 vested but not yet released. Included in the 2,294 RSUs outstanding as of December 28, 2015 are 319 vested but not yet released RSUs associated with non-employee directors. These RSUs vest over one year with release of the underlying shares of common stock deferred until retirement from the board of directors, (or until one year after retirement in the case of certain prior grants).
Performance-based Restricted Stock Units
The Company maintains a long-term incentive program for executives that provides for the issuance of PRUs, representing hypothetical shares of the Companys common stock that may be issued. Under the PRU program, a target number of PRUs is awarded at the beginning of each three-year performance period. The number of shares of common stock released at the end of the performance period may range from zero to 2.4 times the target number depending on performance during the period. The performance metrics of the PRU program are based on (a) annual financial targets, which are based on revenue and EBITDA (earnings before interest, tax, depreciation, and amortization expense), each equally weighted, and (b) an overall modifier based on the Companys total stockholder return (TSR) relative to a group of peer companies selected by the Companys compensation committee, over the three-year performance period.
Under the PRU program, financial goals are set at the beginning of each fiscal year and performance is reviewed at the end of that year. The percentage to be applied to each participants target award ranges from zero to 160% based upon the extent to which the annual financial performance goals are achieved. If specific performance threshold levels for the annual financial goals are met, the amount earned for that element will be applied to one-third of the participants PRU award to determine the number of units earned.
At the end of the three-year performance period, the total units earned, if any, are adjusted by applying a modifier, ranging from zero to 150% based on the Companys TSR based on stock price changes relative to a group of peer companies selected by the Companys compensation committee for the same three-year period.
The TSR modifier is intended to ensure that there are limited or no payouts under the PRU program if the Companys stock performance is significantly below the median TSR of a group of peer companies selected by the Companys compensation committee over the three-year performance period. Where the annual financial goals have been met and where there has been strong relative TSR performance over the three-year performance period, the PRU program may provide substantial rewards to participants with a maximum payout of 2.4 times the initial PRU award. However, even if all of the annual financial metric goals are achieved in each of the three
105
Table of Contents
TTM TECHNOLOGIES, INC.
Notes to Consolidated Financial Statements (Continued)
years, there will be no payouts if the Companys stock performance is below that of the 20th percentile of the group of peer companies selected by the Companys compensation committee, as appropriate.
Recipients of PRU awards generally must remain employed by the Company on a continuous basis through the end of the three-year performance period in order to receive any amount of the PRUs covered by that award. In events such as death, disability or retirement, the recipient may be entitled to pro-rata amounts of PRUs as defined in the Plan. Target shares subject to PRU awards do not have voting rights of common stock until earned and issued following the end of the three-year performance period.
The Company records stock-based compensation expense for PRU awards granted based on managements periodic assessment of the probability of the PRU awards vesting. As of December 28, 2015, management determined that vesting of the PRU awards was probable. PRU activity for the year ended December 28, 2015 was as follows:
| Shares | Weighted Average Fair Value |
|||||||
| (In thousands) | ||||||||
| Outstanding target shares at December 29, 2014 |
275 | $ | 8.03 | |||||
| Granted |
295 | 7.22 | ||||||
| Vested |
(271 | ) | 6.67 | |||||
| Change in units due to annual performance achievement |
72 | 7.22 | ||||||
| Forfeited / cancelled |
(70 | ) | 6.67 | |||||
|
|
|
|||||||
| Outstanding target shares at December 28, 2015 |
301 | $ | 8.58 | |||||
|
|
|
|
|
|||||
The fair value of PRUs granted is calculated using a Monte Carlo simulation model, as the TSR modifier contains a market condition. For the years ended December 28, 2015, December 29, 2014 and December 30, 2013, the following assumptions were used in determining the fair value:
| For the Year Ended | ||||||||||||
| December 28, 2015(1) |
December 29, 2014(2) |
December 30, 2013(3) |
||||||||||
| Weighted-average fair value |
$ | 7.22 | $ | 5.80 | $ | 6.79 | ||||||
| Risk-free interest rate |
0.5 | % | 0.4 | % | 0.3 | % | ||||||
| Dividend yield |
| | | |||||||||
| Expected volatility |
37 | % | 41 | % | 49 | % | ||||||
| Expected term in months |
22 | 23 | 25 | |||||||||
| (1) | Reflects the weighted-averages for the third year of the three-year performance period applicable to PRUs granted in 2013, the second year of the three-year performance period applicable to PRUs granted in 2014 and the first year of the three-year performance period applicable to PRUs granted in 2015. |
| (2) | Reflects the weighted-averages for the third year of the three-year performance period applicable to PRUs granted in 2012, second year of the three-year performance period applicable to PRUs granted in 2013 and for the first year of the three-year performance period applicable to PRUs granted in 2014. |
| (3) | Reflects the weighted-averages for the third year of the three-year performance period applicable to PRUs granted in 2011, second year of the three-year performance period applicable to PRUs granted in 2012 and for the first year of the three-year performance period applicable to PRUs granted in 2013. |
The expected term of the PRUs reflects the performance period for the PRUs granted. Expected volatility is calculated using the Companys historical stock price. The risk-free interest rate for the expected term of PRUs is based on the U.S Treasury yield curve in effect at the time of grant.
106
Table of Contents
TTM TECHNOLOGIES, INC.
Notes to Consolidated Financial Statements (Continued)
Restricted Stock Units
RSU activity for the year ended December 28, 2015 was as follows:
| Shares | Weighted Average Grant-Date Fair Value |
|||||||
| (In thousands) | ||||||||
| Non-vested RSUs outstanding at December 29, 2014 |
1,436 | $ | 8.54 | |||||
| Granted |
1,301 | 9.15 | ||||||
| Vested |
(711 | ) | 9.00 | |||||
| Forfeited |
(51 | ) | 8.65 | |||||
|
|
|
|||||||
| Non-vested RSUs outstanding at December 28, 2015 |
1,975 | $ | 8.77 | |||||
|
|
|
|
|
|||||
| Vested and expected to vest at December 28, 2015 |
2,204 | $ | 8.92 | |||||
|
|
|
|
|
|||||
The fair value of the Companys RSUs is determined based upon the closing common stock price on the grant date. The fair value per unit of RSUs granted was $9.15, $7.98 and $8.17 for the years ended December 28, 2015, December 29, 2014 and December 30, 2013, respectively. The total fair value of RSUs vested for the years ended December 28, 2015, December 29, 2014 and December 30, 2013 was $6,396, $7,195 and $7,878, respectively.
Stock Options
The Company did not grant any stock option awards during the years ended December 28, 2015, December 29, 2014 and December 30, 2013. Option activity under the Plan for the year ended December 28, 2015 was as follows:
| Options | Weighted- Average Exercise Price |
Weighted- Average Remaining Contractual Term |
Aggregate Intrinsic Value |
|||||||||||||
| (In thousands) | (In years) | (In thousands) | ||||||||||||||
| Outstanding at December 29, 2014 |
511 | $ | 11.54 | 2.3 | ||||||||||||
| Granted |
| | ||||||||||||||
| Exercised |
(68 | ) | 7.32 | |||||||||||||
| Forfeited/expired |
(23 | ) | 8.89 | |||||||||||||
|
|
|
|||||||||||||||
| Outstanding at December 28, 2015 |
420 | $ | 12.37 | 1.7 | $ | 4 | ||||||||||
|
|
|
|
|
|
|
|
|
|||||||||
| Vested and expected to vest at December 28, 2015 |
420 | $ | 12.37 | 1.7 | $ | 4 | ||||||||||
|
|
|
|
|
|
|
|
|
|||||||||
| Exercisable at December 28, 2015 |
420 | $ | 12.37 | 1.7 | $ | 4 | ||||||||||
|
|
|
|
|
|
|
|
|
|||||||||
The aggregate intrinsic values in the table above represent the total pretax intrinsic value (the difference between Companys closing stock price on the last trading day of the 2015 fiscal year and the exercise price, multiplied by the number of in-the-money options) that would have been received by the option holders had all option holders exercised their options on December 28, 2015. This amount changes based on the fair market value of the Companys stock. The total intrinsic value of options exercised for the years ended December 28, 2015 and December 30, 2013 was $131 and $117, respectively. There were no options exercised in December 29, 2014. The total fair value of the options vested for the years ended December 29, 2014 and December 30, 2013 was $110 and $143, respectively. There were no options vested in December 28, 2015.
107
Table of Contents
TTM TECHNOLOGIES, INC.
Notes to Consolidated Financial Statements (Continued)
Stock-based Compensation Expense and Unrecognized Compensation Costs
For the years ended December 28, 2015, December 29, 2014 and December 30, 2013, the amounts recognized in the consolidated financial statements with respect to the stock-based compensation plan are as follows:
| For the Year Ended | ||||||||||||
| December 28, 2015 |
December 29, 2014 |
December 30, 2013 |
||||||||||
| (In thousands) | ||||||||||||
| Cost of goods sold |
$ | 1,117 | $ | 866 | $ | 1,059 | ||||||
| Selling and marketing |
1,135 | 1,109 | 1,308 | |||||||||
| General and administrative |
7,409 | 5,825 | 6,618 | |||||||||
|
|
|
|
|
|
|
|||||||
| Stock-based compensation expense recognized |
9,661 | 7,800 | 8,985 | |||||||||
| Income tax benefit recognized |
| (2,018 | ) | (2,274 | ) | |||||||
|
|
|
|
|
|
|
|||||||
| Total stock-based compensation expense after income taxes |
$ | 9,661 | $ | 5,782 | $ | 6,711 | ||||||
|
|
|
|
|
|
|
|||||||
The Company may become entitled to a deduction in its tax returns upon the future exercise of incentive stock options under certain circumstances; however, the value of this deduction will be recorded as an increase to additional paid-in capital and not as an income tax benefit. For the years ended December 28, 2015, December 29, 2014 and December 30, 2013, a net tax shortfall of $247, $1,015 and $744, respectively, related to fully vested stock option awards exercised and vested RSUs was recorded as a decrease to additional paid-in capital. Additionally, for the year ended December 28, 2015, the Company did not record an income tax benefit as a result of a full valuation allowance on its deferred tax assets.
The following is a summary of total unrecognized compensation costs as of December 28, 2015:
| Unrecognized Stock-Based Compensation Cost |
Remaining Weighted Average Recognition Period |
|||||||
| (In thousands) | (In years) | |||||||
| PRU awards |
$ | 1,403 | 1.65 | |||||
| RSU awards |
10,159 | 1.40 | ||||||
|
|
|
|||||||
| $ | 11,562 | |||||||
|
|
|
|||||||
| (16) | Employee Benefit and Deferred Compensation Plans |
The Company has four separate retirement benefit plans: two in North America (one of which was acquired from Viasystems during 2015), and two in Asia Pacific. In North America, the Company has two 401(k) savings plans (the Savings Plans) in which eligible full-time domestic employees can participate and contribute a percentage of compensation subject to the maximum allowed by the Internal Revenue Service. The Savings Plans provides for a partial match by the employer of the first 5% of employee contributions (100% of the first 3% and 50% of the following 2% of employee contributions for one plan and 50% of the first 6% of employee contributions for plan acquired from Viasystems). In Asia Pacific, the Company contributes to either separate trust-administered funds or various government-sponsored pension plans on a mandatory basis. For all retirement plans, the Company has no further payment obligation once the required contributions have been made. The Company recorded contributions to retirement benefit plans of $35,427, $18,953 and $14,987 during the years ended December 28, 2015, December 29, 2014 and December 30, 2013, respectively.
The Company also maintains a deferred compensation plan (the Compensation Plan). The Compensation Plan is an unfunded, nonqualified deferred compensation plan and is limited to selected employees, including our
108
Table of Contents
TTM TECHNOLOGIES, INC.
Notes to Consolidated Financial Statements (Continued)
named executive officers and our directors. The Compensation Plan allows participants to defer up to 100% of their annual bonus and between 5% and 100% of their annual director fees. Amounts deferred under the Compensation Plan will be credited to accounts maintained by the Company for each participant and will be credited or debited with the participants proportionate share of any gains or losses attributable to the performance of investment options selected by the participant.
| (17) | Preferred Stock |
The board of directors has the authority, without action by stockholders, to designate and issue preferred stock in one or more series. The board of directors may also designate the rights, preferences and privileges of each series of preferred stock, any or all of which may be superior to the rights of the common stock. As of December 28, 2015, no shares of preferred stock were outstanding.
| (18) | Distribution of profits |
As stipulated by the relevant laws and regulations of China applicable to the Companys subsidiaries in China, each of such subsidiaries is required to make appropriations from its net income as determined in accordance with accounting principles and the relevant financial regulations of China (PRC GAAP) to a non-distributable reserve, also referred to as statutory surplus reserve. The appropriations to the statutory surplus reserve are required to be made at not less than 10% of the profit after tax as determined under PRC GAAP and are required until the balance reaches 50% of its registered capital. The statutory surplus reserve is used to offset future or past losses. These Chinese subsidiaries may, upon a resolution passed by their respective shareholders, convert the statutory surplus reserve into capital.
There were appropriations of approximately $4,576, $2,544 and $3,526 to the statutory surplus reserve of the Companys Chinese subsidiaries for the years ended December 28, 2015, December 29, 2014 and December 30, 2013, respectively.
| (19) | Segment Information |
The operating segments reported below are the Companys segments for which separate financial information is available and upon which operating results are evaluated by the chief operating decision maker to assess performance and to allocate resources. As a result of the May 31, 2015 acquisition of Viasystems and the ongoing integration activities, the Company has reassessed its reportable operating segments and determined that it has two reportable operating segments: PCB and E-M Solutions. This determination was made based on the criteria of earning revenues and incurring expenses, the Companys organizational structure which has segment managers who report to the chief operating decision maker and discrete financial information, and the aggregation of similar operating segments into reportable operating segments. Factors considered to determine whether operating segments can be aggregated into reportable segments included similarity regarding economic characteristics, products, production processes type or classes of customers, distribution methods and regulatory environments. All prior-period amounts have been adjusted retrospectively to reflect our reportable segment changes.
The Company evaluates segment performance based on operating segment income, which is operating income before amortization of intangibles. Interest expense and interest income are not presented by segment since they are not included in the measure of segment profitability reviewed by the chief operating decision maker. All inter-segment transactions have been eliminated.
109
Table of Contents
TTM TECHNOLOGIES, INC.
Notes to Consolidated Financial Statements (Continued)
The Company accounts for inter-segment sales and transfers consistent with the Companys revenue recognition policy. The inter-segment sales for the year ended December 28, 2015 are sales primarily from the PCB to the E-M Solutions operating segment.
| For the Year Ended | ||||||||||||
| December 28, 2015 |
December 29, 2014 |
December 30, 2013 |
||||||||||
| (In thousands) | ||||||||||||
| Net Sales: |
||||||||||||
| PCB |
$ | 1,944,041 | $ | 1,251,665 | $ | 1,305,862 | ||||||
| E-M Solutions |
158,655 | 76,545 | 65,202 | |||||||||
|
|
|
|
|
|
|
|||||||
| Total sales |
2,102,696 | 1,328,210 | 1,371,064 | |||||||||
| Inter-segment sales |
(7,208 | ) | (2,493 | ) | (2,849 | ) | ||||||
|
|
|
|
|
|
|
|||||||
| Total net sales |
$ | 2,095,488 | $ | 1,325,717 | $ | 1,368,215 | ||||||
|
|
|
|
|
|
|
|||||||
| Operating Segment Income (Loss): |
||||||||||||
| PCB |
$ | 172,227 | $ | 77,092 | $ | 101,048 | ||||||
| E-M Solutions |
1,424 | 3,855 | 1,917 | |||||||||
| Corporate |
(93,421 | ) | (26,021 | ) | (24,505 | ) | ||||||
|
|
|
|
|
|
|
|||||||
| Total operating segment income |
80,230 | 54,926 | 78,460 | |||||||||
| Amortization of definite-lived intangibles |
(18,888 | ) | (8,387 | ) | (9,332 | ) | ||||||
|
|
|
|
|
|
|
|||||||
| Total operating income |
61,342 | 46,539 | 69,128 | |||||||||
| Total other expense |
(52,366 | ) | (24,248 | ) | (29,356 | ) | ||||||
|
|
|
|
|
|
|
|||||||
| Income before income taxes |
$ | 8,976 | $ | 22,291 | $ | 39,772 | ||||||
|
|
|
|
|
|
|
|||||||
| For the Year Ended | ||||||||||||
| December 28, 2015 |
December 29, 2014 |
December 30, 2013 |
||||||||||
| (In thousands) | ||||||||||||
| Depreciation Expense: |
||||||||||||
| PCB |
$ | 130,339 | $ | 95,027 | $ | 91,759 | ||||||
| E-M Solutions |
2,079 | 183 | 248 | |||||||||
| Corporate |
1,090 | 139 | 113 | |||||||||
|
|
|
|
|
|
|
|||||||
| Total depreciation expense |
$ | 133,508 | $ | 95,349 | $ | 92,120 | ||||||
|
|
|
|
|
|
|
|||||||
| Capital Expenditures: |
||||||||||||
| PCB |
$ | 72,036 | $ | 73,779 | $ | 127,623 | ||||||
| E-M Solutions |
4,006 | 400 | 176 | |||||||||
| Corporate |
1,523 | 2,603 | 472 | |||||||||
|
|
|
|
|
|
|
|||||||
| Total capital expenditures |
$ | 77,565 | $ | 76,782 | $ | 128,271 | ||||||
|
|
|
|
|
|
|
|||||||
110
Table of Contents
TTM TECHNOLOGIES, INC.
Notes to Consolidated Financial Statements (Continued)
| As of | ||||||||||||
| December 28, 2015 |
December 29 2014 |
December 30, 2013 |
||||||||||
| (In thousands) | ||||||||||||
| Segment Assets: |
||||||||||||
| PCB |
$ | 1,943,577 | $ | 1,334,648 | $ | 1,371,093 | ||||||
| E-M Solutions |
143,779 | 43,255 | 43,990 | |||||||||
| Corporate |
583,948 | 223,386 | 258,492 | |||||||||
|
|
|
|
|
|
|
|||||||
| Total assets |
$ | 2,671,304 | $ | 1,601,289 | $ | 1,673,575 | ||||||
|
|
|
|
|
|
|
|||||||
The Corporate category includes operating expenses that are not included in the segment operating performance measures. Corporate consists primarily of corporate governance functions such as finance, accounting, information technology, facilities and human resources personnel, as well as global sales and marketing personnel and acquisition and integration costs associated with the acquisition of Viasystems. Bank fees and legal, accounting, and other professional service costs associated with the acquisition of Viasystems of $34,448 and $5,981 for the years ended December 28, 2015 and December 29, 2014, respectively, are included in Corporate. There were no bank fees and legal, accounting, and other professional service costs associated with the acquisition of Viasystems for the year ended December 30, 2013.
During the years ended December 29, 2014 and December 30, 2013, the Company recorded impairment charges of $1,845 and $10,782, respectively, for the impairment of long-lived assets related to its PCB operating segment.
The Company markets and sells its products in approximately 41 countries. Other than in the United States and China, the Company does not conduct business in any country in which its net sales in that country exceed 10% of the Companys total net sales. Net sales and long-lived assets are as follows:
| 2015 | 2014 | 2013 | ||||||||||||||||||||||
| Net Sales | Long-Lived Assets |
Net Sales | Long-Lived Assets |
Net Sales | Long-Lived Assets |
|||||||||||||||||||
| (In thousands) | ||||||||||||||||||||||||
| United States |
$ | 960,146 | $ | 654,579 | $ | 568,796 | $ | 103,340 | $ | 571,046 | $ | 95,672 | ||||||||||||
| China |
547,999 | 923,219 | 352,385 | 682,739 | 391,905 | 754,781 | ||||||||||||||||||
| Other |
587,343 | 23,133 | 404,536 | | 405,264 | | ||||||||||||||||||
|
|
|
|
|
|
|
|
|
|
|
|
|
|||||||||||||
| Total |
$ | 2,095,488 | $ | 1,600,931 | $ | 1,325,717 | $ | 786,079 | $ | 1,368,215 | $ | 850,453 | ||||||||||||
|
|
|
|
|
|
|
|
|
|
|
|
|
|||||||||||||
Net sales are attributed to countries by country invoiced.
111
Table of Contents
TTM TECHNOLOGIES, INC.
Notes to Consolidated Financial Statements (Continued)
| (20) | Earnings Per Share |
The following is a reconciliation of the numerator and denominator used to calculate basic earnings (loss) per share and diluted earnings (loss) per share for the years ended December 28, 2015, December 29, 2014 and December 30, 2013:
| For the Year Ended | ||||||||||||
| December 28, 2015 |
December 29, 2014 |
December 30, 2013 |
||||||||||
| (In thousands, except per share amounts) |
||||||||||||
| Net (loss) earnings attributable to TTM Technologies, Inc. stockholders |
$ | (25,882 | ) | $ | 14,693 | $ | 21,877 | |||||
|
|
|
|
|
|
|
|||||||
| Weighted average shares outstanding |
92,675 | 83,238 | 82,506 | |||||||||
| Dilutive effect of performance-based stock units, restricted stock units and stock options |
| 703 | 626 | |||||||||
|
|
|
|
|
|
|
|||||||
| Diluted shares |
92,675 | 83,941 | 83,132 | |||||||||
|
|
|
|
|
|
|
|||||||
| (Loss) earnings per share attributable to TTM Technologies, Inc. stockholders: |
||||||||||||
| Basic |
$ | (0.28 | ) | $ | 0.18 | $ | 0.27 | |||||
|
|
|
|
|
|
|
|||||||
| Diluted |
$ | (0.28 | ) | $ | 0.18 | $ | 0.26 | |||||
|
|
|
|
|
|
|
|||||||
For the year ended December 28, 2015, potential shares of common stock, consisting of stock options to purchase approximately 420 shares of common stock at exercise prices ranging from $5.78 to $16.82 per share, 2,294 RSUs, and 572 PRUs were not included in the computation of diluted earnings per share because the Company incurred a net loss from operations and, as a result, the impact would be anti-dilutive.
For the years ended December 29, 2014 and December 30, 2013, PRUs, RSUs and stock options to purchase 1,233 and 1,751 shares of common stock, respectively, were not considered in calculating diluted earnings per share because the options exercise prices or the total assumed proceeds under the treasury stock method for PRUs, RSUs or stock options was greater than the average market price of common shares during the applicable year and, therefore, the effect would be anti-dilutive.
Additionally, for the year ended December 28, 2015, the effect of shares of common stock related to the Companys convertible senior notes, based on the if-converted method, were not included in the computation of dilutive earnings per share because the Company incurred a net loss from operations and, as a result, the impact would be anti-dilutive.
For the years ended December 29, 2014 and December 30, 2013, the effect of shares of common stock related to the Companys convertible senior notes, based on the treasury stock method, were not included in the computation of dilutive earnings per share because the conversion price of the convertible senior notes were greater than the average market price of common shares during the applicable year, and therefore, the effect would be anti-dilutive.
Outstanding warrants for the years ended December 28, 2015, December 29, 2014 and December 30, 2013, to purchase common stock were not included in the computation of dilutive earnings per share because the strike price of the warrants to purchase the Companys common stock were greater than the average market price of common shares during the applicable year, and therefore, the effect would be anti-dilutive.
112
Table of Contents
TTM TECHNOLOGIES, INC.
Notes to Consolidated Financial Statements (Continued)
The below is a summary of amounts convertible to common stock related to convertible senior notes and related warrants:
| For the Year Ended | ||||||||||||
| December 28, 2015 |
December 29, 2014 |
December 30, 2013 |
||||||||||
| (In thousands) | ||||||||||||
| Common stock related to convertible senior notes |
25,940 | 27,970 | 25,265 | |||||||||
|
|
|
|
|
|
|
|||||||
| Warrants to purchase common stock |
26,408 | 28,020 | 23,654 | |||||||||
|
|
|
|
|
|
|
|||||||
| (21) | Related Party Transactions |
In the normal course of business, the Companys foreign subsidiaries purchase laminate and prepreg from related parties in which a significant shareholder of the Company holds an equity interest. The Company purchased laminate and prepreg from these related parties in the amount of $63,605, $47,446 and $62,648 for the years ended December 28, 2015, December 29, 2014 and December 30, 2013, respectively.
Dongguan Shengyi Electronics Ltd. (SYE) is also a related party as it is a wholly owned subsidiary of an entity in which a significant shareholder of the Company holds an equity interest. The Company sells PCBs to SYE and purchases PCBs including various services relating to PCB manufacturing from SYE. Sales to SYE for the years ended December 28, 2015, December 29, 2014 and December 30, 2013 were $4,709, $24,120 and $29,616, respectively. Purchases of PCBs including various services relating to PCB manufacturing for the years ended December 28, 2015 and December 29, 2014 were $1,948 and $1,671, respectively. There were no purchases from SYE for the year ended December 30, 2013.
As of December 28, 2015 and December 29, 2014, the Companys consolidated balance sheets included $29,306 and $17,950, respectively, in accounts payable due to related parties for purchases of laminate and prepreg and various PCB manufacturing services and such balances are included as a component of accounts payable on the consolidated balance sheets. Additionally, the Companys consolidated balance sheets included $1,999 and $4,934, respectively, in accounts receivable due from a related party for sales of PCBs to SYE, as mentioned above, and such balances are included as a component of accounts receivable, net on the consolidated balance sheets.
| (22) | Non-controlling Interest Holdings |
As of December 28, 2015, noncontrolling interest consists of a 5% equity interest in a manufacturing facility in Huiyang, China which was acquired with along with other assets and liabilities of Viasystems.
During the year ended December 30, 2013, the Company completed the sale of its 70.2% controlling equity interest in Dongguan Shengyi Electronics Ltd. (SYE) to its noncontrolling partner, Shengyi Technology Co. Ltd. (Sytech), for 702,000,000 Chinese RMB or $114,495. The Company recognized a gain on the sale of SYE of $17,917 in 2013. Consideration net of cash sold was $67,147.
Additionally, the Company acquired Sytechs 20.0% noncontrolling equity interest in Dongguan Meadville Circuits Ltd. (DMC) for 180,000,000 Chinese RMB or $29,358 in 2013. The Company recorded a decrease to additional paid-in capital for the difference between the purchase price and the carrying value of the noncontrolling interest of $71.
113