EX-99.2
Published on September 22, 2014

Acquisition of
Viasystems Investor Presentation
9/22/2014
Exhibit 99.2 |

2
Disclaimer
Forward-Looking Statements
2
Certain statements in this communication may constitute forward-looking
statements within the meaning of the Private Securities Litigation Reform Act of
1995. Such statements relate to a variety of matters, including but not limited to: the operations of the businesses of TTM and Viasystems
separately and as a combined entity; the timing and consummation of the proposed merger; the
expected benefits of the integration of the two companies; the combined companys
plans, objectives, expectations and intentions; and other statements that are not historical fact. These statements
are made on the basis of the current beliefs, expectations and assumptions of the management
of TTM and Viasystems regarding future events and are subject to significant risks and
uncertainty. Statements regarding our expected performance in the future are forward-looking statements.
It is uncertain whether any of the events anticipated by the forward-looking statements
will transpire or occur, or if any of them do, what impact they will have on the results
of operations and financial condition of the combined company or the price of Viasystems or TTMs common stock. These forward-
looking statements involve certain risks and uncertainties that could cause actual results to
differ materially from those indicated in such forward-looking statements,
including but not limited to: the ability of the parties to consummate the proposed merger and the satisfaction of the conditions precedent
to consummation of the proposed merger, including the ability to secure regulatory approvals
in a timely manner or at all; the adoption of the Merger Agreement by Viasystems
stockholders; the possibility of legal or regulatory proceedings (including related to the transaction itself); the ability of TTM to
successfully integrate Viasystems operations, product lines, technology and employees
and realize synergies and additional opportunities for growth from the proposed merger
in a timely manner or at all; unknown, underestimated or undisclosed commitments or liabilities; the potential impact of the
announcement or consummation of the proposed transactions on the parties relationships
with third parties, which may make it more difficult to maintain business and
operational relationships; the level of demand for the combined companys products, which is subject to many factors, including
uncertain global economic and industry conditions, demand for electronic products and printed
circuit boards, and customers new technology and capacity requirements;
TTMs and Viasystems ability to (i) develop, deliver and support a broad range of products, expand their markets and develop
new markets, (ii) timely align their cost structures with business conditions, and (iii)
attract, motivate and retain key employees; and developments beyond Viasystems or
TTMs control, including but not limited to, changes in domestic or global economic conditions, competitive conditions and
consumer preferences, adverse weather conditions or natural disasters, health concerns,
international, political or military developments, and technological
developments. Additional factors that may cause results to differ materially from those described in the forward-looking statements are
set forth in the Annual Report on Form 10-K of TTM Technologies, Inc. for the year ended
December 30, 2013, which was filed with the Securities and Exchange Commission (the
SEC) on February 21, 2014, under the heading Item 1A. Risk Factors and in the Annual Report on Form 10-K of Viasystems
for the year ended December 31, 2013, which was filed with the SEC on February 14, 2014, under
the heading Item 1A. Risk Factors, and in each companys other filings
made with the SEC available at the SECs website at www.sec.gov.
Neither Viasystems nor TTM undertakes any obligation to update any such forward-looking
statements to reflect any new information, subsequent events or circumstances, or
otherwise, except as may be required by law.
|

3
Disclaimer
3
Use of Non-GAAP Financial Measures
The companies use adjusted EBITDA to provide meaningful supplemental information regarding
operating performance and profitability by excluding from EBITDA certain items that
each company believes are not indicative of its ongoing operating results or will not impact future
operating cash flows, which include stock-based compensation expense, gain on sale of
assets, asset impairments, restructuring, costs related to acquisitions, and other
charges. Data Used in This Presentation
Due to rounding, numbers presented throughout this and other documents may not add up
precisely to the totals provided and percentages may not precisely reflect the absolute
figures. In addition to the financial statements presented
in accordance with U.S. GAAP, TTM and Viasystems use certain non-GAAP financial
measures, including adjusted EBITDA. The companies present non-GAAP
financial information to enable investors to see each company through the eyes of
management and to provide better insight into its ongoing financial performance.
Adjusted EBITDA is defined as earnings before interest expense, income taxes, depreciation,
amortization of intangibles, stock-based compensation expense, gain on sale of
assets, asset impairments, restructuring, costs related to acquisitions, and other charges. For a
reconciliation of adjusted EBITDA to net income, please see Appendix A at the end of this
presentation. Adjusted EBITDA is not a recognized financial measure under U.S. GAAP,
and does not purport to be an alternative to operating income or an indicator of operating
performance. Adjusted EBITDA is presented to enhance an understanding of operating results and
is not intended to represent cash flows or results of operations. The Boards of
Directors, lenders and management of the companies use adjusted EBITDA primarily as an
additional measure of operating performance for matters including executive compensation and
competitor comparisons. The use of this non-GAAP measure provides an indication of
each companys ability to service debt, and management considers it an appropriate
measure to use because of the companies leveraged positions.
Adjusted
EBITDA has certain material limitations, primarily due to the exclusion of certain amounts that are material to each companys
consolidated results of operations, such as interest expense, income tax expense, and
depreciation and amortization. In addition, adjusted EBITDA may differ from the
adjusted EBITDA calculations reported by other companies in the industry, limiting its usefulness as a
comparative measure.
|

4
Disclaimer
No Offer or Solicitation
Additional Information and Where to Find It
Participants in the Solicitation
TTM and Viasystems and their respective directors and executive officers may be deemed to be
participants in the solicitation of proxies from Viasystems' stockholders in connection
with the proposed merger and may have direct or indirect interests in the proposed merger. Information about TTMs directors and
executive officers is set forth in TTMs Proxy Statement on Schedule 14A for its 2014
Annual Meeting of Stockholders, which was filed with the SEC on March 14, 2014, and its
Annual Report on Form 10-K for the fiscal year ended December 30, 2013, which was filed with the SEC on February 21, 2014. These documents are available
free of charge at the SECs website at www.sec.gov, and from TTM by contacting Investor
Relations by mail at TTM Technologies, Inc., 1665 Scenic Avenue, Suite 250, Costa Mesa,
CA 92626, Attn: Investor Relations Department, by telephone at 714-327-3000, or by going to TTMs Investor Relations page on its corporate website at
www.ttmtech.com. Information about Viasystems' directors and executive officers is set
forth in Viasystems' Proxy Statement on Schedule 14A for its 2014 Annual Meeting of
Stockholders, which was filed with the SEC on March 14, 2014, and its Annual Report on Form 10-K for the fiscal year ended December 31, 2013, which
was filed with the SEC on February 14, 2014. These documents are available free of
charge at the SECs website at www.sec.gov, and from Viasystems by contacting
Investor Relations by mail at Viasystems Group, Inc., 101 South Hanley Road, Suite 1800, St.
Louis, MO 63105, Attn: Investor Relations Department, by telephone at
314-727-2087, or by going to Viasystems' Investor Info page on its corporate website
at www.viasystems.com. Additional information regarding the interests of
participants in the solicitation of proxies in connection with the proposed merger will be
included in the Proxy Statement/Prospectus that TTM will file with the SEC. TTM will
file with the SEC a registration statement on Form S-4, which will include a prospectus with respect to TTMs shares of common stock to be issued in the
proposed merger and a proxy statement of Viasystems in connection with the proposed merger
between TTM and Viasystems (the Proxy Statement/Prospectus). The
Proxy Statement/Prospectus will be sent or given to Viasystems stockholders and will contain important information about the
proposed merger and related matters. VIASYSTEMS SECURITY HOLDERS ARE ADVISED TO READ THE
PROXY STATEMENT/PROSPECTUS CAREFULLY WHEN IT BECOMES AVAILABLE BECAUSE IT WILL CONTAIN
IMPORTANT INFORMATION ABOUT THE PROPOSED MERGER. The Proxy Statement/Prospectus and other relevant materials
(when they become available) and any other documents filed by TTM or Viasystems with the SEC
may be obtained free of charge at the SECs website at www.sec.gov. In
addition, security holders will be able to obtain free copies of the Proxy Statement/Prospectus from TTM or Viasystems by contacting either (1)
Investor Relations by mail at TTM Technologies, Inc., 1665 Scenic Avenue, Suite 250, Costa
Mesa, CA 92626, Attn: Investor Relations Department, by telephone at 714-
327-3000, or by going to TTMs Investor Relations page on its corporate website at
www.ttmtech.com or (2) Investor Relations by mail at Viasystems Group, Inc., 101 South
Hanley Road, Suite 1800, St. Louis, MO 63105, Attn: Investor Relations Department, by telephone at 314-727-2087, or by going to Viasystems' Investor Info
page on its corporate website at www.viasystems.com.
The information in this communication is for informational purposes only and is
neither an offer to purchase, nor a solicitation of an offer to sell, subscribe for or buy
any securities or the solicitation of any vote in any jurisdiction pursuant to the proposed
transactions or otherwise, nor shall there be any sale, issuance or transfer of
securities in any jurisdiction in contravention of applicable law. No offer of securities
shall be made except by means of a prospectus meeting the requirements of Section 10 of
the Securities Act of 1933, as amended.
4
|

5
Transaction Overview
TTM Technologies, Inc. (TTM) to acquire 100% of Viasystems Group, Inc.
(Viasystems) in a cash/stock transaction
The total enterprise value of the transaction as of September 19
was approximately
$927mm, equivalent to 6.8x Viasystems
6/30/2014 adjusted LTM EBITDA of $137mm
TTM has fully committed financing for the transaction
Viasystems
two largest shareholders (combined 67% ownership) have signed
agreements to vote in favor of the transaction
Expected closing in the first half of 2015, subject to regulatory approvals and other
customary conditions to closing
5
Viasystems stockholders will receive $11.33 per share in cash and 0.706 shares of TTM
stock for each Viasystems share
As
of
the
market
close
on
Friday,
September
19,
the
value
of
the
transaction
consideration
was $16.46 per Viasystems share, or approximately $368mm in aggregate
TTM shareholders will own approximately 84% of the common stock of the combined
company |

6
Strategic Rationale
Combination
of
two
industry
leaders,
creating
enhanced
scale
and
new
growth opportunities
End
market
diversification
into
Automotive
and
expanded
presence
in
Medical, Industrial & Instrumentation
Complementary global footprint, commitment to operational excellence
and expertise in key technologies
Outstanding combined customer list spanning North America, Asia and
Europe
Strong talent pool, with extensive experience in the PCB industry
Value creation opportunity
6
Enhanced scale to compete with Asian industry leaders ($2.5bn combined pro
forma 2013 revenue)
At least $25mm in SG&A cost synergies
Potential to achieve industry-leading financial performance
|
7
Overview of TTM Technologies, Inc.
Leading global provider of HDI, flexible, rigid-flex and
high layer count printed circuit boards (PCBs), IC
substrates and custom assemblies
PCBs and assemblies manufactured can be found in:
13 specialized facilities in the U.S. and China
Approximately 15,000 employees as of June 30, 2014
Founded in 1999 and headquartered in Costa Mesa,
California
Publicly traded (NASDAQ: TTMI)
7
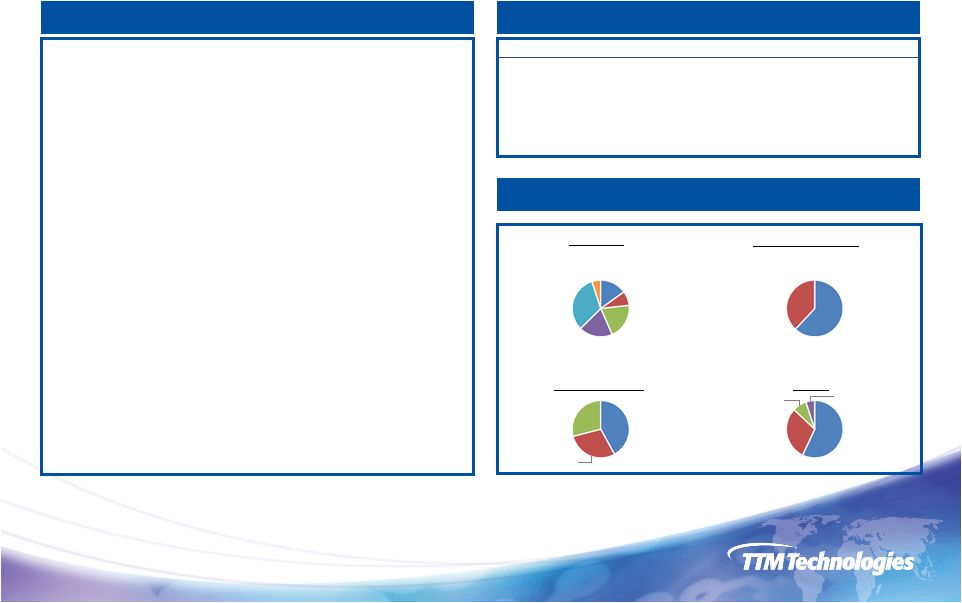
Key financial metrics ($mm)
FY2013 revenue breakdown
Business overview
Region of manufacture
End market
Networking/
Communications
32%
Computing/Storage/
Peripherals
20%
Asia Pacific
62%
North
America
38%
US
42%
China
29%
Others
29%
HDI
30%
PCB
57%
Source: Company website and filings
Destination country
Product
2012
2013
LTM June 30, 2014
Revenue
1,349
1,368
1,294
% growth
(5.6%)
1.4%
(6.5%)
Adj. EBITDA
191
181
163
% margin
14.1%
13.3%
12.6%
Total assets
1,677
1,674
1,634
Cellular Phone
20%
Medical/Industrial/
Instrumentation/Other
8%
Aerospace/
Defense
15%
Other
5%
Flex
8%
Substrate
5%
Smartphones and tablet computers
Radar systems for use in commercial & defense products
Routers & switches
High-end computers and storage systems
Medical imaging & diagnostic equipment
Energy control systems |
8
Overview of Viasystems Group, Inc.
Global technology leader and provider of complex
multi-layer rigid, flexible, and rigid-flex printed circuit
boards (PCBs) and electro-mechanical solutions
PCBs and assemblies manufactured can be found in:
Automotive engine controls and electronics for
navigation
Telecommunications switching equipment
Data networking equipment
Semiconductor test equipment
Wind, solar energy, and off-shore drilling applications
Flight control systems
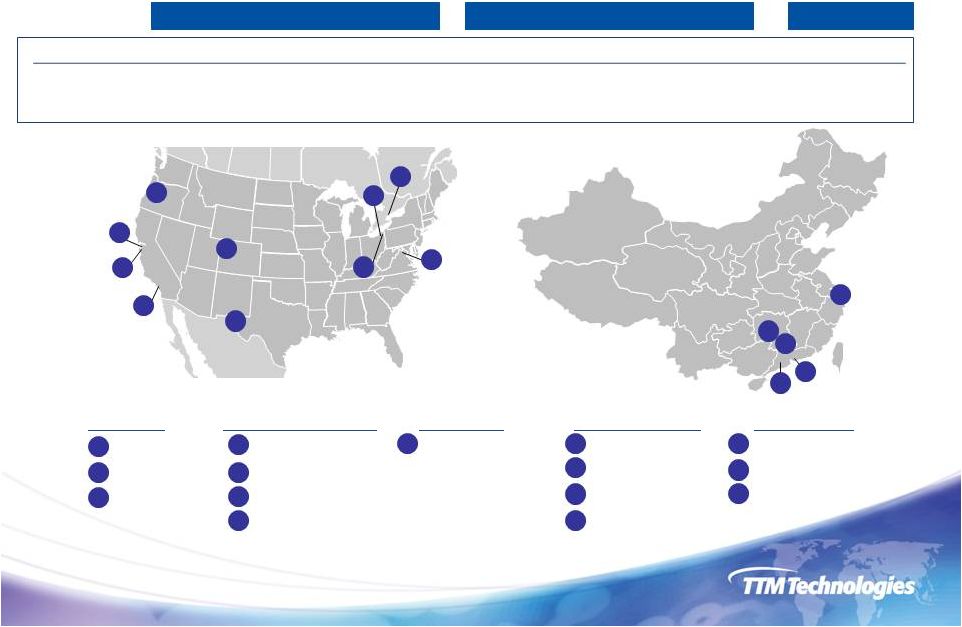
15 manufacturing facilities worldwide; 8 in the U.S., 5
in China, 1 in Canada, and 1 in Mexico
Approximately 14,800 employees as of June 30, 2014
Incorporated in 1996 and headquartered in St. Louis,
Missouri
Publicly traded (NASDAQ: VIAS)
8
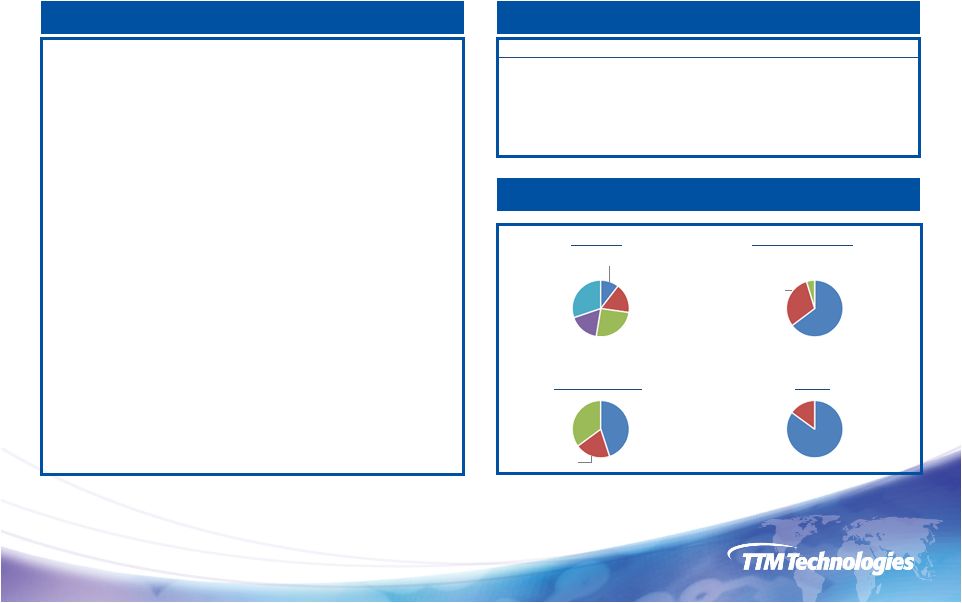
Key financial metrics ($mm)
FY2013 revenue breakdown
Business overview
Region of manufacture
End market
Automotive
30%
Telecom
17%
Industrial &
Instrumentation
25%
Computer &
Datacom
17%
Military and Aerospace
11%
Asia Pacific
65%
North America
30%
Mexico
5%
US
45%
China
20%
Others
35%
Assembly
15%
PCB
85%
Source: Company website and filings
Destination country
Product
2012
2013
LTM June 30, 2014
Revenue
1,160
1,171
1,209
% growth
9.7%
1.0%
4.3%
Adj. EBITDA
148
131
137
% margin
12.8%
11.2%
11.3%
Total assets
1,106
1,118
1,148 |
9
Market Leader
9
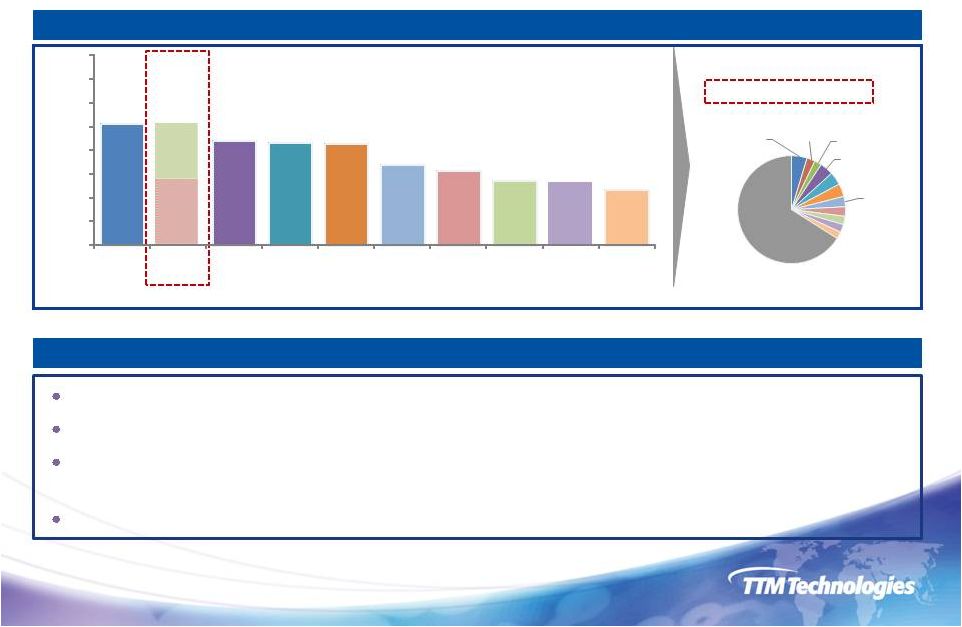
2013 Top 10 world PCB makers by revenue ($mm)
Source: Prismark Partners (February 2014) and company filings
Top 10 represent ~34% of 2013 total world PCB output
2013 Global PCB output of ~$55bn
Pro
forma
TTM
+
Viasystems:
5%
Leading position in growing market segments
Global PCB manufacturer with combined pro forma FY 2013 revenue of $2.5 billion
Core supplier to automotive segment
Complementary positions in Medical; Industrial & Instrumentation; Networking &
Communications; and Aerospace & Defense segments
Advanced technology supplier to rapidly growing smartphone and tablet segments
$2,556
$2,539
$2,205
$2,163
$2,136
$1,700
$1,567
$1,372
$1,315
$1,180
0
500
1,000
1,500
2,000
2,500
3,000
3,500
4,000
Nippon
Mektron
TTM +
Viasystems
Young
Poong
Zhen Ding
Unimicron
SEMCO
Ibiden
Tripod
Sumitomo
Daeduck
VIAS
TTM
5%
3%
2%
4%
4%
4%
3%
3%
2%
2%
2%
Others
66% |
10
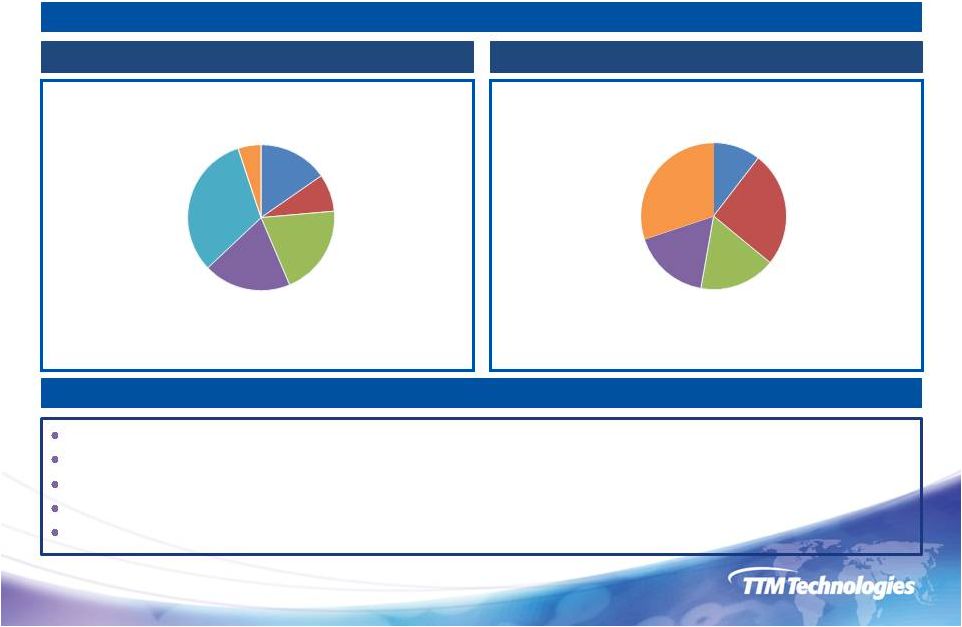
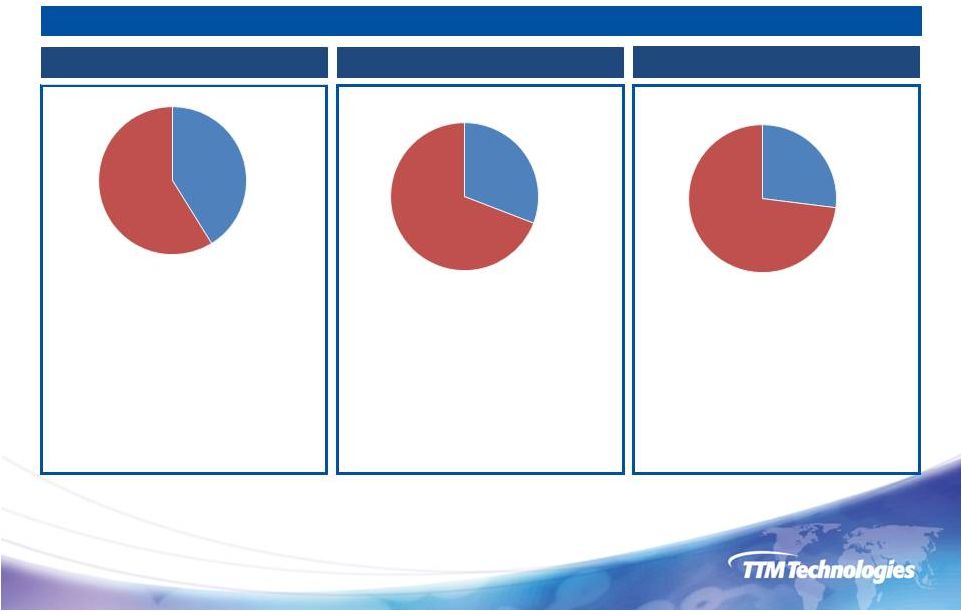
Introduces
attractive
new
Automotive
segment
14%
of
total
sales
Cellular
Phone
end
market
reduced
from
20%
of
total
sales
to
11%
Telecom
and
Computing
end
market
reduced
from
51%
of
total
sales
to
43%
Aerospace & Defense reduced from 15% of total sales to 13%
Medical, Industrial and Instrumentation end market increased to 16% of total sales from
8% End Market Diversification
10
Viasystems
TTM
2013 sales = $1,171mm
2013 sales = $1,368mm
2013 revenue by end market
2013 pro forma combined revenue by end market
Source: Company website and filings
Computing/Storage/
Peripherals
20%
Aerospace/
Defense
15%
Cellular
Phone
20%
Medical/
Industrial/
Instrumentation/
Other
8%
Networking/
Communications
32%
Other
5%
Automotive
30%
Military and
Aerospace
11%
Industrial &
Instrumentation
25%
Telecom
17%
Computer &
Datacom
17% |
11
Complementary Global Footprint and Capabilities
11
TTM
Viasystems
Total
TTM
Viasystems
Total
Combined Total
# of facilities
7
10
17
6
5
11
28
Size (~ 1,000 sq.ft)
860
1,100
1,960
3,400
4,610
8,010
9,970
North America
China
Automotive
Conventional PCB
HDI & QTA
Aerospace & Defense
Specialty Assy
1
Anaheim, CA
San Jose, CA
2
Milpitas, CA
Cleveland, OH
6
North Jackson, OH
5
Denver, CO
8
Zhongshan, China
9
Guangzhou, China
10
Huiyang, China
7
Sterling, VA
11
Forest Grove, OR
12
Toronto, Canada
13
Juarez, Chihuahua
15
Shenzhen, China
14
Shanghai, China
4
5
3
4
6
1
3
9
2
8
10
11
7
13
14
15
Viasystems Facilities:
Combined Total
12
Source: Company website and filings |
12
Outstanding Combined Customer List
12
Top 5 Customers
Apple
Cisco
Ericsson
Huawei
Juniper
Viasystems
TTM + Viasystems
TTM
Top 5 Customers
Alcatel-Lucent
Autoliv
Bosch
Continental
GE
Top 5 Customers
Apple
Bosch
Cisco
GE
Huawei
2013 revenue contribution by customer
Note: Customer names ordered alphabetically
Source: Company website and filings
Top 5
Customers
41%
Other
59%
Top 5
Customers
31%
Other
69%
Top 5
Customers
28%
Other
72% |
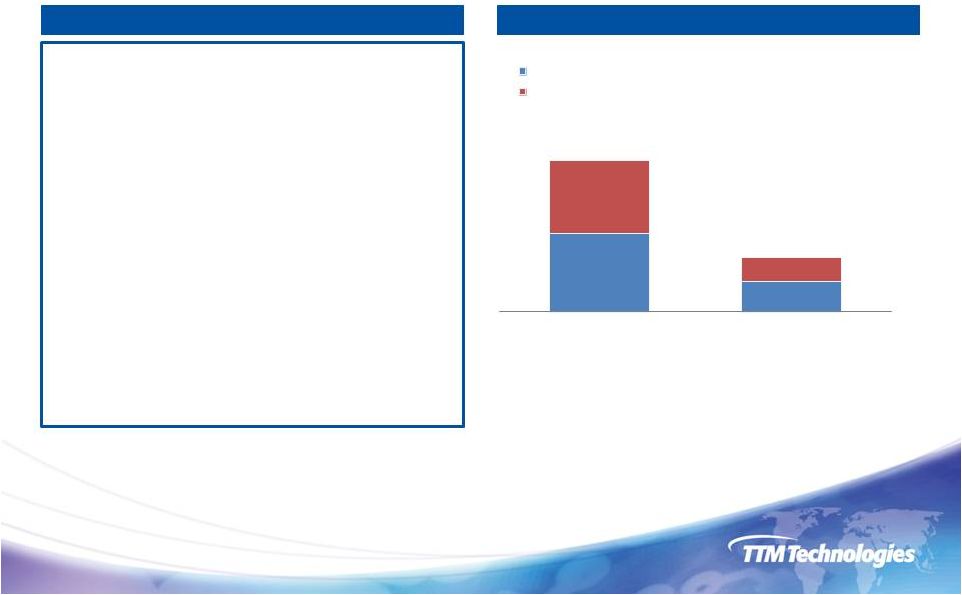
13
Combined 6/30/14 LTM revenue of $2.5bn and adjusted
EBITDA of $300mm
Including first level synergies and excluding transaction
related costs and purchase accounting adjustments,
transaction is expected to produce material non-GAAP
EPS accretion in the first year after closing
At least $25mm in pre-tax SG&A synergies have been
identified and are expected to be realized within 12
months of closing
Financial leverage (gross
debt / LTM EBITDA) will be
~4.7x before synergies and ~4.3x including $25mm of
synergies, pro forma at June 30, 2014
Expect additional streamlined capex spending and
achievement of second level synergies over time
Summary Financial Impact
13
Commentary
6/30/14 LTM Revenue and Adjusted EBITDA ($mm)
/ 12.0%
/ 11.3%
/ 12.6%
Source: Company website and filings
1,294
1,209
$2,504
Revenue
TTM
Viasystems
163
137
$300
Adj. EBITDA / Margin %
Strong cash flow generation of the
combined business is expected to allow for
significant deleveraging |

14
Clear Strategic Benefits
Creates enhanced scale and new growth opportunities
Accelerates TTMs diversification strategy
Complementary global footprint
Expanded customer base and broader end market penetration reduces
customer concentration and seasonality
Compelling technology combination
High density interconnect capability + strong quality initiatives = revenue
opportunities, yield improvements and customer satisfaction
Strong combined talent pool
14 |

15
Appendix A
15 |

16
TTM Adjusted EBITDA Reconciliation
16
$mm
2012
2013
LTM 6/30/14
Net income
($181.1)
$23.9
($3.3)
Income tax provision
12.7
15.9
4.4
Interest expense
25.8
24.0
24.0
Depreciation and amortization
99.0
101.5
102.1
EBITDA
($43.6)
$165.3
$127.2
Stock-based compensation
10.3
9.0
8.2
Gain on asset sale
-
(17.9)
Restructuring and other changes
5.5
14.2
14.7
Impairments
218.4
10.8
12.6
Adjusted EBITDA
$190.6
$181.3
$162.7
Source: Company website and filings |

17
Viasystems Adjusted EBITDA Reconciliation
17
$mm
2012
2013
LTM 6/30/14
Net income
($62.2)
($27.6)
($17.0)
Income tax provision
12.8
11.1
12.3
Interest expense
42.2
44.8
45.4
Depreciation and amortization
84.6
94.8
94.6
EBITDA
$77.4
$123.1
$135.3
Stock-based compensation
10.6
9.4
7.3
Restructuring
18.2
1.1
1.4
Impairment
1.7
-
-
Costs related to acquisition and equity registrations
13.6
0.6
0.4
Other, net
(0.4)
(6.0)
(10.3)
Loss on early extinguishment of debt
24.2
-
-
Amortization of deferred financing costs
2.7
2.9
2.8
Adjusted EBITDA
$148.0
$131.1
$137.0
¹
1
This data was obtained from Viasystems public filings on file with the SEC. TTM
makes no representation as to the accuracy of
such data.
|
Thank
you! |