EX-99.1
Published on May 6, 2004
Exhibit 99.1
Link to searchable text of slide shown above
Link to searchable text of slide shown above

Link to searchable text of slide shown above
Link to searchable text of slide shown above
Link to searchable text of slide shown above
Link to searchable text of slide shown above
Link to searchable text of slide shown above
Link to searchable text of slide shown above
Link to searchable text of slide shown above
Link to searchable text of slide shown above
Link to searchable text of slide shown above
Link to searchable text of slide shown above
Link to searchable text of slide shown above
Link to searchable text of slide shown above
Link to searchable text of slide shown above
Link to searchable text of slide shown above
Link to searchable text of slide shown above
Link to searchable text of slide shown above
Link to searchable text of slide shown above
Link to searchable text of slide shown above
Link to searchable text of slide shown above
Link to searchable text of slide shown above
Link to searchable text of slide shown above
Link to searchable text of slide shown above
Link to searchable text of slide shown above
Link to searchable text of slide shown above
Link to searchable text of slide shown above
Link to searchable text of slide shown above
Link to searchable text of slide shown above
Link to searchable text of slide shown above
Link to searchable text of slide shown above

Link to searchable text of slide shown above
Link to searchable text of slide shown above
Link to searchable text of slide shown above
Link to searchable text of slide shown above
Searchable text section of graphics shown above
[GRAPHIC]
[LOGO]
JP Morgan Technology
& Telecom Conference
May 5, 2004
[GRAPHIC]
Safe Harbor Provision
[LOGO]
During the course of this presentation, we will make projections or other forward-looking statements regarding future events or the future financial performance of the Company. We wish to caution you that such statements reflect only our current expectations, and that actual events or results may differ materially.
We refer you to the risk factors and cautionary language contained in the documents that the Company files from time to time with the Securities and Exchange Commission, specifically the Companys most recent S-3 Registration Statement and Form 10-K. Such documents contain and identify important factors that could cause the actual results to differ materially from those contained in our projections or forward-looking statements. We undertake no obligation to update such projections or such forward-looking statements in the future.
2
Kent Alder
President
and
Chief Executive Officer
3
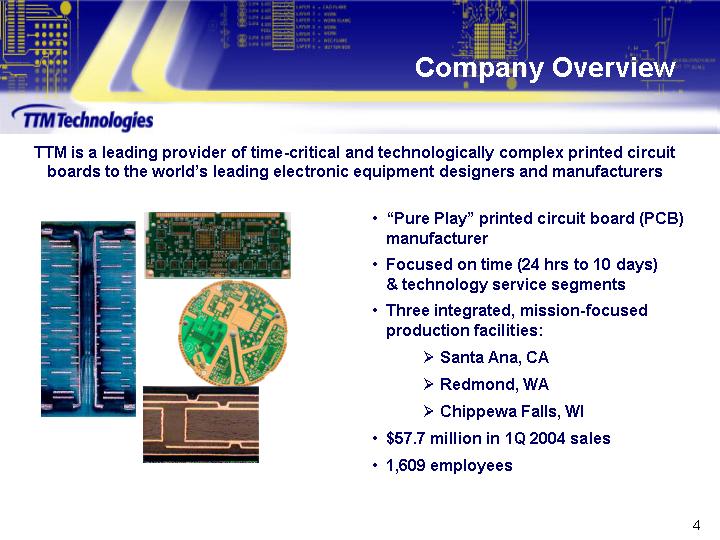
Company Overview
TTM is a leading provider of time-critical and technologically complex printed circuit boards to the worlds leading electronic equipment designers and manufacturers
[GRAPHIC]
Pure Play printed circuit board (PCB) manufacturer
Focused on time (24 hrs to 10 days) & technology service segments
Three integrated, mission-focused production facilities:
Santa Ana, CA
Redmond, WA
Chippewa Falls, WI
$57.7 million in 1Q 2004 sales
1,609 employees
4
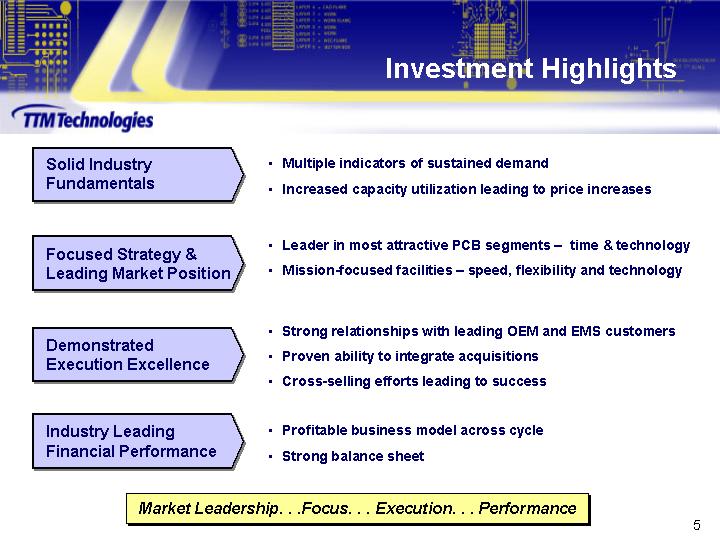
Investment Highlights
|
Solid Industry |
|
|
Multiple indicators of sustained demand |
|
Fundamentals |
|
|
Increased capacity utilization leading to price increases |
|
|
|
|
|
|
|
|
|
|
|
Focused Strategy & |
|
|
Leader in most attractive PCB segments time & technology |
|
Leading Market Position |
|
|
Mission-focused facilities speed, flexibility and technology |
|
|
|
|
|
|
|
|
|
|
|
Demonstrated |
|
|
Strong relationships with leading OEM and EMS customers |
|
|
|
Proven ability to integrate acquisitions |
|
|
|
|
Cross-selling efforts leading to success |
|
|
|
|
|
|
|
Industry Leading |
|
|
Profitable business model across cycle |
|
Financial Performance |
|
|
Strong balance sheet |
Market Leadership. . .Focus. . . Execution. .. . Performance
5
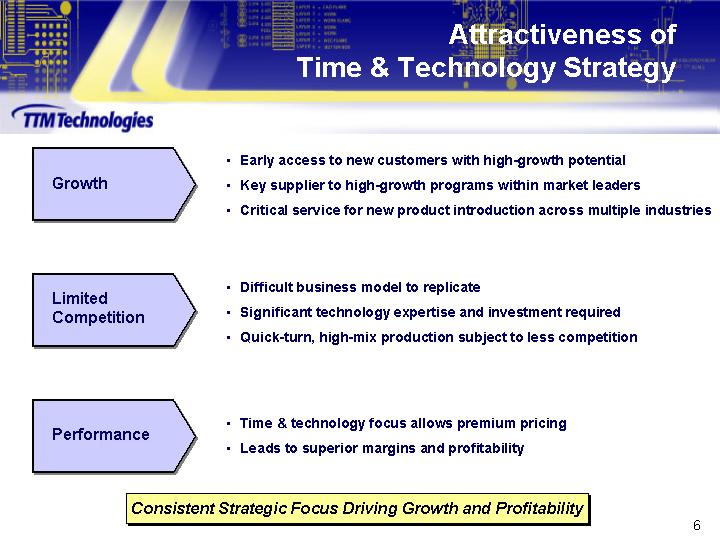
Attractiveness of Time & Technology Strategy
|
|
|
|
Early access to new customers with high-growth potential |
|
Growth |
|
|
Key supplier to high-growth programs within market leaders |
|
|
|
|
Critical service for new product introduction across multiple industries |
|
|
|
|
|
|
|
|
|
|
|
Limited |
|
|
Difficult business model to replicate |
|
|
|
Significant technology expertise and investment required |
|
|
|
|
Quick-turn, high-mix production subject to less competition |
|
|
|
|
|
|
|
|
|
|
|
|
Performance |
|
|
Time & technology focus allows premium pricing |
|
|
|
Leads to superior margins and profitability |
Consistent Strategic Focus Driving Growth and Profitability
6
Industry Overview
7
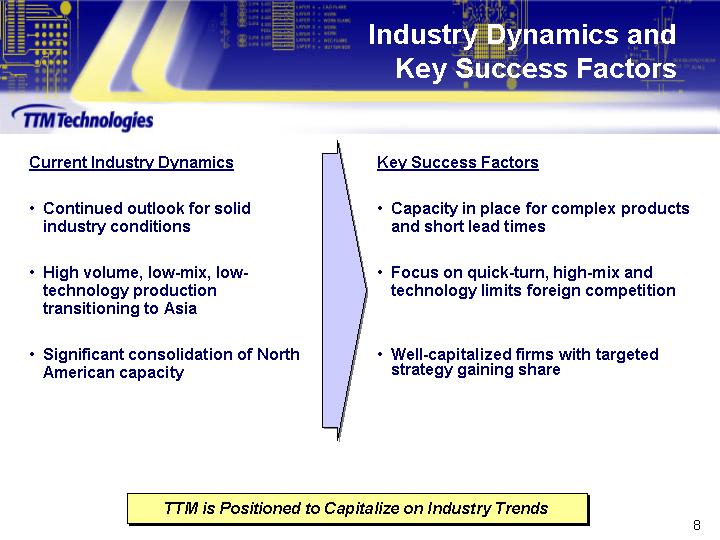
Industry Dynamics and Key Success Factors
Current Industry Dynamics
Continued outlook for solid industry conditions
High volume, low-mix, low-technology production transitioning to Asia
Significant consolidation of North American capacity
Key Success Factors
Capacity in place for complex products and short lead times
Focus on quick-turn, high-mix and technology limits foreign competition
Well-capitalized firms with targeted strategy gaining share
TTM is Positioned to Capitalize on Industry Trends
8
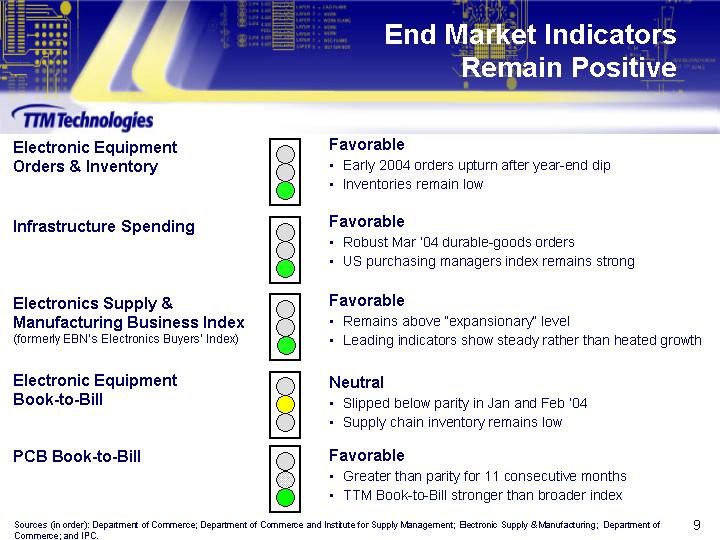
End Market Indicators Remain Positive
|
Electronic Equipment |
|
Favorable |
|
Orders & Inventory |
|
Early 2004 orders upturn after year-end dip |
|
|
|
Inventories remain low |
|
|
|
|
|
Infrastructure Spending |
|
Favorable |
|
|
|
Robust Mar 04 durable-goods orders |
|
|
|
US purchasing managers index remains strong |
|
|
|
|
|
Electronics Supply & |
|
Favorable |
|
Manufacturing Business Index |
|
Remains above expansionary level |
|
(formerly EBNs Electronics Buyers Index) |
|
Leading indicators show steady rather than heated growth |
|
|
|
|
|
Electronic Equipment |
|
Neutral |
|
Book-to-Bill |
|
Slipped below parity in Jan and Feb 04 |
|
|
|
Supply chain inventory remains low |
|
|
|
|
|
PCB Book-to-Bill |
|
Favorable |
|
|
|
Greater than parity for 11 consecutive months |
|
|
|
TTM Book-to-Bill stronger than broader index |
Sources (in order): Department of Commerce; Department of Commerce and Institute for Supply Management; Electronic Supply & Manufacturing; Department of Commerce; and IPC.
9
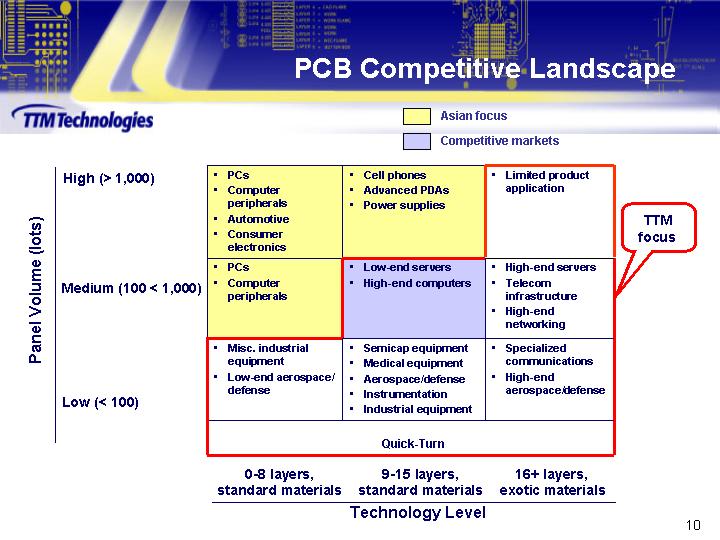
PCB Competitive Landscape
|
Panel Volume (lots) |
|
|
|
|
|
|
|
|
|
|
|
High (> 1,000) |
PCs |
Cell phones |
Limited product application |
|
|
|
Computer peripherals |
Advanced PDAs |
|
|
|
|
Automotive |
Power supplies |
|
|
|
|
Consumer electronics |
|
|
|
|
|
|
|
|
|
|
|
PCs |
Low-end servers |
High-end servers |
|
|
Medium (100 < 1,000) |
Computer peripherals |
High-end computers |
Telecom infrastructure |
TTM focus |
|
|
|
|
High-end networking |
|
|
|
|
|
|
|
|
Low (< 100) |
Misc. industrial equipment Low-end aerospace/defense |
Semicap equipment Medical equipment Aerospace/defense Instrumentation Industrial equipment |
Specialized communications High-end aerospace/defense |
|
|
|
|
Quick-Turn |
|
|
|
|
|
|
|
|
|
0-8 layers, |
|
9-15 layers, |
|
16+ layers, |
|
|
|
|
|
|
|
|
|
Technology Level |
|
|
10
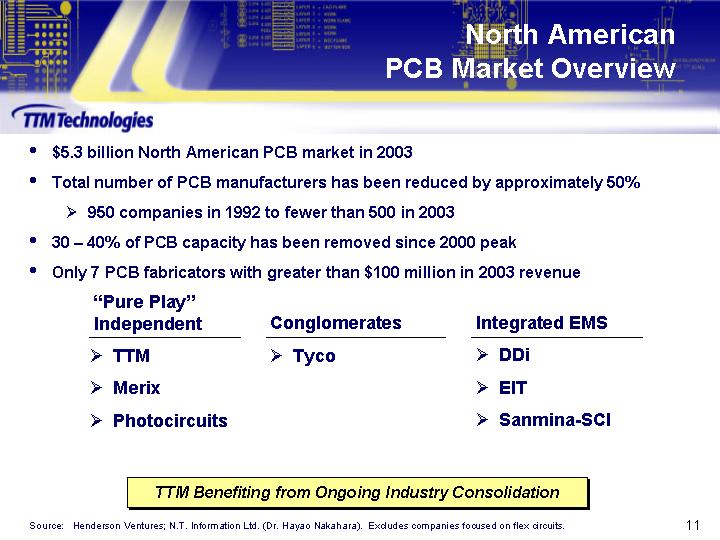
North American PCB Market Overview
$5.3 billion North American PCB market in 2003
Total number of PCB manufacturers has been reduced by approximately 50%
950 companies in 1992 to fewer than 500 in 2003
30 40% of PCB capacity has been removed since 2000 peak
Only 7 PCB fabricators with greater than $100 million in 2003 revenue
|
Pure Play |
|
Conglomerates |
|
Integrated EMS |
|
TTM |
|
Tyco |
|
DDi |
|
Merix |
|
|
|
EIT |
|
Photocircuits |
|
|
|
Sanmina-SCI |
TTM Benefiting from Ongoing Industry Consolidation
Source: Henderson Ventures; N.T. Information Ltd. (Dr. Hayao Nakahara). Excludes companies focused on flex circuits.
11
TTMs Strategy
12
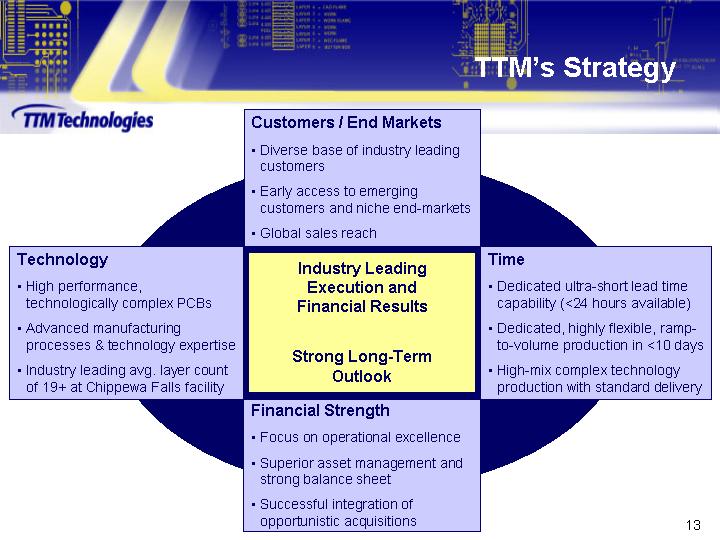
TTMs Strategy
Industry Leading Execution and Financial Results
Strong Long-Term Outlook
Customers / End Markets
Diverse base of industry leading customers
Early access to emerging customers and niche end-markets
Global sales reach
Time
Dedicated ultra-short lead time capability (<24 hours available)
Dedicated, highly flexible, ramp-to-volume production in <10 days
High-mix complex technology production with standard delivery
Financial Strength
Focus on operational excellence
Superior asset management and strong balance sheet
Successful integration of opportunistic acquisitions
Technology
High performance, technologically complex PCBs
Advanced manufacturing processes & technology expertise
Industry leading avg. layer count of 19+ at Chippewa Falls facility
13
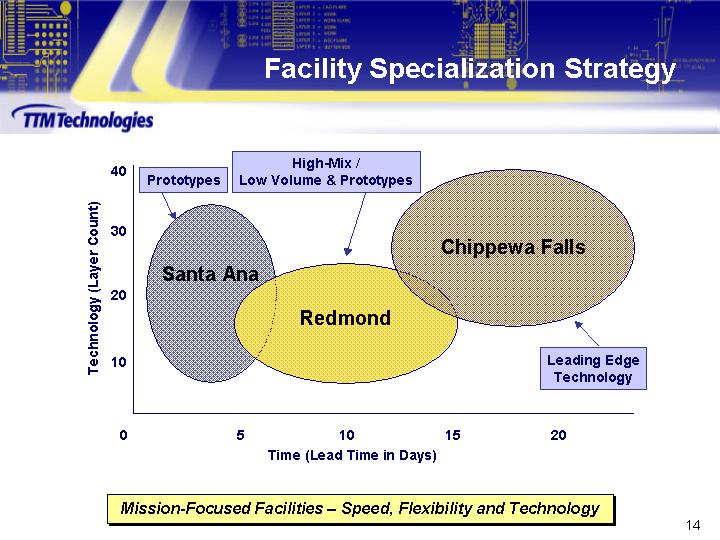
Facility Specialization Strategy
[CHART]
Mission-Focused Facilities Speed, Flexibility and Technology
14
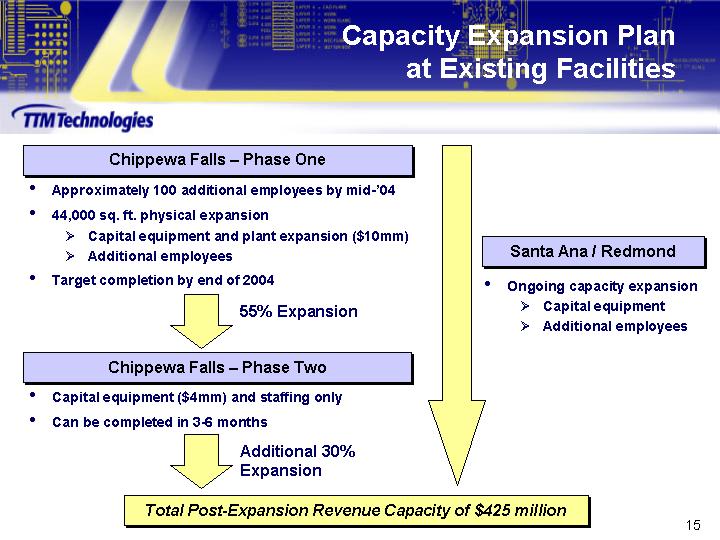
Capacity Expansion Plan at Existing Facilities
|
Chippewa Falls Phase One |
|
|
|
|
Approximately 100 additional employees by mid-04 |
|
|
|
|
44,000 sq. ft. physical expansion |
|
|
|
|
Capital equipment and plant expansion ($10mm) |
|
|
|
|
Additional employees |
|
Santa Ana / Redmond |
|
|
Target completion by end of 2004 |
|
Ongoing capacity expansion |
|
|
55% Expansion |
|
Capital equipment |
|
|
|
|
|
Additional employees |
|
|
|
Chippewa Falls Phase Two |
|
|
|
|
|
Capital equipment ($4mm) and staffing only |
|
|
|
|
|
Can be completed in 3-6 months |
|
|
|
|
|
Additional 30% Expansion |
|
|
|
|
Total Post-Expansion Revenue Capacity of $425 million
15
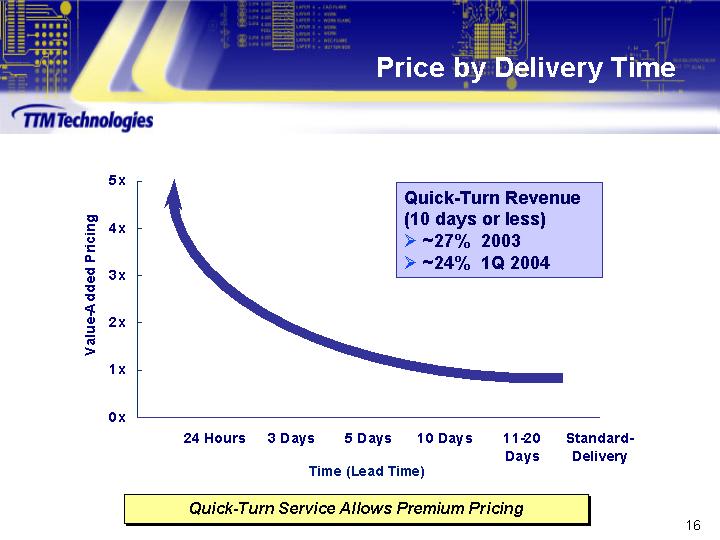
Price by Delivery Time
[CHART]
Quick-Turn Service Allows Premium Pricing
16
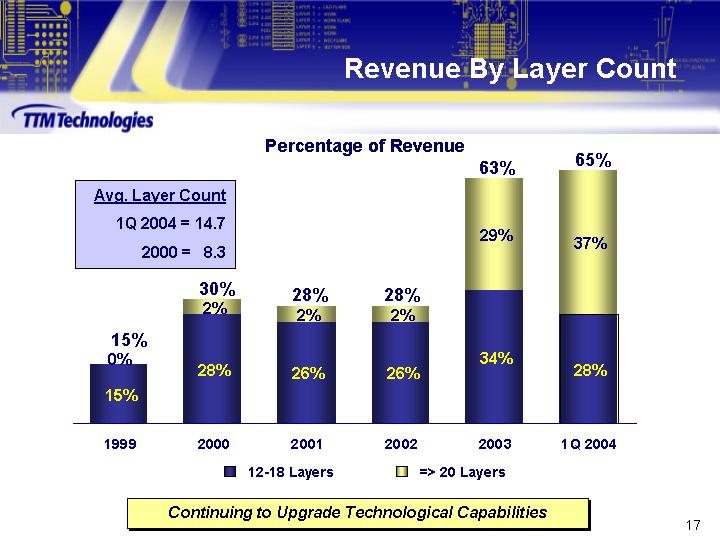
Revenue By Layer Count
Percentage of Revenue
[CHART]
Continuing to Upgrade Technological Capabilities
17
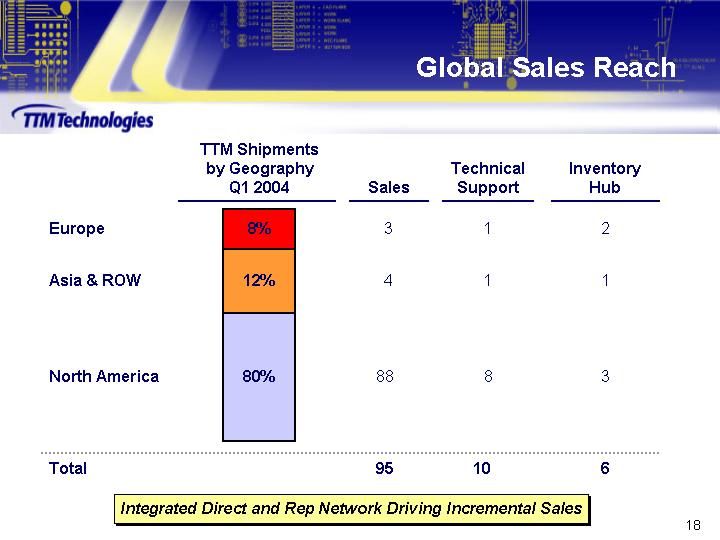
Global Sales Reach
[CHART]
Integrated Direct and Rep Network Driving Incremental Sales
18
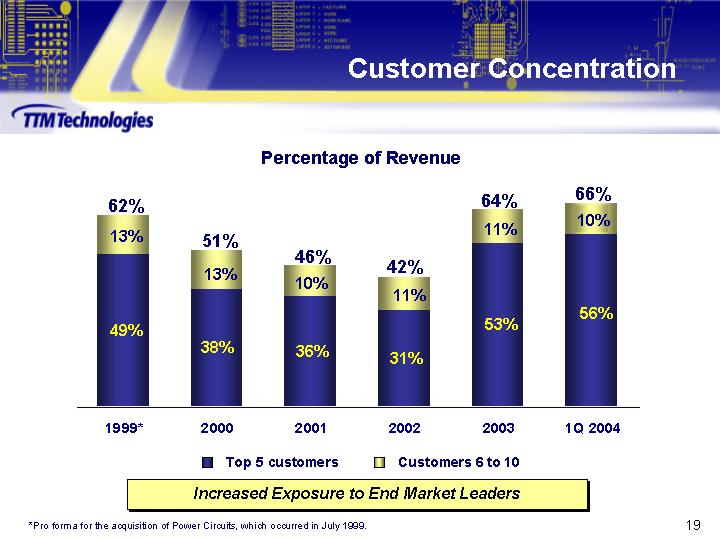
Customer Concentration
Percentage of Revenue
[CHART]
Increased Exposure to End Market Leaders
*Pro forma for the acquisition of Power Circuits, which occurred in July 1999.
19
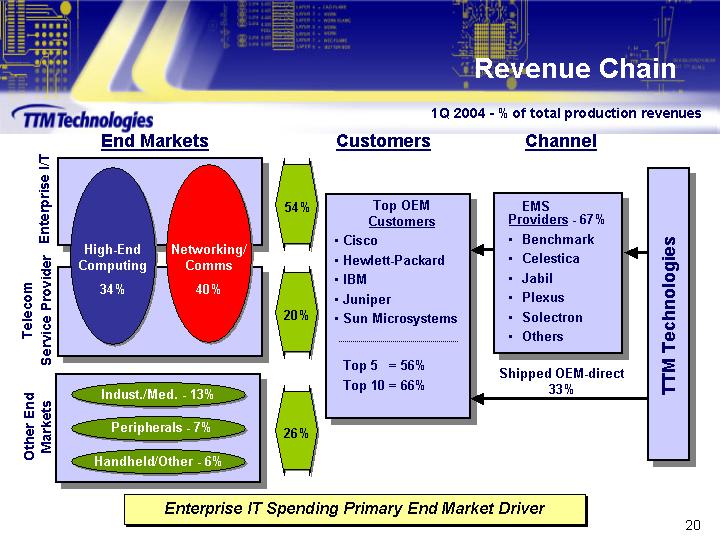
Revenue Chain
1Q 2004 - % of total production revenues
|
|
End Markets |
|
Customers |
|
Channel |
|
|
|
|
|
|
|
|
|
|
|
|
Enterprise I/T |
High-End |
Networking/ |
54% |
Top OEM |
|
EMS |
|
|
|
|
|
|
|
|
|
|
|
Telecom |
34% |
40% |
20% |
Cisco |
|
Benchmark |
TTM Technologies |
|
|
|
|
|
||||
|
Other End |
Indust./Med. - 13% |
26% |
|||||
|
Peripherals - 7% |
|||||||
|
Handheld/Other - 6% |
|||||||
|
|
|
|
|
||||
|
|
|
|
|
|
|
|
|
|
|
|
|
|
Top 5 = 56% |
|
Shipped OEM-direct |
|
Enterprise IT Spending Primary End Market Driver
20
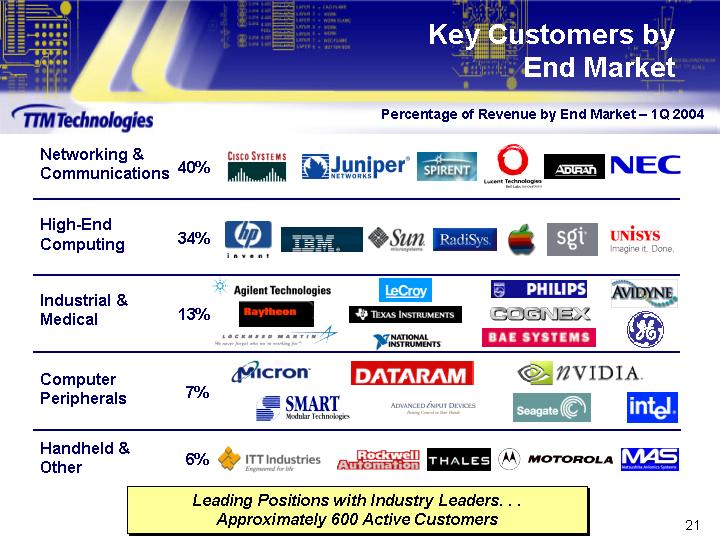
Key Customers by End Market
Percentage of Revenue by End Market 1Q 2004
|
Networking & Communications |
40% |
|
[LOGO] |
|
|
|
|
|
|
High-End Computing |
34% |
|
[LOGO] |
|
|
|
|
|
|
Industrial & Medical |
13% |
|
[LOGO] |
|
|
|
|
|
|
Computer Peripherals |
7% |
|
[LOGO] |
|
|
|
|
|
|
Handheld & Other |
6% |
|
[LOGO] |
Leading Positions with Industry Leaders. . ..
Approximately 600 Active Customers
21
[LOGO]
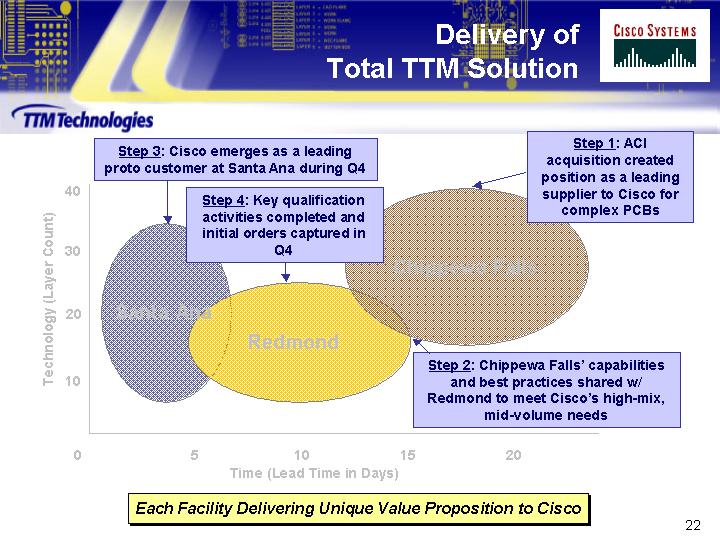
Delivery of Total TTM Solution
[CHART]
Step 1: ACI acquisition created position as a leading supplier to Cisco for complex PCBs
Step 2: Chippewa Falls capabilities and best practices shared w/ Redmond to meet Ciscos high-mix, mid-volume needs
Step 3: Cisco emerges as a leading proto customer at Santa Ana during Q4
Step 4: Key qualification activities completed and initial orders captured in Q4
Each Facility Delivering Unique Value Proposition to Cisco
22
Compelling Growth Opportunities
One-stop manufacturing solution with numerous cross-selling opportunities
Quick-turn capabilities for attracting emerging high-growth customers
Leadership in technology and advanced manufacturing processes
Capacity available through low risk, low cost expansion plan
Successful track record of completing and integrating acquisitions
23
Stacey Peterson
Chief Financial Officer
24
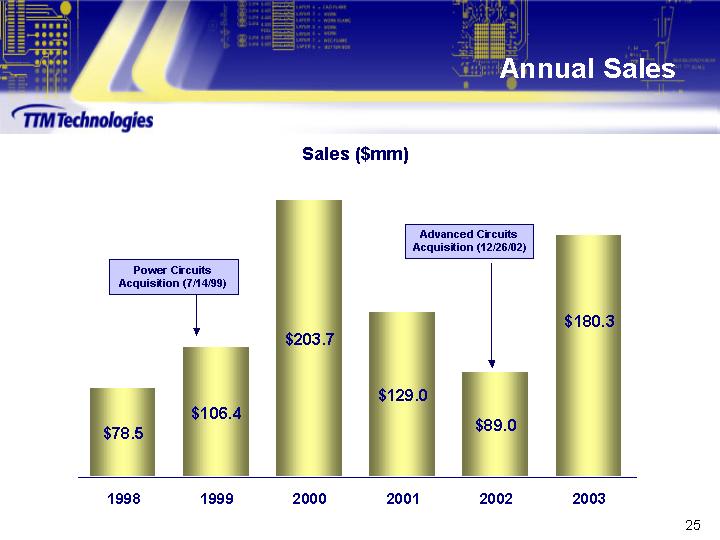
Annual Sales
Sales ($mm)
[CHART]
25
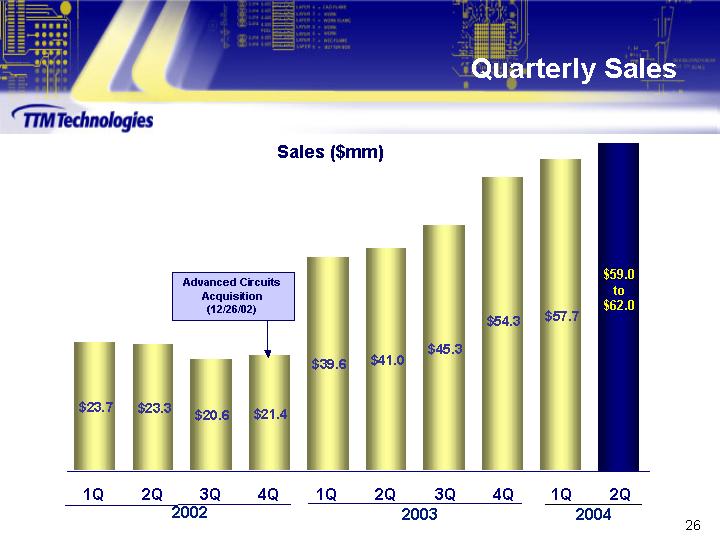
Quarterly Sales
Sales ($mm)
[CHART]
26
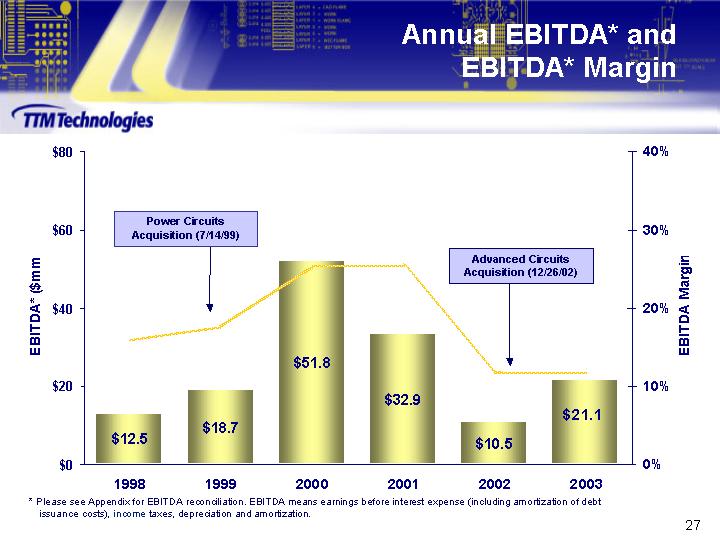
Annual EBITDA* and EBITDA* Margin
[CHART]
* Please see Appendix for EBITDA reconciliation. EBITDA means earnings before interest expense (including amortization of debt issuance costs), income taxes, depreciation and amortization.
27
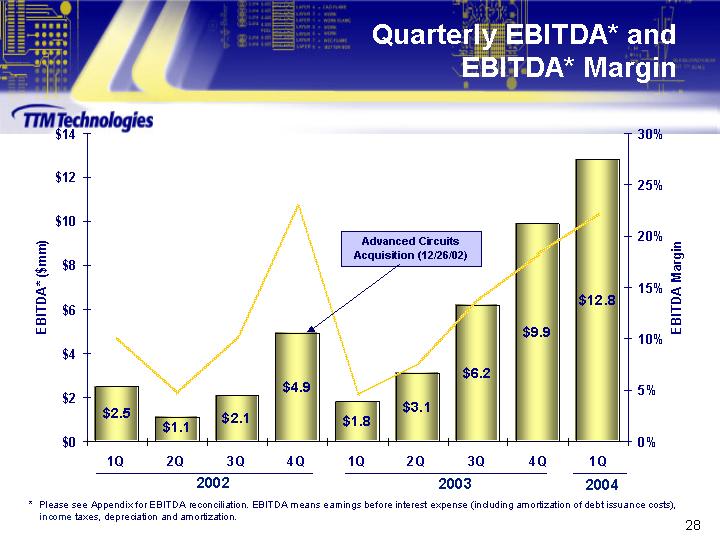
Quarterly EBITDA* and EBITDA* Margin
[CHART]
* Please see Appendix for EBITDA reconciliation. EBITDA means earnings before interest expense (including amortization of debt issuance costs), income taxes, depreciation and amortization.
28
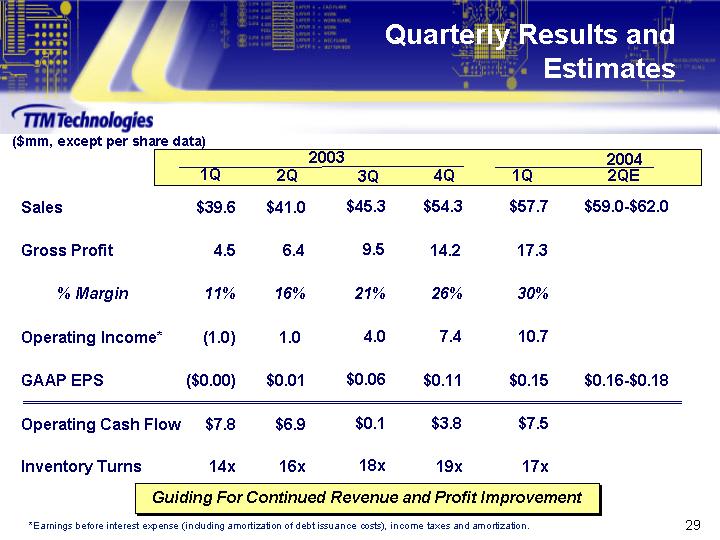
Quarterly Results and Estimates
($mm, except per share data)
|
|
|
2003 |
|
2004 |
|
|||||||||||||
|
|
|
1Q |
|
2Q |
|
3Q |
|
4Q |
|
1Q |
|
2QE |
|
|||||
|
Sales |
|
$ |
39.6 |
|
$ |
41.0 |
|
$ |
45.3 |
|
$ |
54.3 |
|
$ |
57.7 |
|
$59.0-$62.0 |
|
|
|
|
|
|
|
|
|
|
|
|
|
|
|
|
|||||
|
Gross Profit |
|
4.5 |
|
6.4 |
|
9.5 |
|
14.2 |
|
17.3 |
|
|
|
|||||
|
|
|
|
|
|
|
|
|
|
|
|
|
|
|
|||||
|
% Margin |
|
11 |
% |
16 |
% |
21 |
% |
26 |
% |
30 |
% |
|
|
|||||
|
|
|
|
|
|
|
|
|
|
|
|
|
|
|
|||||
|
Operating Income* |
|
(1.0 |
) |
1.0 |
|
4.0 |
|
7.4 |
|
10.7 |
|
|
|
|||||
|
|
|
|
|
|
|
|
|
|
|
|
|
|
|
|||||
|
GAAP EPS |
|
$ |
(0.00 |
) |
$ |
0.01 |
|
$ |
0.06 |
|
$ |
0.11 |
|
$ |
0.15 |
|
$0.16-$0.18 |
|
|
|
|
|
|
|
|
|
|
|
|
|
|
|
|
|||||
|
Operating Cash Flow |
|
$ |
7.8 |
|
$ |
6.9 |
|
$ |
0.1 |
|
$ |
3.8 |
|
$ |
7.5 |
|
|
|
|
|
|
|
|
|
|
|
|
|
|
|
|
|
|
|||||
|
Inventory Turns |
|
14 |
x |
16 |
x |
18 |
x |
19 |
x |
17 |
x |
|
|
|||||
Guiding For Continued Revenue and Profit Improvement
*Earnings before interest expense (including amortization of debt issuance costs), income taxes and amortization.
29
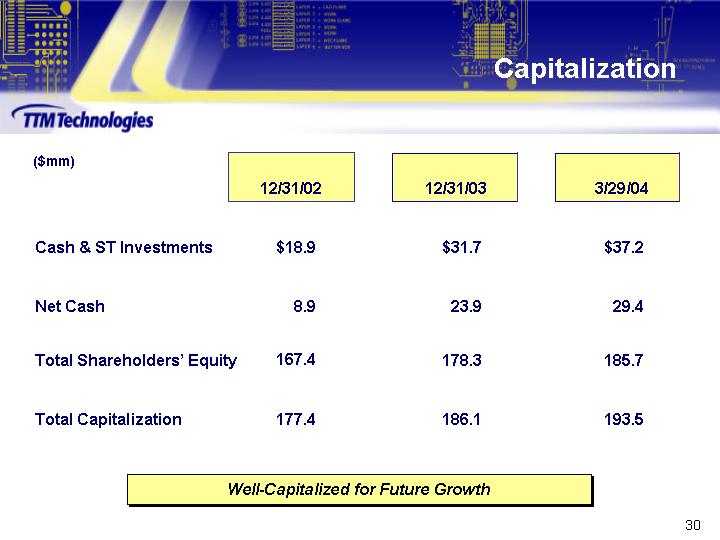
Capitalization
($mm)
|
|
|
12/31/02 |
|
12/31/03 |
|
3/29/04 |
|
|||
|
|
|
|
|
|
|
|
|
|||
|
Cash & ST Investments |
|
$ |
18.9 |
|
$ |
31.7 |
|
$ |
37.2 |
|
|
|
|
|
|
|
|
|
|
|||
|
Net Cash |
|
8.9 |
|
23.9 |
|
29.4 |
|
|||
|
|
|
|
|
|
|
|
|
|||
|
Total Shareholders Equity |
|
167.4 |
|
178.3 |
|
185.7 |
|
|||
|
|
|
|
|
|
|
|
|
|||
|
Total Capitalization |
|
177.4 |
|
186.1 |
|
193.5 |
|
|||
Well-Capitalized for Future Growth
30
Conclusion
Solid industry fundamentals
Focused strategy and strong market position
Demonstrated execution excellence
Industry leading financial performance
31
[GRAPHIC]
[LOGO]
32
Appendix
Appendix
33
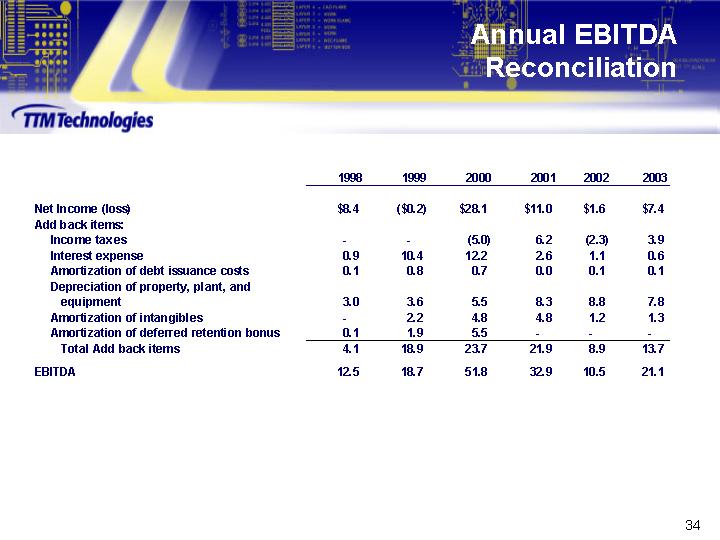
Annual EBITDA Reconciliation
|
|
|
1998 |
|
1999 |
|
2000 |
|
2001 |
|
2002 |
|
2003 |
|
||||||
|
|
|
|
|
|
|
|
|
|
|
|
|
|
|
||||||
|
Net Income (loss) |
|
$ |
8.4 |
|
$ |
(0.2 |
) |
$ |
28.1 |
|
$ |
11.0 |
|
$ |
1.6 |
|
$ |
7.4 |
|
|
Add back items: |
|
|
|
|
|
|
|
|
|
|
|
|
|
||||||
|
Income taxes |
|
|
|
|
|
(5.0 |
) |
6.2 |
|
(2.3 |
) |
3.9 |
|
||||||
|
Interest expense |
|
0.9 |
|
10.4 |
|
12.2 |
|
2.6 |
|
1.1 |
|
0.6 |
|
||||||
|
Amortization of debt issuance costs |
|
0.1 |
|
0.8 |
|
0.7 |
|
0.0 |
|
0.1 |
|
0.1 |
|
||||||
|
Depreciation of property, plant, and equipment |
|
3.0 |
|
3.6 |
|
5.5 |
|
8.3 |
|
8.8 |
|
7.8 |
|
||||||
|
Amortization of intangibles |
|
|
|
2.2 |
|
4.8 |
|
4.8 |
|
1.2 |
|
1.3 |
|
||||||
|
Amortization of deferred retention bonus |
|
0.1 |
|
1.9 |
|
5.5 |
|
|
|
|
|
|
|
||||||
|
Total Add back items |
|
4.1 |
|
18.9 |
|
23.7 |
|
21.9 |
|
8.9 |
|
13.7 |
|
||||||
|
EBITDA |
|
12.5 |
|
18.7 |
|
51.8 |
|
32.9 |
|
10.5 |
|
21.1 |
|
||||||
34
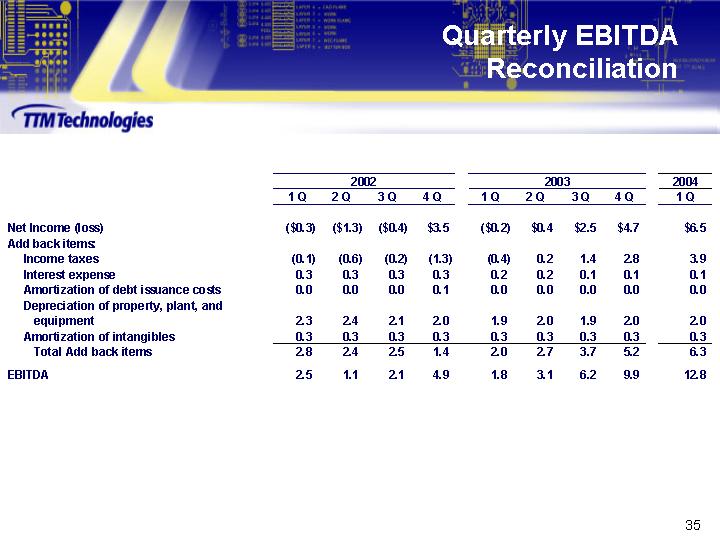
Quarterly EBITDA Reconciliation
|
|
|
2002 |
|
2003 |
|
2004 |
|
|||||||||||||||||||||
|
|
|
1 Q |
|
2 Q |
|
3 Q |
|
4 Q |
|
1 Q |
|
2 Q |
|
3 Q |
|
4 Q |
|
1 Q |
|
|||||||||
|
|
|
|
|
|
|
|
|
|
|
|
|
|
|
|
|
|
|
|
|
|||||||||
|
Net Income (loss) |
|
$ |
(0.3 |
) |
$ |
(1.3 |
) |
$ |
(0.4 |
) |
$ |
3.5 |
|
$ |
(0.2 |
) |
$ |
0.4 |
|
$ |
2.5 |
|
$ |
4.7 |
|
$ |
6.5 |
|
|
Add back items: |
|
|
|
|
|
|
|
|
|
|
|
|
|
|
|
|
|
|
|
|||||||||
|
Income taxes |
|
(0.1 |
) |
(0.6 |
) |
(0.2 |
) |
(1.3 |
) |
(0.4 |
) |
0.2 |
|
1.4 |
|
2.8 |
|
3.9 |
|
|||||||||
|
Interest expense |
|
0.3 |
|
0.3 |
|
0.3 |
|
0.3 |
|
0.2 |
|
0.2 |
|
0.1 |
|
0.1 |
|
0.1 |
|
|||||||||
|
Amortization of debt issuance costs |
|
0.0 |
|
0.0 |
|
0.0 |
|
0.1 |
|
0.0 |
|
0.0 |
|
0.0 |
|
0.0 |
|
0.0 |
|
|||||||||
|
Depreciation of property, plant, and equipment |
|
2.3 |
|
2.4 |
|
2.1 |
|
2.0 |
|
1.9 |
|
2.0 |
|
1.9 |
|
2.0 |
|
2.0 |
|
|||||||||
|
Amortization of intangibles |
|
0.3 |
|
0.3 |
|
0.3 |
|
0.3 |
|
0.3 |
|
0.3 |
|
0.3 |
|
0.3 |
|
0.3 |
|
|||||||||
|
Total Add back items |
|
2.8 |
|
2.4 |
|
2.5 |
|
1.4 |
|
2.0 |
|
2.7 |
|
3.7 |
|
5.2 |
|
6.3 |
|
|||||||||
|
EBITDA |
|
2.5 |
|
1.1 |
|
2.1 |
|
4.9 |
|
1.8 |
|
3.1 |
|
6.2 |
|
9.9 |
|
12.8 |
|
|||||||||
35