EX-99.1
Published on January 9, 2004
Exhibit 99.1

Link to searchable text of slide shown above
Link to searchable text of slide shown above

Link to searchable text of slide shown above

Link to searchable text of slide shown above
Link to searchable text of slide shown above

Link to searchable text of slide shown above

Link to searchable text of slide shown above

Link to searchable text of slide shown above

Link to searchable text of slide shown above
Link to searchable text of slide shown above
Link to searchable text of slide shown above

Link to searchable text of slide shown above

Link to searchable text of slide shown above

Link to searchable text of slide shown above

Link to searchable text of slide shown above
Link to searchable text of slide shown above

Link to searchable text of slide shown above
Link to searchable text of slide shown above
Link to searchable text of slide shown above
Link to searchable text of slide shown above
Link to searchable text of slide shown above

Link to searchable text of slide shown above
Link to searchable text of slide shown above
Link to searchable text of slide shown above

Link to searchable text of slide shown above
Link to searchable text of slide shown above
Link to searchable text of slide shown above
Link to searchable text of slide shown above
Link to searchable text of slide shown above
Link to searchable text of slide shown above
Link to searchable text of slide shown above

Link to searchable text of slide shown above

Link to searchable text of slide shown above
Searchable text section of graphics shown above
[LOGO]
TTM Technologies
Needham & Company Growth Conference
January 8, 2004
Safe Harbor Provision
[LOGO]
During the course of this presentation, we will make projections or other forward-looking statements regarding future events or the future financial performance of the Company. We wish to caution you that such statements reflect only our current expectations, and that actual events or results may differ materially.
We refer you to the risk factors and cautionary language contained in the documents that the Company files from time to time with the Securities and Exchange Commission, specifically the Companys most recent S-3 Registration Statement. Such documents contain and identify important factors that could cause the actual results to differ materially from those contained in our projections or forward-looking statements. We undertake no obligation to update such projections or such forward-looking statements in the future.
Kent Alder
President
and
Chief Executive Officer
Company Overview
TTM is a leading provider of time-critical and
technologically complex printed circuit
boards to the worlds leading electronic equipment designers and manufacturers
[GRAPHIC]
Pure Play printed circuit board (PCB) manufacturer
Focused on time (24 hrs to 10 days) & technology service segments
Three integrated, mission focused production facilities:
Santa Ana, CA
Redmond, WA
Chippewa Falls, WI
$126 million in YTD 2003* sales
1,367 employees
*Through Q3 2003.
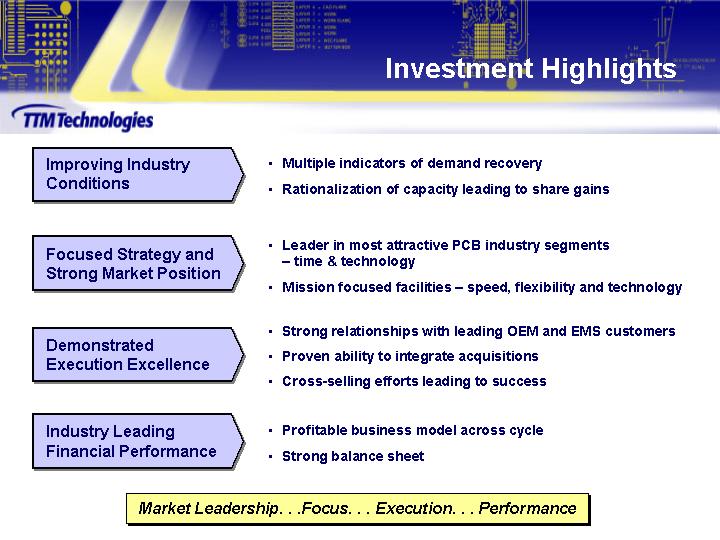
Investment Highlights
|
Improving Industry |
Multiple indicators of demand recovery |
|
Rationalization of capacity leading to share gains |
|
|
|
|
|
Focused Strategy and |
Leader in most attractive PCB industry segments time & technology |
|
Mission focused facilities speed, flexibility and technology |
|
|
|
|
|
Demonstrated |
Strong relationships with leading OEM and EMS customers |
|
Proven ability to integrate acquisitions |
|
|
Cross-selling efforts leading to success |
|
|
|
|
|
Industry Leading |
Profitable business model across cycle |
|
Strong balance sheet |
Market Leadership. . .Focus. . . Execution. .. . Performance
Attractiveness of
Time & Technology Strategy
|
Growth |
Early access to new customers with high-growth potential |
|
Key supplier to high-growth programs within market leaders |
|
|
Critical service for new product introduction across multiple industries |
|
|
|
|
|
Limited Competition |
Difficult business model to replicate |
|
Significant technology expertise and investment required |
|
|
Quick-turn, high-mix production subject to less competition |
|
|
|
|
|
Performance |
Time and technology focus allows premium pricing |
|
Leads to superior margins and profitability |
Consistent Strategic Focus Driving Growth and Profitability
Industry Overview
Industry Dynamics and
Key Success Factors
|
Current Industry Dynamics |
|
Key Success Factors |
|
|
|
|
|
Key indicators of industry recovery solidifying |
|
Capacity in place for complex products and short lead times |
|
|
|
|
|
High volume, low-mix production transitioning to Asia |
|
Focus on quick-turn, high-mix and technology limits foreign competition |
|
|
[GRAPHIC] |
|
|
Significant consolidation of North American capacity |
|
Well-capitalized firms with targeted strategy gaining share |
|
|
|
|
|
Financial performance of several key players remains uncertain |
|
Financial strength and stability drives customer confidence |
TTM is Positioned to Capitalize on Industry Trends
PCB Competitive Landscape
|
|
|
|
Most susceptible to Asian competition |
|
|
|
|
Competitive markets |
Panel Volume (lots)
|
High (> 1,000) |
|
PCs |
|
Cell phones |
|
Limited
product |
|
|
|
Computer peripherals |
|
Advanced PDAs |
|
|||
|
|
Automotive |
|
Power supplies |
|
|
||
|
|
Consumer |
|
|
|
|
||
|
|
|
|
|
|
|
|
|
|
Medium (100 < 1,000) |
|
PCs |
|
Low-end servers |
|
High-end servers |
TTM |
|
|
Computer |
|
High-end computers |
|
Telecom |
||
|
|
|
|
|
High-end |
|||
|
|
|
|
|
|
|
|
|
|
Low (< 100) |
|
Misc.
industrial |
|
Semicap equipment |
|
Specialized |
|
|
|
|
Medical equipment |
|
||||
|
|
Low-end
aerospace/ |
|
Aerospace/defense |
|
High-end |
||
|
|
|
Instrumentation |
|
||||
|
|
|
|
Industrial equipment |
|
|
||
|
|
|
|
|
|
|
|
|
|
Quick-Turn |
|||||||
|
0-8 layers, |
|
9-15
layers, |
|
16+
layers, |
|
|
|
Technology Level |
|
|
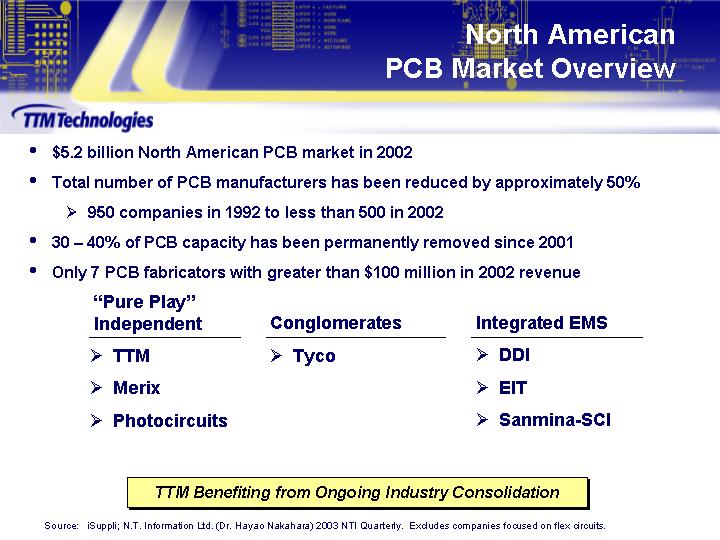
North American
PCB Market Overview
$5.2 billion North American PCB market in 2002
Total number of PCB manufacturers has been reduced by approximately 50%
950 companies in 1992 to less than 500 in 2002
30 40% of PCB capacity has been permanently removed since 2001
Only 7 PCB fabricators with greater than $100 million in 2002 revenue
|
Pure Play |
|
Conglomerates |
|
Integrated EMS |
|||
|
|
TTM |
|
|
Tyco |
|
|
DDI |
|
|
Merix |
|
|
|
|
|
EIT |
|
|
Photocircuits |
|
|
|
|
|
Sanmina-SCI |
TTM Benefiting from Ongoing Industry Consolidation
Source: iSuppli; N.T. Information Ltd. (Dr. Hayao Nakahara) 2003 NTI Quarterly. Excludes companies focused on flex circuits.
Impact of Broad-Based
Capacity Reductions
|
Capturing Programs from Factory Closures |
|
Closures facilitating market share gains |
|
|
Increasing customer attention to supplier viability |
|
|
|
|
|
|
Extending Industry Lead Times |
|
Competitors extending lead times |
|
|
TTM enjoying share capture and spot orders due to superior cycle times and responsiveness |
|
|
|
|
|
|
Increasing Order Velocity |
|
Average PCB industry book-to-bill exceeds parity for 2003 |
|
|
Daily order rates highest of the year thru Q4 |
|
|
|
|
|
|
Firming Price Environment |
|
Improving complexity and mix key new programs ramping |
|
|
Quick-turn pricing strengthening |
Environment of Tighter Capacity Benefits Survivors
End Market Indicators
Improving on Multiple Fronts
|
Electronic Equipment Orders & Inventory |
[GRAPHIC] |
Favorable |
|
Double digit order growth year-to-date |
||
|
Inventory-to-Order ratio below pre-boom levels |
||
|
|
|
|
|
Infrastructure Spending |
[GRAPHIC] |
Favorable |
|
High end (10 Gbps) router market +10% |
||
|
Service provider router market +6% |
||
|
|
|
|
|
Electronics Buyers Index (EBI) |
[GRAPHIC] |
Neutral and Improving |
|
November 03 is highest in nearly three years |
||
|
Leading indicators slightly short of expansionary threshold |
||
|
|
|
|
|
Electronic Equipment Book-to-Bill |
[GRAPHIC] |
Favorable |
|
Greater than parity all year |
||
|
Strong end market orders, lower supply chain inventory |
||
|
|
|
|
|
PCB Book-to-Bill |
[GRAPHIC] |
Favorable TTM Outperforming |
|
Six consecutive months in excess of parity |
||
|
TTM book-to-bill stronger than broader index |
Source: Department of Commerce, Dell Oro, Electronic Buyers News, Gartner Dataquest and IPC.
TTMs Strategy
TTMs Strategy
|
|
Customers / End Markets |
|
|
|
|
Diverse base of industry leading customers |
|
|
|
|
|
|
|
|
|
Early access to emerging customers and niche end-markets |
|
|
|
|
|
|
|
|
|
Global sales reach |
|
|
|
|
|
|
|
|
Technology |
|
Time |
|
|
Industry Leading |
|||
|
High performance, technologically complex PCBs |
Dedicated ultra-short lead time capability (<24 hours available) |
|
|
|
Advanced manufacturing processes & technology expertise |
|
Dedicated, highly flexible, ramp-to-volume production in <10 days |
|
|
Industry leading avg. layer count of 18+ at Chippewa Falls facility |
Strong Long-Term |
High-mix complex technology production with standard delivery |
|
|
|
|
|
|
|
|
Financial Strength |
|
|
|
|
|
|
|
|
|
Focus on operational excellence |
|
|
|
|
|
|
|
|
|
Superior asset
management and |
|
|
|
|
|
|
|
|
|
Successful
integration of |
|
|
Facility Specialization Strategy
[CHART]
Mission Focused Facilities Speed, Flexibility and Technology
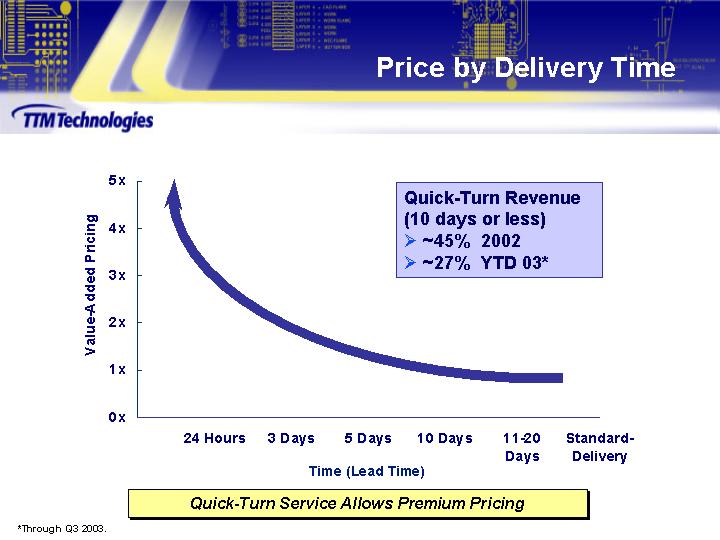
Price by Delivery Time
[CHART]
Quick-Turn Service Allows Premium Pricing
*Through Q3 2003.
Revenue By Layer Count
Percentage of Revenue
[CHART]
Continuing to Upgrade Technological Capabilities
* Through Q3 2003.
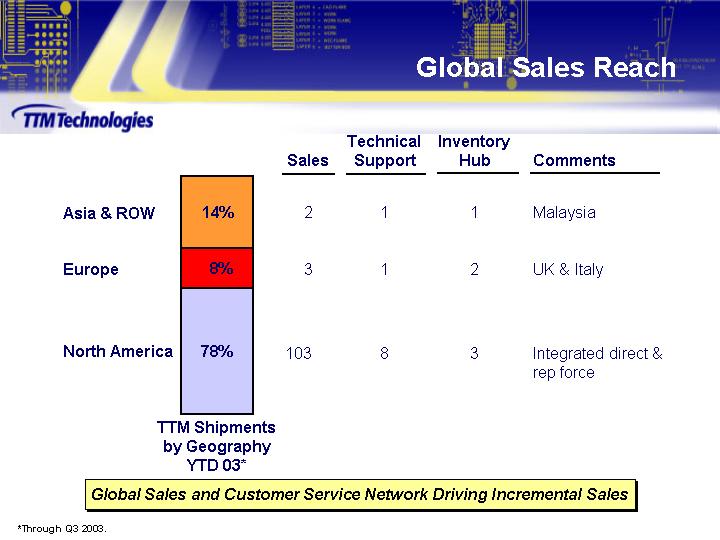
Global Sales Reach
|
|
|
TTM Shipments |
|
Sales |
|
Technical |
|
Inventory |
|
Comments |
|
|
|
|
|
|
|
|
|
|
|
|
|
|
|
Asia & ROW |
|
14 |
% |
2 |
|
1 |
|
1 |
|
Malaysia |
|
|
|
|
|
|
|
|
|
|
|
|
|
|
|
Europe |
|
8 |
% |
3 |
|
1 |
|
2 |
|
UK & Italy |
|
|
|
|
|
|
|
|
|
|
|
|
|
|
|
North America |
|
78 |
% |
103 |
|
8 |
|
3 |
|
Integrated direct & rep force |
|
Global Sales and Customer Service Network Driving Incremental Sales
* Through Q3 2003.
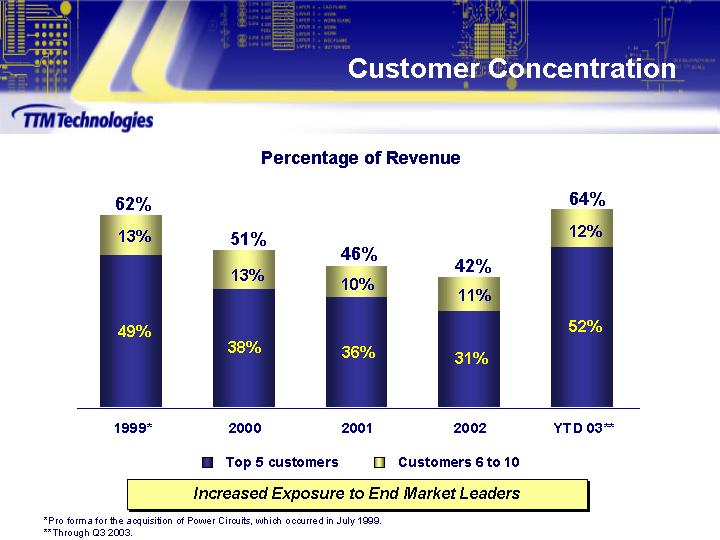
Customer Concentration
Percentage of Revenue
[CHART]
Increased Exposure to End Market Leaders
* Pro forma for the acquisition of Power Circuits, which occurred in July 1999.
** Through Q3 2003.
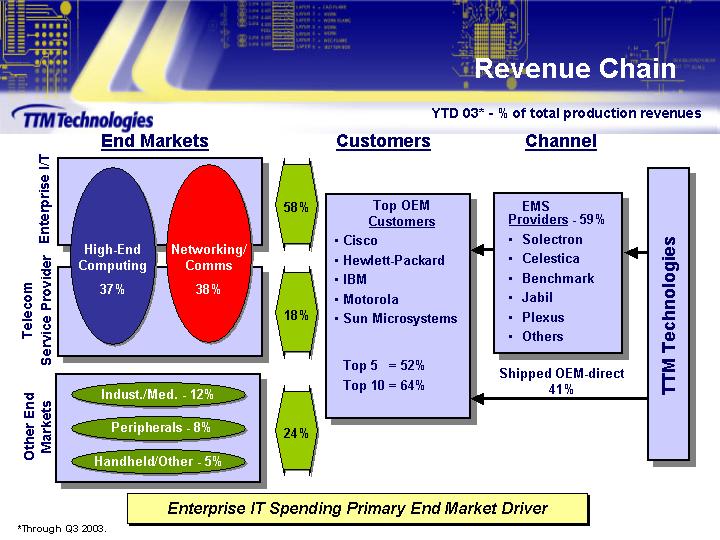
Revenue Chain
YTD 03* - % of total production revenues
|
End Markets |
|
|
|
Customers |
|
Channel |
|
|
|||
|
|
|
|
|
Enterprise I/T |
|
Top OEM |
|
EMS |
|
|
|
|
High-End |
|
Networking/ |
|
Telecom Service |
|
Cisco |
|
Solectron |
|
|
|
|
37% |
|
38% |
|
18% |
|
Hewlett-Packard |
< |
Celestica |
|
|
|
|
|
|
|
|
|
|
IBM |
|
Benchmark |
< |
TTM Technologies |
|
|
Indust./Med. - 12% |
|
|
|
Motorola |
|
Jabil |
|
|
|||
|
Peripherals - 8% |
|
Other End Markets |
|
Sun Microsystems |
|
Plexus |
|
|
|||
|
Handheld/Other - 5% |
|
24% |
|
|
|
Others |
|
|
|||
|
|
|
|
|
Top 5 = 52% |
|
|
|
|
|||
|
|
|
|
|
|
|
Shipped OEM-direct |
|
|
|||
|
|
|
|
|
Top 10 = 64% |
|
41% |
|
|
|||
Enterprise IT Spending Primary End Market Driver
* Through Q3 2003.
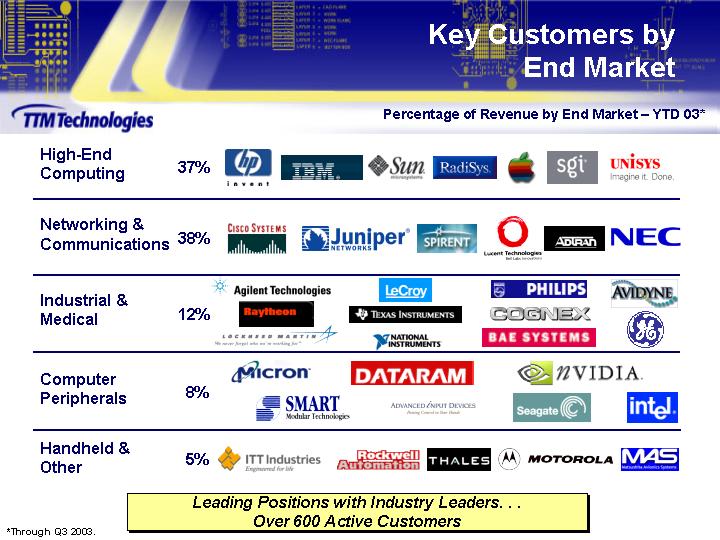
Key Customers by End Market
Percentage of Revenue by End Market YTD 03*
|
High-End Computing |
37 |
% |
[LOGO] |
|
|
|
|
|
|
|
|
Networking & Communications |
38 |
% |
[LOGO] |
|
|
|
|
|
|
|
|
Industrial & Medical |
12 |
% |
[LOGO] |
|
|
|
|
|
|
|
|
Computer Peripherals |
8 |
% |
[LOGO] |
|
|
|
|
|
|
|
|
Handheld & Other |
5 |
% |
[LOGO] |
|
Leading Positions with Industry Leaders. . .
Over 600 Active Customers
*Through Q3 2003.
[LOGO]
Delivery of Total TTM Solution
[CHART]
Each Facility Delivering Unique Value Proposition to Cisco
Compelling Growth Opportunities
Leverage one-stop manufacturing solution through cross-selling
Use quick-turn capabilities to attract emerging high-growth customers
Continue to improve technology and manufacturing processes
Expand into niche markets through internal initiatives and acquisitions
Stacey Peterson
Chief Financial Officer
Annual Sales
Sales ($mm)
[CHART]
*Through Q3 2003.
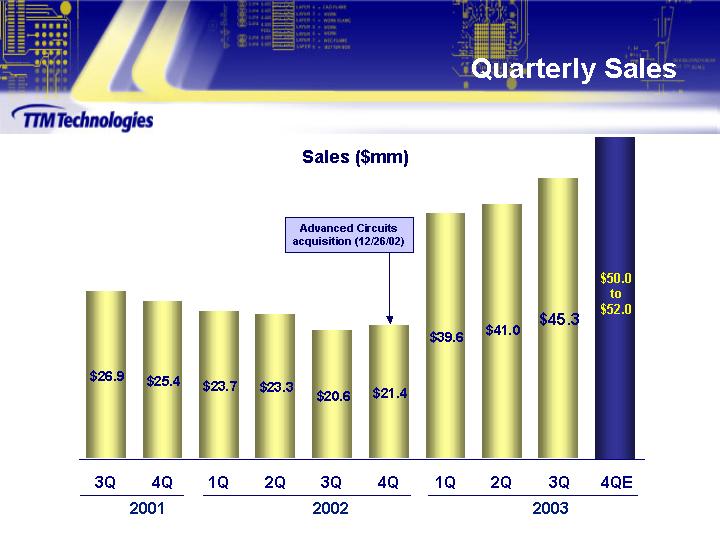
Quarterly Sales
Sales ($mm)
[CHART]
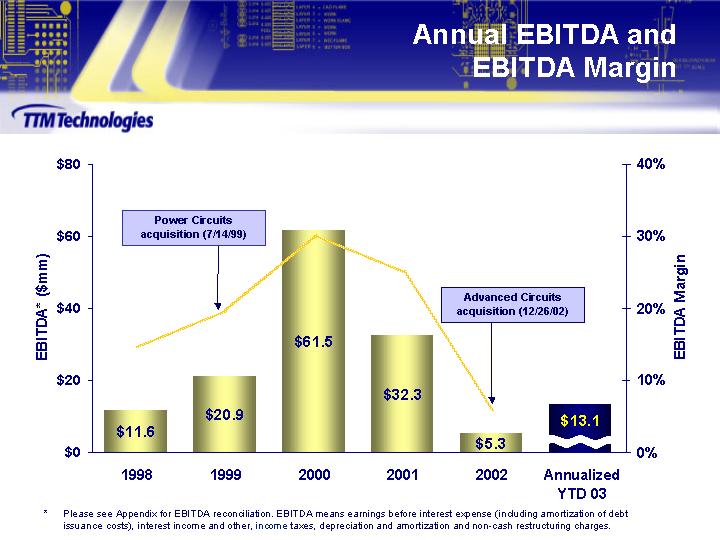
Annual
EBITDA and
EBITDA Margin
[CHART]
* Please see Appendix for EBITDA reconciliation. EBITDA means earnings before interest expense (including amortization of debt issuance costs), interest income and other, income taxes, depreciation and amortization and non-cash restructuring charges.
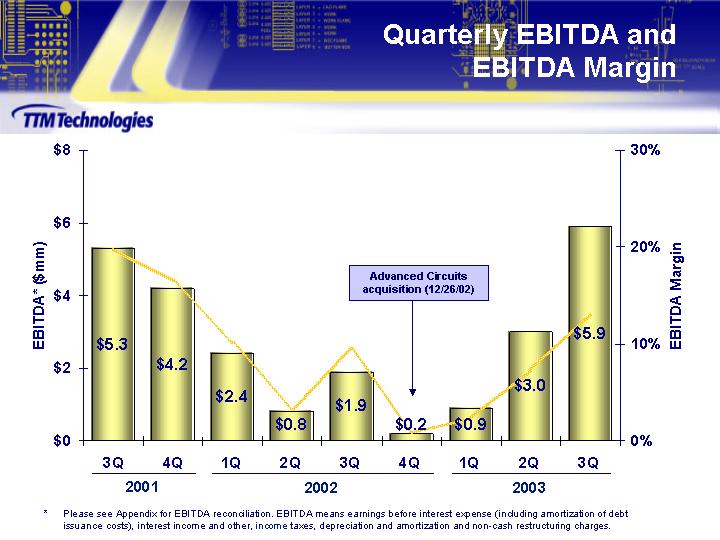
Quarterly
EBITDA and
EBITDA Margin
[CHART]
* Please see Appendix for EBITDA reconciliation. EBITDA means earnings before interest expense (including amortization of debt issuance costs), interest income and other, income taxes, depreciation and amortization and non-cash restructuring charges.
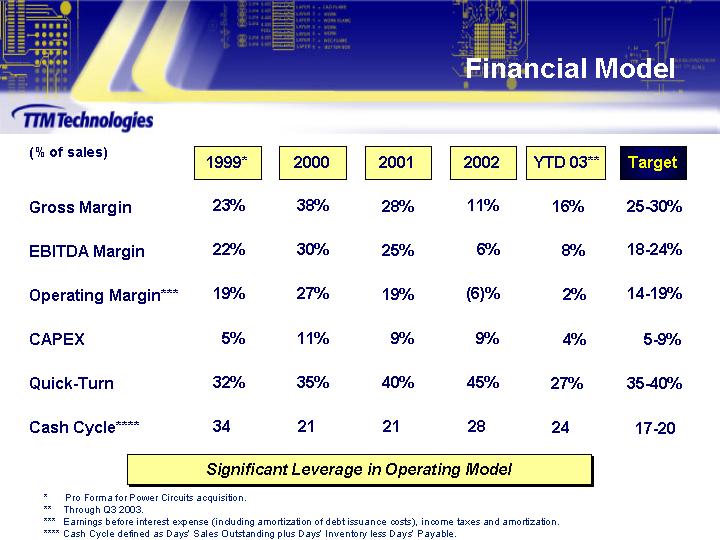
Financial Model
|
(% of sales) |
|
1999* |
|
2000 |
|
2001 |
|
2002 |
|
YTD 03** |
|
Target |
|
|
|
|
|
|
|
|
|
|
|
|
|
|
|
|
|
Gross Margin |
|
23 |
% |
38 |
% |
28 |
% |
11 |
% |
16 |
% |
25-30 |
% |
|
|
|
|
|
|
|
|
|
|
|
|
|
|
|
|
EBITDA Margin |
|
22 |
% |
30 |
% |
25 |
% |
6 |
% |
8 |
% |
18-24 |
% |
|
|
|
|
|
|
|
|
|
|
|
|
|
|
|
|
Operating Margin*** |
|
19 |
% |
27 |
% |
19 |
% |
(6 |
)% |
2 |
% |
14-19 |
% |
|
|
|
|
|
|
|
|
|
|
|
|
|
|
|
|
CAPEX |
|
5 |
% |
11 |
% |
9 |
% |
9 |
% |
4 |
% |
5-9 |
% |
|
|
|
|
|
|
|
|
|
|
|
|
|
|
|
|
Quick-Turn |
|
32 |
% |
35 |
% |
40 |
% |
45 |
% |
27 |
% |
35-40 |
% |
|
|
|
|
|
|
|
|
|
|
|
|
|
|
|
|
Cash Cycle**** |
|
34 |
|
21 |
|
21 |
|
28 |
|
24 |
|
17-20 |
|
Significant Leverage in Operating Model
|
* |
|
Pro Forma for Power Circuits acquisition. |
|
** |
|
Through Q3 2003. |
|
*** |
|
Earnings before interest expense (including amortization of debt issuance costs), income taxes and amortization. |
|
**** |
|
Cash Cycle defined as Days Sales Outstanding plus Days Inventory less Days Payable. |
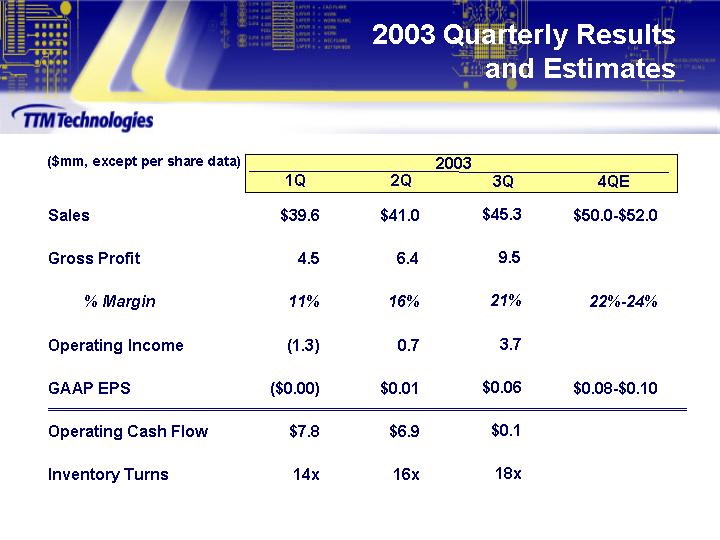
2003 Quarterly
Results
and Estimates
|
|
|
2003 |
|
|||||||||
|
($mm, except per share data) |
|
1Q |
|
2Q |
|
3Q |
|
4QE |
|
|||
|
Sales |
|
$ |
39.6 |
|
$ |
41.0 |
|
$ |
45.3 |
|
$50.0-$52.0 |
|
|
|
|
|
|
|
|
|
|
|
|
|||
|
Gross Profit |
|
4.5 |
|
6.4 |
|
9.5 |
|
|
|
|||
|
|
|
|
|
|
|
|
|
|
|
|||
|
% Margin |
|
11 |
% |
16 |
% |
21 |
% |
22%-24% |
|
|||
|
|
|
|
|
|
|
|
|
|
|
|||
|
Operating Income |
|
(1.3 |
) |
0.7 |
|
3.7 |
|
|
|
|||
|
|
|
|
|
|
|
|
|
|
|
|||
|
GAAP EPS |
|
$ |
(0.00 |
) |
$ |
0.01 |
|
$ |
0.06 |
|
$0.08-$0.10 |
|
|
|
|
|
|
|
|
|
|
|
|
|||
|
Operating Cash Flow |
|
$ |
7.8 |
|
$ |
6.9 |
|
$ |
0.1 |
|
|
|
|
|
|
|
|
|
|
|
|
|
|
|||
|
Inventory Turns |
|
14 |
x |
16 |
x |
18 |
x |
|
|
|||
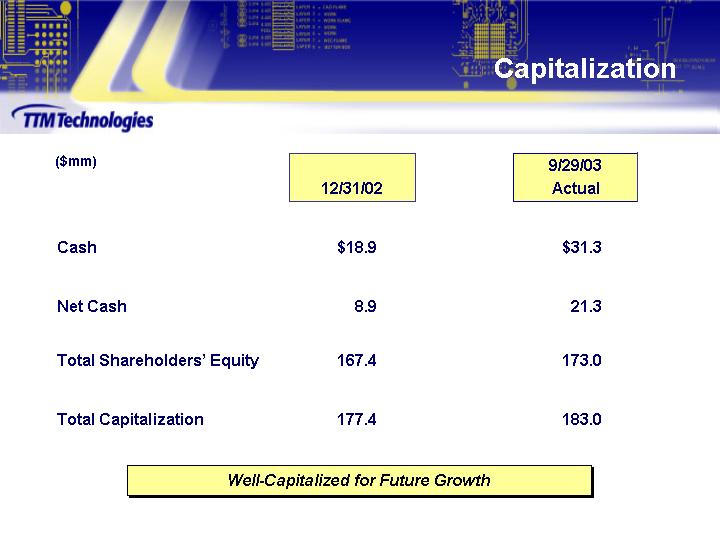
Capitalization
|
($mm) |
|
12/31/02 |
|
9/29/03 |
|
||
|
|
|
|
|
|
|
||
|
Cash |
|
$ |
18.9 |
|
$ |
31.3 |
|
|
|
|
|
|
|
|
||
|
Net Cash |
|
8.9 |
|
21.3 |
|
||
|
|
|
|
|
|
|
||
|
Total Shareholders Equity |
|
167.4 |
|
173.0 |
|
||
|
|
|
|
|
|
|
||
|
Total Capitalization |
|
177.4 |
|
183.0 |
|
||
Well-Capitalized for Future Growth
Conclusion
Improving industry conditions
Focused strategy and strong market position
Demonstrated execution excellence
Industry leading financial performance
[LOGO]