EX-99.1
Published on May 8, 2003
Exhibit 99.1
Link to searchable text of slide shown above
Link to searchable text of slide shown above
Link to searchable text of slide shown above
Link to searchable text of slide shown above
Link to searchable text of slide shown above
Link to searchable text of slide shown above
Link to searchable text of slide shown above
Link to searchable text of slide shown above
Link to searchable text of slide shown above
Link to searchable text of slide shown above
Link to searchable text of slide shown above
Link to searchable text of slide shown above
Link to searchable text of slide shown above
Link to searchable text of slide shown above
Link to searchable text of slide shown above
Link to searchable text of slide shown above
Link to searchable text of slide shown above
Link to searchable text of slide shown above
Link to searchable text of slide shown above
Link to searchable text of slide shown above
Link to searchable text of slide shown above
Link to searchable text of slide shown above
Link to searchable text of slide shown above
Link to searchable text of slide shown above
Link to searchable text of slide shown above
Link to searchable text of slide shown above
Link to searchable text of slide shown above
Link to searchable text of slide shown above
Link to searchable text of slide shown above
Searchable text section of graphics shown above
State of the North American PBC Market
TMRC Conference
May 6, 2003
President
and
Chief Executive Officer
During the course of this presentation, we will make projections or other forward-looking statements regarding future events or the future financial performance of the Company. We wish to caution you that such statements reflect only our current expectations, and that actual events or results may differ materially.
We refer you to the risk factors and cautionary language contained in the documents that the Company files from time to time with the Securities and Exchange Commission, specifically the Companys 10-K for our last fiscal year ended December 31, 2002. Such documents contain and identify important factors that could cause the actual results to differ materially from those contained in our projections or forward-looking statements. We undertake no obligation to update such projections or such forward-looking statements in the future.
For your convenient reference, a copy of this presentation on Form 8-K has been filed with the Securities and Exchange Commission and will be posted on our website.
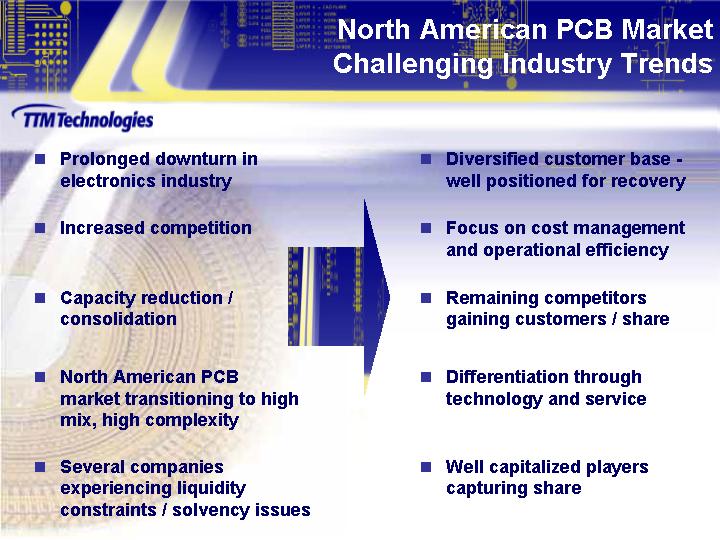
North
American PCB Market
Challenging Industry Trends
|
|
Prolonged downturn in electronics industry |
|
Diversified customer base well positioned for recovery |
|
|
|
|
|
|
|
Increased competition |
|
Focus on cost management and operational efficiency |
|
|
|
|
|
|
|
Capacity reduction / consolidation |
|
Remaining competitors gaining customers / share |
|
|
|
|
|
|
|
North American PCB market transitioning to high mix, high complexity |
|
Differentiation through technology and service |
|
|
|
|
|
|
|
Several companies experiencing liquidity constraints / solvency issues |
|
Well capitalized players capturing share |
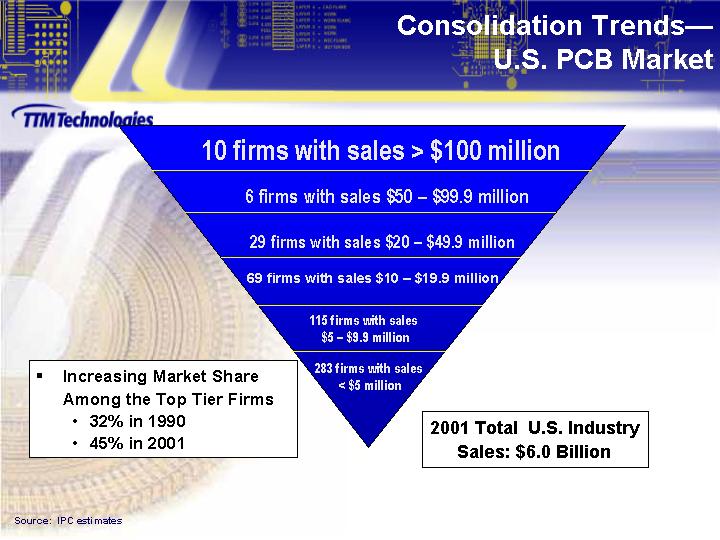
Consolidation Trends-
U.S. PCB Market
10 firms with sales > $100 million
6 firms with sales $50 $99.9 million
29 firms with sales $20 $49.9 million
69 firms with sales $10 $19.9 million
115 firms with sales
$5 $9.9 million
283 firms with sales
< $5 million
|
Increasing Market Share Among the Top Tier Firms |
|
2001 Total U.S. Industry |
|
32% in 1990 |
|
Sales: $6.0 Billion |
|
45% in 2001 |
|
|
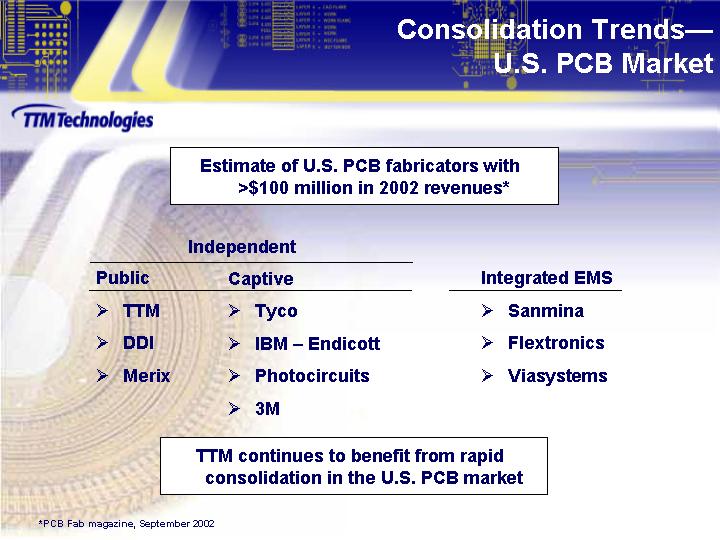
Consolidation Trends-
U.S. PCB Market
Estimate of U.S. PCB fabricators with
>$100 million in 2002 revenues*
|
Independent |
|
|
|
|||||
|
Public |
|
Captive |
|
Integrated EMS |
|
|||
|
|
TTM |
|
|
Tyco |
|
|
Sanmina |
|
|
|
DDI |
|
|
IBM Endicott |
|
|
Flextronics |
|
|
|
Merix |
|
|
Photocircuits |
|
|
Viasystems |
|
|
|
|
|
3M |
|
|
|
|
|
TTM continues to benefit from rapid consolidation in the U.S. PCB market
*PCB Fab magazine, September 2002
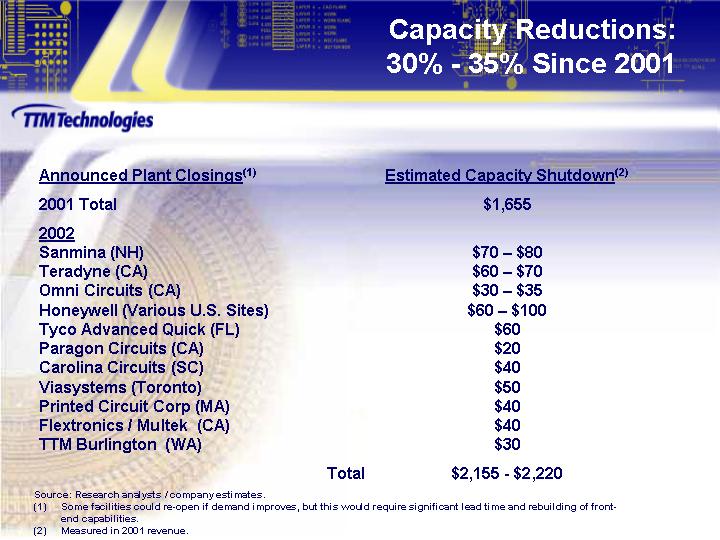
Capacity
Reductions:
30% - 35% Since 2001
|
Announced Plant Closings(1) |
|
Estimated Capacity Shutdown(2) |
|
|
|
|
|
|
|
2001 Total |
|
$1,655 |
|
|
|
|
|
|
|
2002 |
|
|
|
|
Sanmina (NH) |
|
$70 $80 |
|
|
Teradyne (CA) |
|
$60 $70 |
|
|
Omni Circuits (CA) |
|
$30 $35 |
|
|
Honeywell (Various U.S. Sites) |
|
$60 $100 |
|
|
Tyco Advanced Quick (FL) |
|
$60 |
|
|
Paragon Circuits (CA) |
|
$20 |
|
|
Carolina Circuits (SC) |
|
$40 |
|
|
Viasystems (Toronto) |
|
$50 |
|
|
Printed Circuit Corp (MA) |
|
$40 |
|
|
Flextronics / Multek (CA) |
|
$40 |
|
|
TTM Burlington (WA) |
|
$30 |
|
|
|
|
|
|
|
Total |
|
$2,155 - $2,220 |
|
Source: Research analysts / company estimates.
(1) Some facilities could re-open if demand improves, but this would require significant lead time and rebuilding of front-end capabilities.
(2) Measured in 2001 revenue.
|
|
|
|
|
|
|
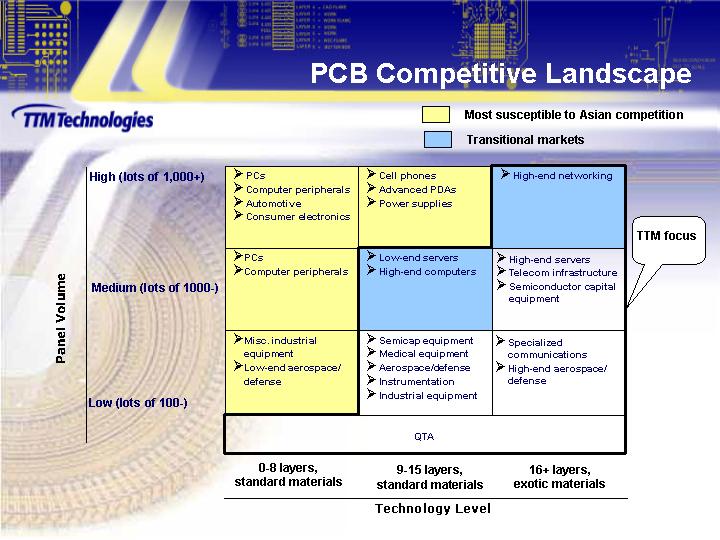
TTM focus |
||||||
|
Panel volume |
|
Most susceptible |
|
Most susceptible to Asian competition |
|
Transitional |
|
|
|
Transitional |
|
|
|
|
|
|
|
|
|
|
|
|
|
|
|
|
|
High (lots of 1,000+) |
|
PCs |
|
Cell phones |
|
|
|
|
|
High-end networking |
|
|
|
|
|
Computer peripherals |
|
Advanced PDAs |
|
|
|
|
|
|
|
|
|
|
|
Automotive |
|
Power supplies |
|
|
|
|
|
|
|
|
|
|
|
Consumer electronics |
|
|
|
|
|
|
|
|
|
|
|
|
|
|
|
|
|
|
|
|
|
|
|
|
|
Medium (lots of 1000-) |
|
PCs |
|
|
|
Low-end servers |
|
|
|
High-end servers |
|
|
|
|
|
Computer peripherals |
|
|
|
High-end computers |
|
|
|
Telecom infrastructure |
|
|
|
|
|
|
|
|
|
|
|
|
|
Semiconductor capital equipment |
|
|
|
|
|
|
|
|
|
|
|
|
|
|
|
|
|
Low (lots of 100-) |
|
Misc. industrial equipment |
|
|
|
Semicap equipment |
|
|
|
Specialized communications |
|
|
|
|
|
Low-end aerospace/defense |
|
|
|
Medical equipment |
|
|
|
High-end aerospace/ defense |
|
|
|
|
|
|
|
|
|
Aerospace/ defense |
|
|
|
|
|
|
|
|
|
|
|
|
|
Instrumentation |
|
|
|
|
|
|
|
|
|
|
|
|
|
Industrial equipment |
|
|
|
|
|
|
|
|
|
QTA |
||||||||||
|
|
|
0-8 layers, standard materials |
|
9-15 layers, standard materials |
|
16+ layers, exotic materials |
||||||
|
|
|
Technology Level |
||||||||||
Advantages of Niche Focus -Time and Technology
Faster Growth
Access to more diversified customer base
Critical to NPI across industries
Superior margins and profitability
Significant barriers to entry
Unique capabilities and culture for time
Significant investment and expertise for technology
Few competitors in either target market segment
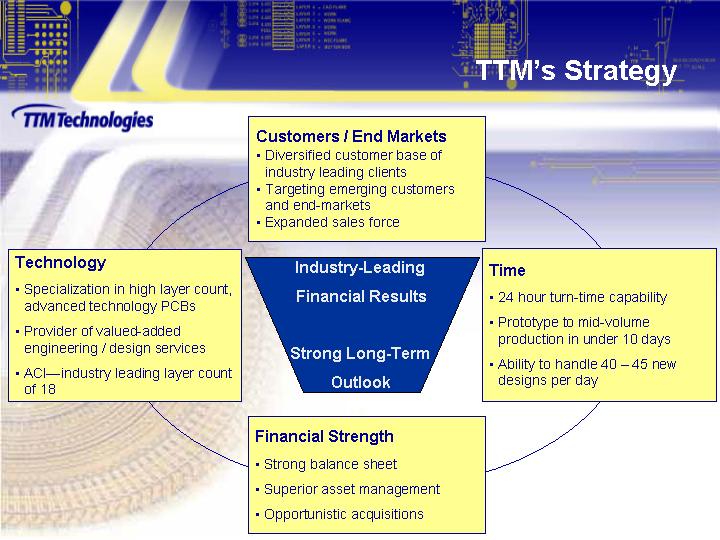
TTMs Strategy
Industry-Leading Financial Results
Strong Long-Term Outlook
Customers / End Markets
Diversified customer base of industry leading clients
Targeting emerging customers and end-markets
Expanded sales force
Time
24 hour turn-time capability
Prototype to mid-volume production in under 10 days
Ability to handle 40 45 new designs per day
Financial Strength
Strong balance sheet
Superior asset management
Opportunistic acquisitions
Technology
Specialization in high layer count, advanced technology PCBs
Provider of valued-added engineering / design services
ACIindustry leading layer count of 18
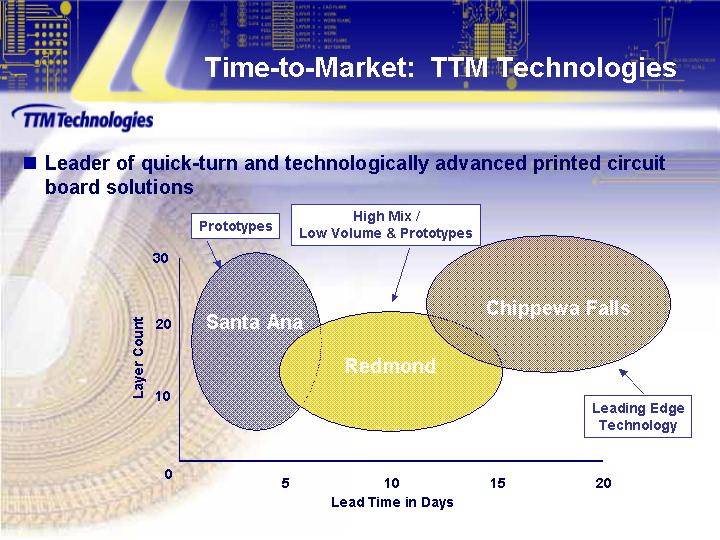
Time-to-Market: TTM Technologies
Leader of quick-turn and technologically advanced printed circuit board solutions
[CHART]
[CHART]
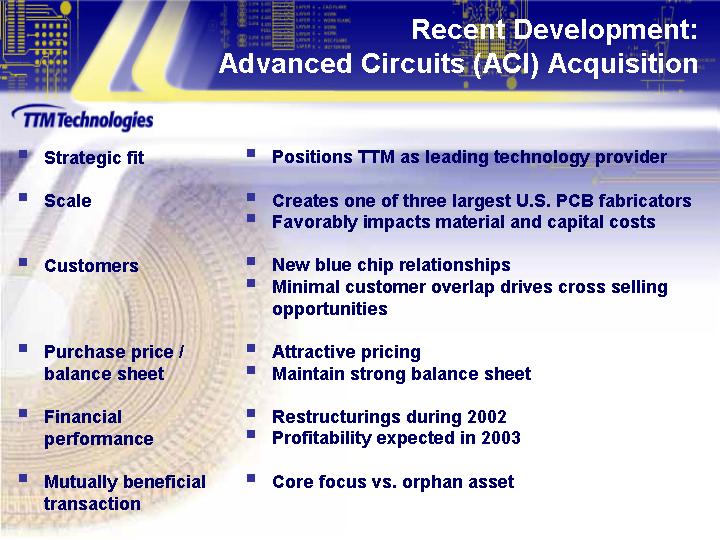
Recent
Development:
Advanced Circuits (ACI) Acquisition
|
|
Strategic fit |
|
Positions TTM as leading technology provider |
|
|
|
|
|
|
|
Scale |
|
Creates one of three largest U.S. PCB fabricators |
|
|
|
|
Favorably impacts material and capital costs |
|
|
|
|
|
|
|
Customers |
|
New blue chip relationships |
|
|
|
|
Minimal customer overlap drives cross selling opportunities |
|
|
|
|
|
|
|
Purchase price / balance sheet |
|
Attractive pricing |
|
|
|
|
Maintain strong balance sheet |
|
|
|
|
|
|
|
Financial performance |
|
Restructurings during 2002 |
|
|
|
|
Profitability expected in 2003 |
|
|
|
|
|
|
|
Mutually beneficial transaction |
|
Core focus vs. orphan asset |
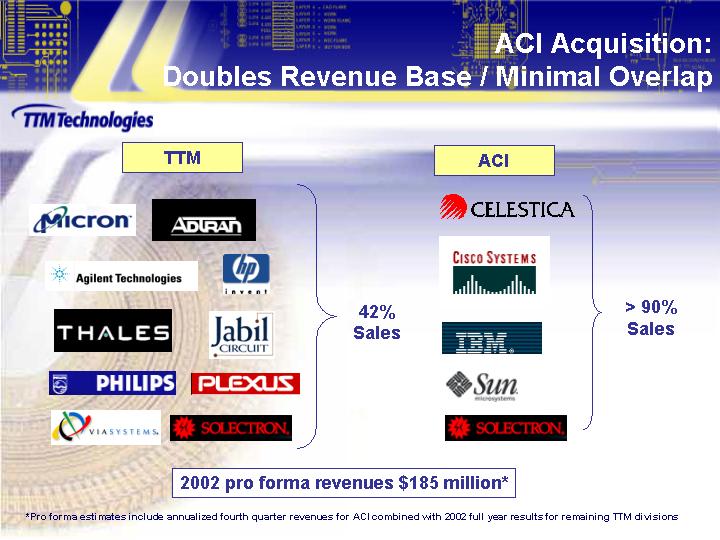
Doubles Revenue Base / Minimal Overlap
|
TTM |
|
ACI |
|
||
|
|
|
|
|
||
|
[LOGO] |
42% Sales |
|
[LOGO] |
>90% Sales |
|
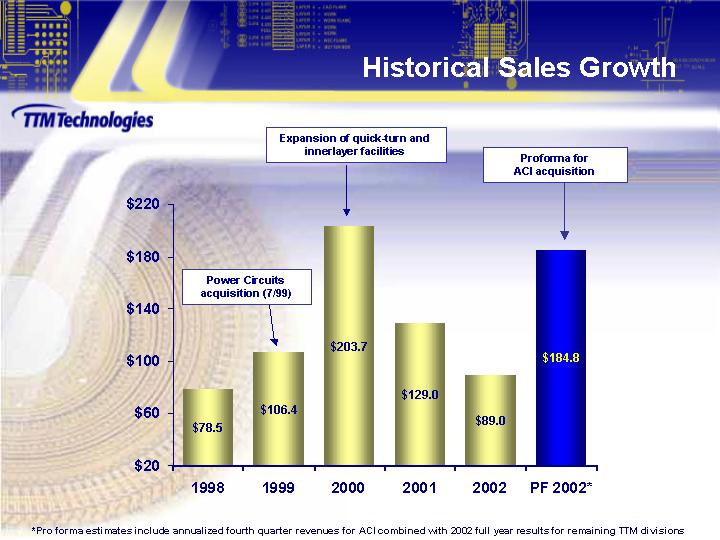
2002 pro forma revenues $185 million*
*Pro forma estimates include annualized fourth quarter revenues for ACI combined with 2002 full year results for remaining TTM divisions
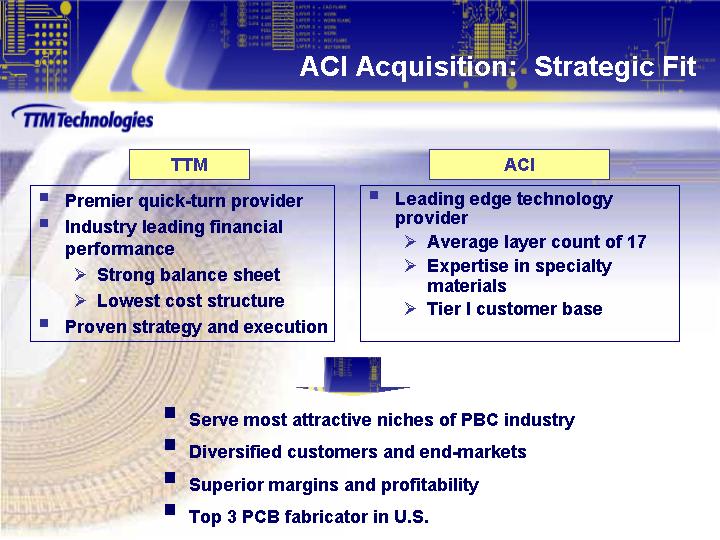
ACI Acquisition:
Strategic Fit
|
|
ACI |
|
|||||
|
|
|
|
|
|
|
||
|
|
Premier quick-turn provider |
|
|
Leading edge technology provider |
|
||
|
|
Industry leading financial performance |
|
|
|
Average layer count of 17 |
|
|
|
|
|
Strong balance sheet |
|
|
|
Expertise in specialty materials |
|
|
|
|
Lowest cost structure |
|
|
|
Tier I customer base |
|
|
|
|
Proven strategy and execution |
|
|
|
|
|
Serve most attractive niches of PBC industry
Diversified customers and end-markets
Superior margins and profitability
Top 3 PCB fabricator in U.S.
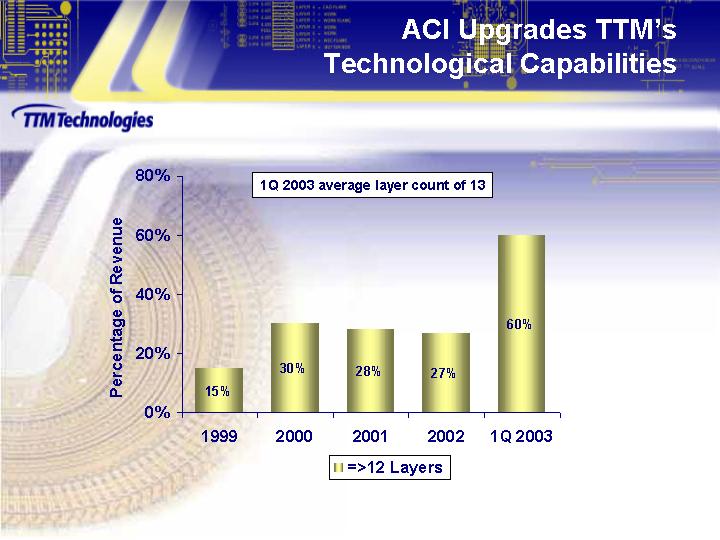
ACI
Upgrades TTMs
Technological Capabilities
1Q 2003 average layer count of 13
[CHART]
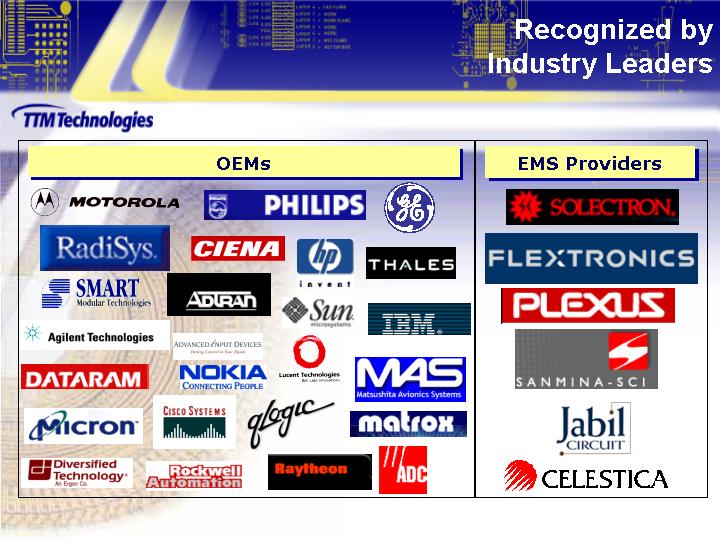
Industry Leaders
|
OEMs |
|
EMS Providers |
|
|
|
|
|
|
|
[LOGO] |
|
[LOGO] |
|
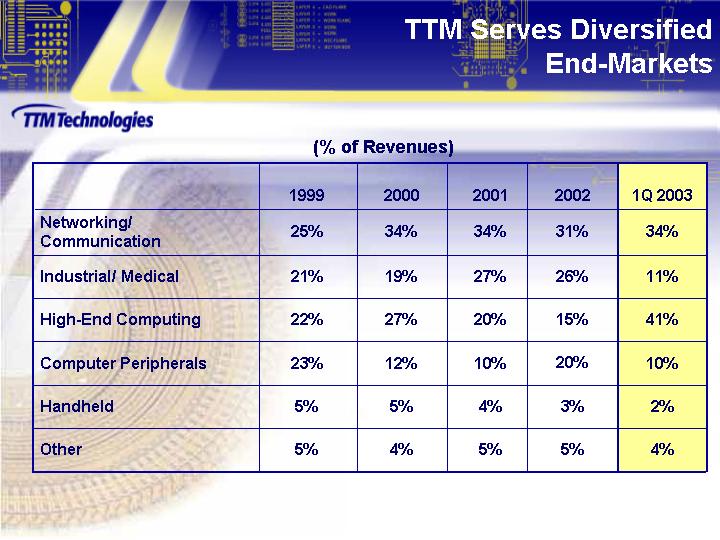
End-Markets
(% of Revenues)
|
|
|
1999 |
|
2000 |
|
2001 |
|
2002 |
|
1Q 2003 |
|
|
|
|
|
|
|
|
|
|
|
|
|
|
|
Networking/ Communication |
|
25 |
% |
34 |
% |
34 |
% |
31 |
% |
34 |
% |
|
|
|
|
|
|
|
|
|
|
|
|
|
|
Industrial/ Medical |
|
21 |
% |
19 |
% |
27 |
% |
26 |
% |
11 |
% |
|
|
|
|
|
|
|
|
|
|
|
|
|
|
High-End Computing |
|
22 |
% |
27 |
% |
20 |
% |
15 |
% |
41 |
% |
|
|
|
|
|
|
|
|
|
|
|
|
|
|
Computer Peripherals |
|
23 |
% |
12 |
% |
10 |
% |
20 |
% |
10 |
% |
|
|
|
|
|
|
|
|
|
|
|
|
|
|
Handheld |
|
5 |
% |
5 |
% |
4 |
% |
3 |
% |
2 |
% |
|
|
|
|
|
|
|
|
|
|
|
|
|
|
Other |
|
5 |
% |
4 |
% |
5 |
% |
5 |
% |
4 |
% |
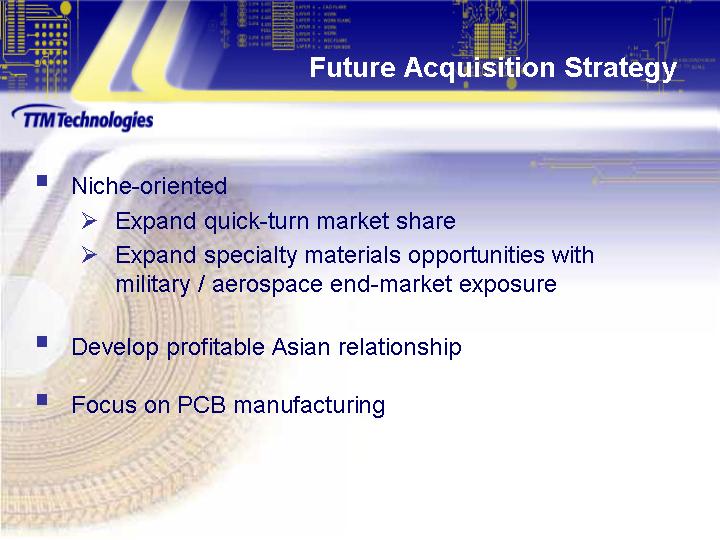
Future Acquisition Strategy
Niche-oriented
Expand quick-turn market share
Expand specialty materials opportunities with military / aerospace end-market exposure
Develop profitable Asian relationship
Focus on PCB manufacturing
Chief Financial Officer
[CHART]
*Pro forma estimates include annualized fourth quarter revenues for ACI combined with 2002 full year results for remaining TTM divisions
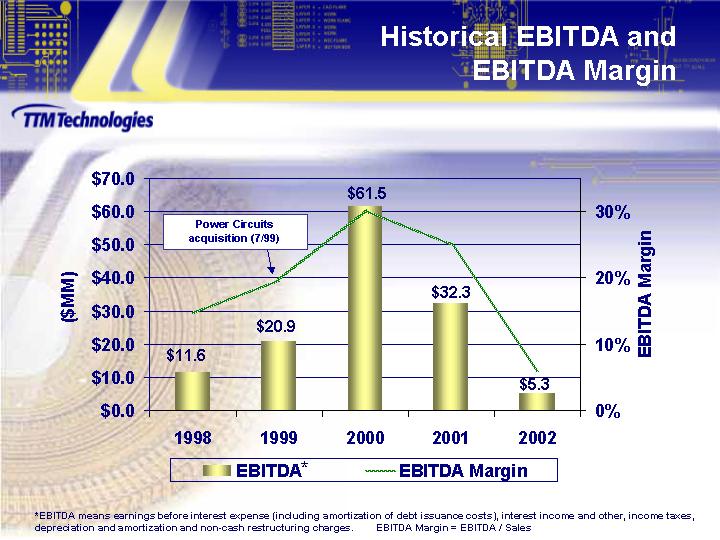
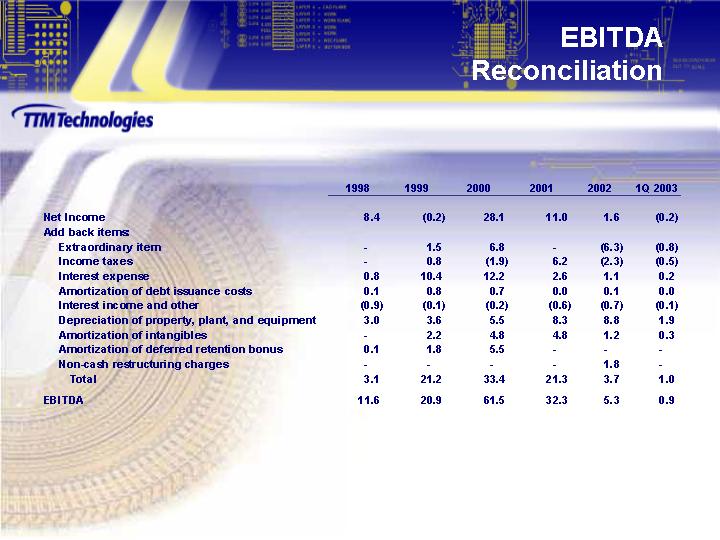
EBITDA Margin
[CHART]
*EBITDA means earnings before interest expense (including amortization of debt issuance costs), interest income and other, income taxes, depreciation and amortization and non-cash restructuring charges. EBITDA Margin = EBITDA / Sales
|
|
|
1998 |
|
1999 |
|
2000 |
|
2001 |
|
2002 |
|
1Q 2003 |
|
|
|
|
|
|
|
|
|
|
|
|
|
|
|
|
|
Net Income |
|
8.4 |
|
(0.2 |
) |
28.1 |
|
11.0 |
|
1.6 |
|
(0.2 |
) |
|
Add back items: |
|
|
|
|
|
|
|
|
|
|
|
|
|
|
Extraordinary item |
|
|
|
1.5 |
|
6.8 |
|
|
|
(6.3 |
) |
(0.8 |
) |
|
Income taxes |
|
|
|
0.8 |
|
(1.9 |
) |
6.2 |
|
(2.3 |
) |
(0.5 |
) |
|
Interest expense |
|
0.8 |
|
10.4 |
|
12.2 |
|
2.6 |
|
1.1 |
|
0.2 |
|
|
Amortization of debt issuance costs |
|
0.1 |
|
0.8 |
|
0.7 |
|
0.0 |
|
0.1 |
|
0.0 |
|
|
Interest income and other |
|
(0.9 |
) |
(0.1 |
) |
(0.2 |
) |
(0.6 |
) |
(0.7 |
) |
(0.1 |
) |
|
Depreciation of property, plant, and equipment |
|
3.0 |
|
3.6 |
|
5.5 |
|
8.3 |
|
8.8 |
|
1.9 |
|
|
Amortization of intangibles |
|
|
|
2.2 |
|
4.8 |
|
4.8 |
|
1.2 |
|
0.3 |
|
|
Amortization of deferred retention bonus |
|
0.1 |
|
1.8 |
|
5.5 |
|
|
|
|
|
|
|
|
Non-cash restructuring charges |
|
|
|
|
|
|
|
|
|
1.8 |
|
|
|
|
Total |
|
3.1 |
|
21.2 |
|
33.4 |
|
21.3 |
|
3.7 |
|
1.0 |
|
|
|
|
|
|
|
|
|
|
|
|
|
|
|
|
|
EBITDA |
|
11.6 |
|
20.9 |
|
61.5 |
|
32.3 |
|
5.3 |
|
0.9 |
|
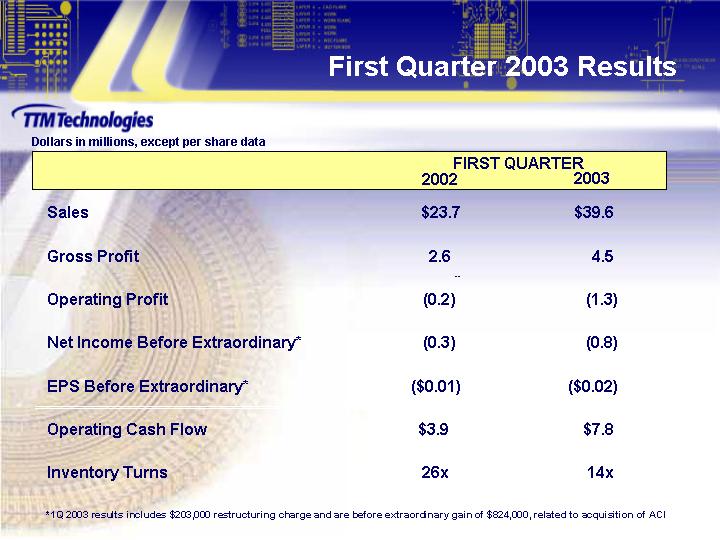
Dollars in millions, except per share data
|
|
|
FIRST QUARTER |
|
|||||
|
|
|
2002 |
|
2003 |
|
|
||
|
Sales |
|
$ |
23.7 |
|
$ |
39.6 |
|
|
|
|
|
|
|
|
|
|
||
|
Gross Profit |
|
2.6 |
|
4.5 |
|
|
||
|
|
|
|
|
|
|
|
||
|
Operating Profit |
|
(0.2 |
) |
(1.3 |
) |
|
||
|
|
|
|
|
|
|
|
||
|
Net Income Before Extraordinary* |
|
(0.3 |
) |
(0.8 |
) |
|
||
|
|
|
|
|
|
|
|
||
|
EPS Before Extraordinary* |
|
$ |
(0.01 |
) |
$ |
(0.02 |
) |
|
|
|
|
|
|
|
|
|
||
|
Operating Cash Flow |
|
$ |
3.9 |
|
$ |
7.8 |
|
|
|
|
|
|
|
|
|
|
||
|
Inventory Turns |
|
26x |
|
14x |
|
|
||
*1Q 2003 results includes $203,000 restructuring charge and are before extraordinary gain of $824,000, related to acquisition of ACI
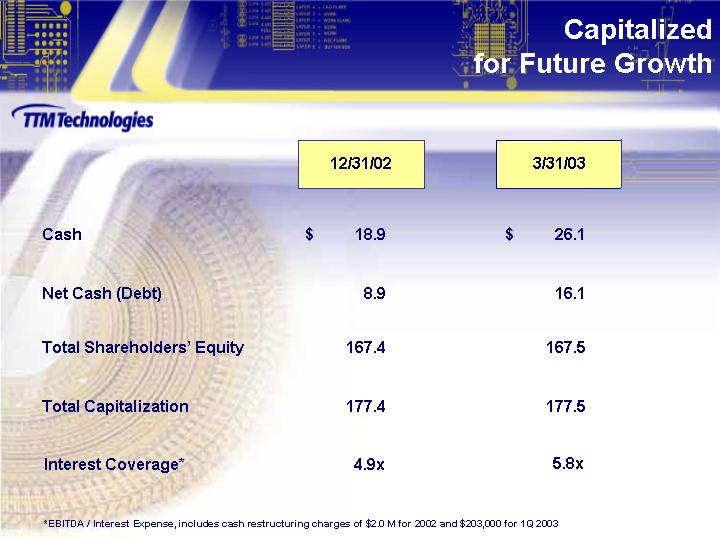
for Future Growth
|
|
|
12/31/02 |
|
3/31/03 |
|
||
|
|
|
|
|
|
|
||
|
Cash |
|
$ |
18.9 |
|
$ |
26.1 |
|
|
|
|
|
|
|
|
||
|
Net Cash (Debt) |
|
8.9 |
|
16.1 |
|
||
|
|
|
|
|
|
|
||
|
Total Shareholders Equity |
|
167.4 |
|
167.5 |
|
||
|
|
|
|
|
|
|
||
|
Total Capitalization |
|
177.4 |
|
177.5 |
|
||
|
|
|
|
|
|
|
||
|
Interest Coverage* |
|
4.9x |
|
5.8x |
|
||
*EBITDA / Interest Expense, includes cash restructuring charges of $2.0 M for 2002 and $203,000 for 1Q 2003
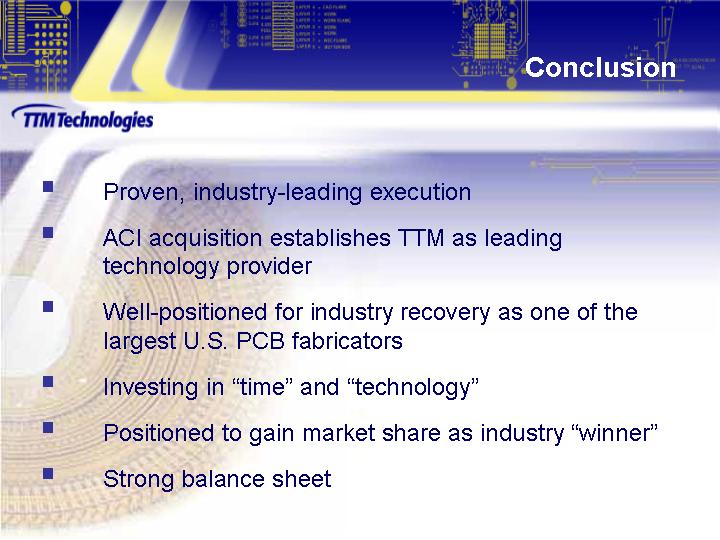
Proven, industry-leading execution
ACI acquisition establishes TTM as leading technology provider
Well-positioned for industry recovery as one of the largest U.S. PCB fabricators
Investing in time and technology
Positioned to gain market share as industry winner
Strong balance sheet
[LOGO]