EXHIBIT 99.1
Published on October 2, 2007
Exhibit 99.1
| TTM Technologies, Inc. Investor Presentation Jefferies Technology Conference Tuesday, October 2, 2007 TTM and Industry Overview |
| TTM and Industry Overview Kent Alder President and Chief Executive Officer, TTM TTM and Industry Overview This presentation contains forward-looking statements that relate to future events or performance. These statements reflect the companys curent expectations, and the company does not undertake to update or revise these forward-looking statements, even if experience or future changes make it clear that any projected results expressed or implied in this or other company statements will not be realized. Furthermore, readers are cautioned that these statements involve risks and uncertainties, manyof which are beyond the companys control, which could cause actual results to differ materially from the forward-looking statements. These risks and uncertainties include, but are not limited to, the companys dependence upon the electronics industry, the companys dependence upon a small number of customers, general economic conditions and specific conditions in the markets TTM addresses, the unpredictability of and potentialfluctuation in future revenues and operating results, increasedcompetition from low-cost foreign manufacturers, and other Risk Factors set forth in the companys most recent SEC filings. |
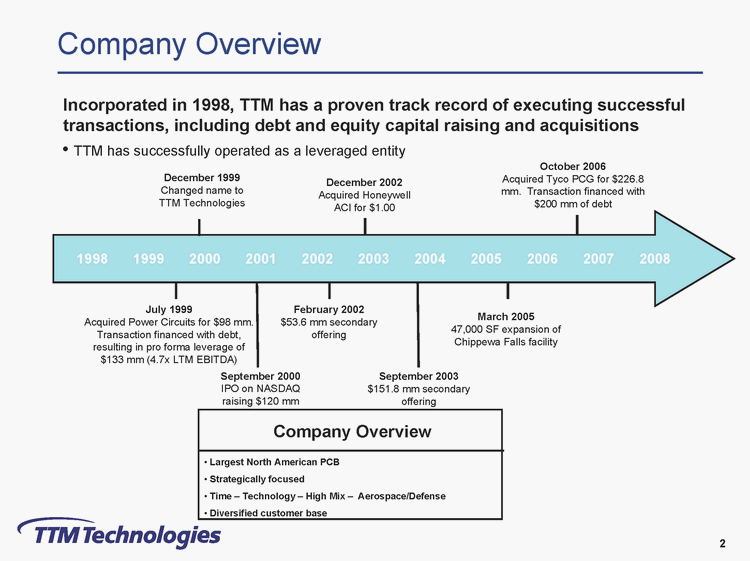
| Incorporated in 1998, TTM has a proven track record of executingsuccessful transactions, including debt and equity capital raising and acquisitions Company Overview |
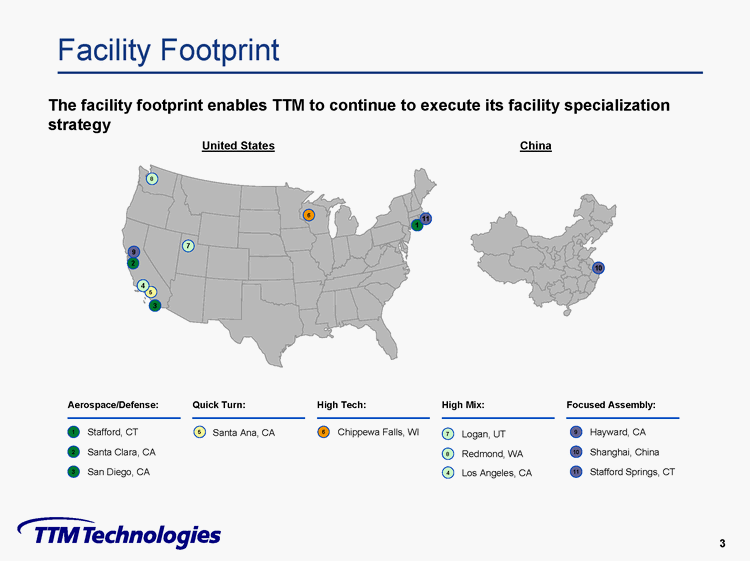
| Facility Footprint The facility footprint enables TTM to continue to execute its facility specialization strategy United States China Stafford, CT San Diego, CA Aerospace/Defense: Quick Turn: Los Angeles, CA High Tech: Chippewa Falls, WI High Mix: Santa Clara, CA Santa Ana, CA The facility footprint enables TTM to continue to execute its facility specialization strategy Facility Footprint Focused Assembly: Redmond, WA Logan, UT Hayward, CA Stafford Springs, CT Shanghai, China United States China |
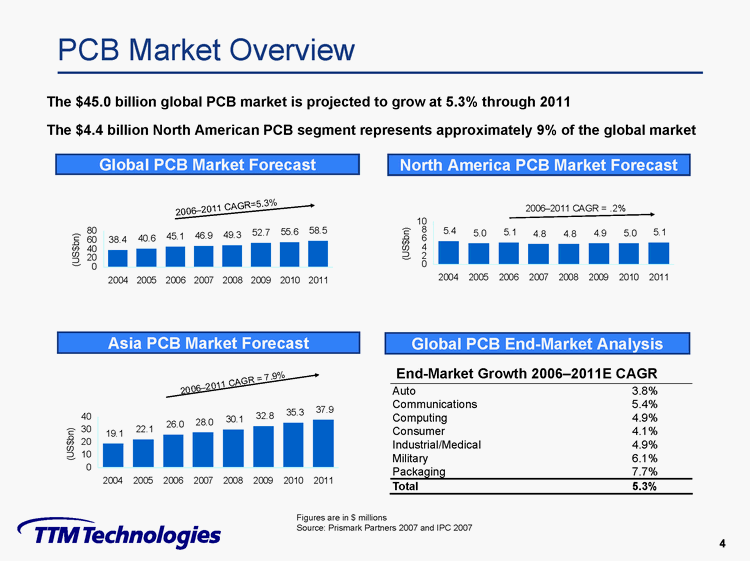
| PCB Market Overview The $45.0 billion global PCB market is projected to grow at 5.3%through 2011 The $4.4 billion North American PCB segment represents approximately 9% of the global market |

| North American PCB Market Overview The $4.4 billion North American PCB market is highly fragmented Pro forma the acquisition, TTM will own the #1 market share position in North America Larger, well-capitalized players with focused strategies, significant scale and advanced technology capability are positioned to benefit from on-going industry consolidation North American industry capacity has declined significantly since 2000 Total number of PCB manufacturers reduced by approximately 50% Only 5 companies have over $100 million in sales Fragmented North American Market North American Market Share Analysis Greater than $100M TTM Merix EIT TTM 14% DDi Sanmina SCI Merix 5% DDI > $100mm 4% 5 Sanmina $20 to $99mm 3% 7 EIT 3% $11 to $19mm 30 Coretec Others 2% 66% 371 $0 to $10mm Amphenol FTG 2% 1% Total: 413 PCB Companies * based on TTM estimates Source: 2007 FabFile Online ** based on IPC 2006 report Source:2007 FabFileOnline Greater than $100M |
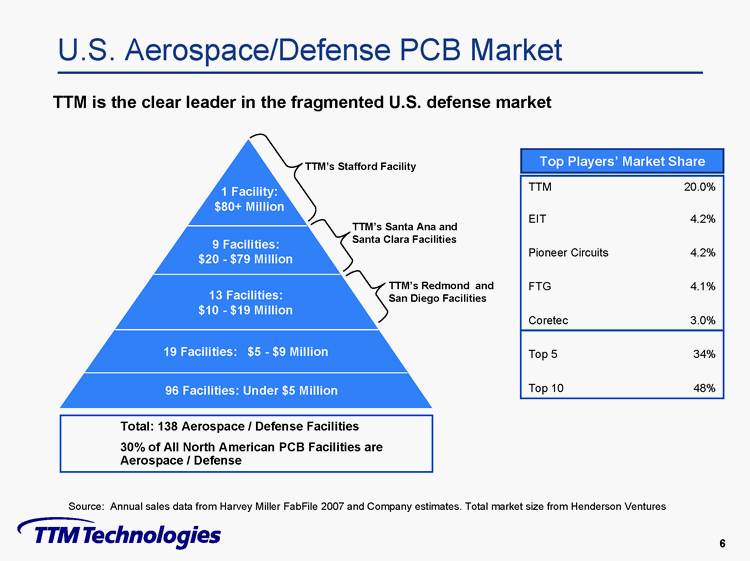
| U.S. Aerospace/Defense PCB Market Source: Annual sales data from Harvey Miler FabFile2007 and Company estimates. Total market size from Henderson Ventures Total: 138 Aerospace / Defense Facilities 30% of All North American PCB Facilities are Aerospace / Defense TTM is the clear leader in the fragmented U.S. defense market Top Players Market Share TTM 20.0% EIT 4.2% Pioneer Circuits 4.2% FTG 4.1% Coretec 3.0% Top 5 34% Top 10 48% |
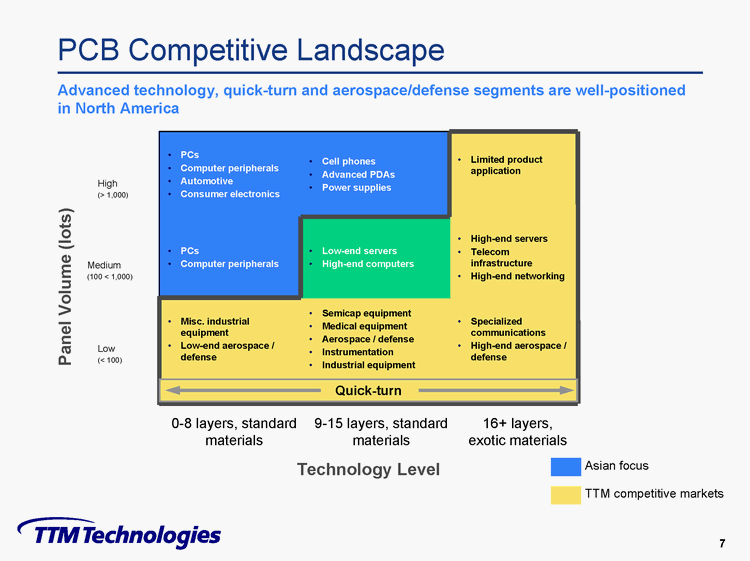
| PCB Competitive Landscape Technology Level 9-15 layers, standard materials 16+ layers, exotic materials Asian focus 0-8 layers, standard materials TTM competitive markets Advanced technology, quick-turn and aerospace/defense segments are well-positioned in North America |
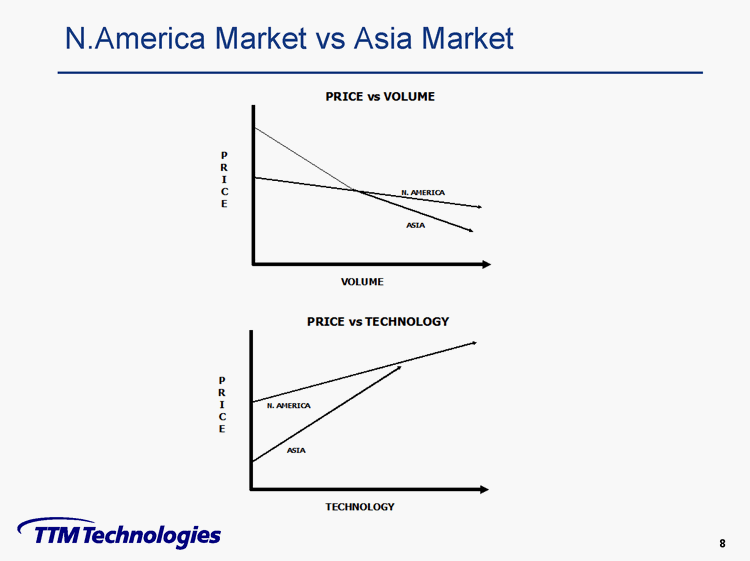
| N.AmericaMarket vsAsia Market |
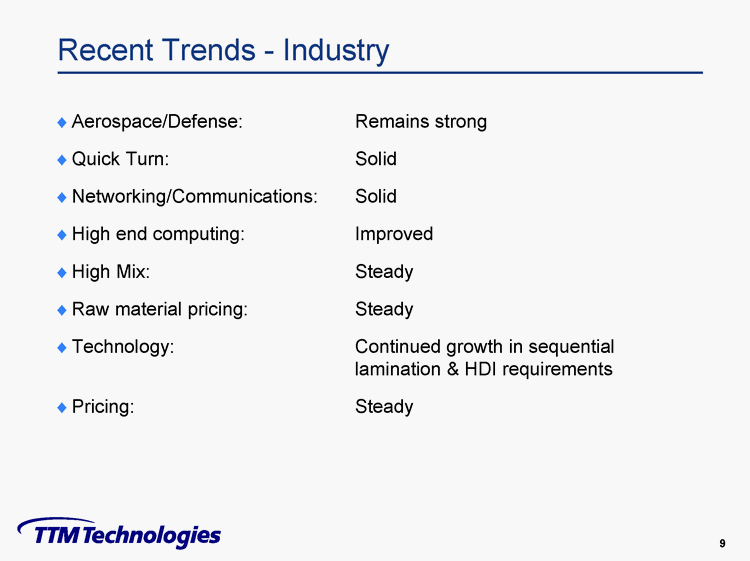
| Recent Trends -Industry ?Aerospace/Defense: Remains strong ?Quick Turn:Solid ?Networking/Communications:Solid ?High end computing:Improved ?High Mix:Steady ?Raw material pricing:Steady ?Technology:Continued growth in sequential lamination & HDI requirements ?Pricing:Steady |
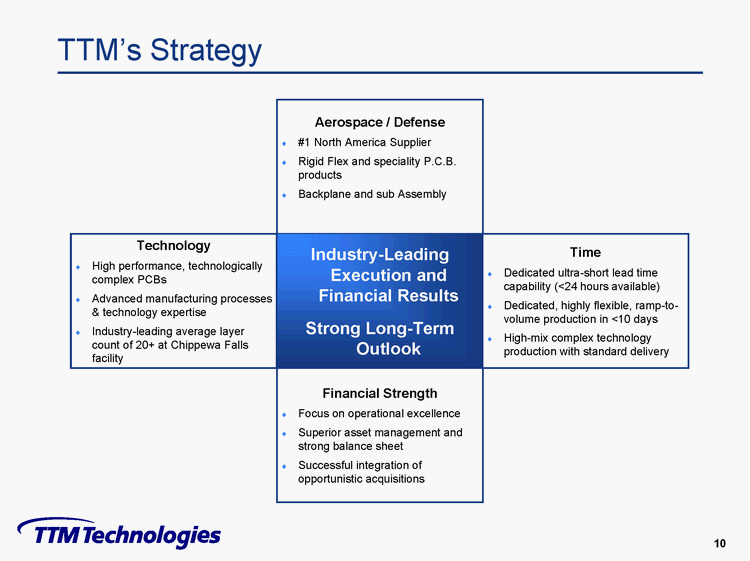
| TTMs Strategy Aerospace / Defense #1 North America Supplier Rigid Flex and speciality P.C.B. products Backplane and sub Assembly Technology Industry-Leading Time High performance, technologically Execution and Dedicated ultra-short lead time complex PCBs capability (<24 hours available) Advanced manufacturing processes Financial Results Dedicated, highly flexible, ramp-to& technology expertise volume production in <10 days Industry-leading average layer Strong Long-Term High-mix complex technology count of 20+ at Chippewa Falls Outlook production with standard delivery facility Financial Strength Focus on operational excellence Superior asset management and strong balance sheet Successful integration of opportunistic acquisitions |

| Company Overview Doug Soder Executive Vice President, TTM |
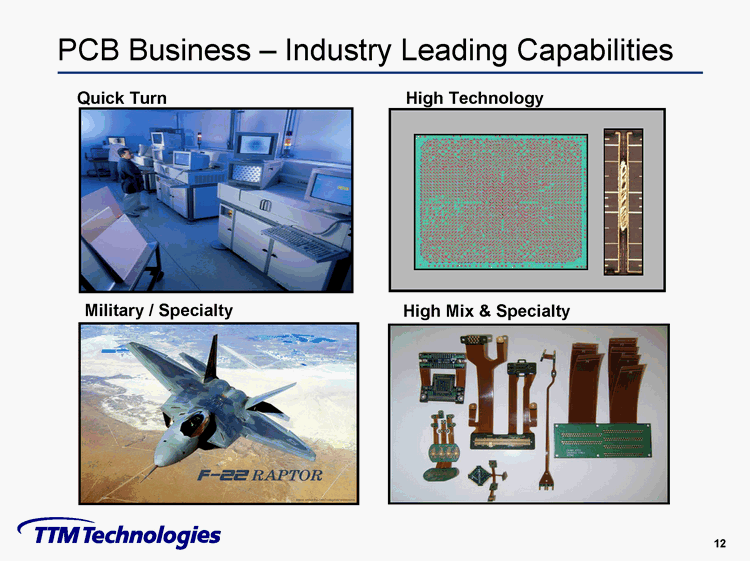
| PCB Business Industry Leading Capabilities Military / Specialty High Mix & Specialty |
| Commercial Backplane Assembly Business ?Leading Market Positions in North America and China ?Limited Competition with EMS Companies ?Product & Service Offering Includes: Backplane & Chassis Assemblies Rigid-Flex Assemblies System Design & Simulation Services ?Strategic Rationale Strengthens TTM Supplier Status with Key Global Customers Presents Significant Growth Opportunities in China Drives Internal PCB Demand Profitable Business with Opportunities for Margin Improvement |
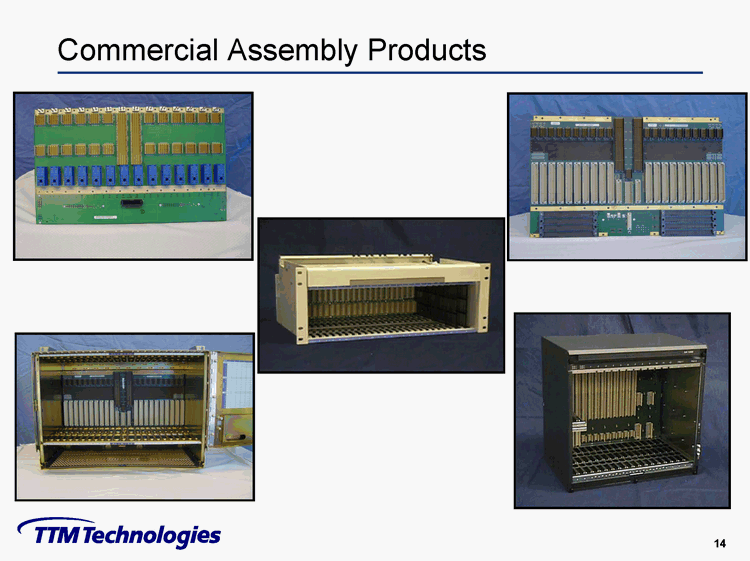
| Commercial Assembly Products |
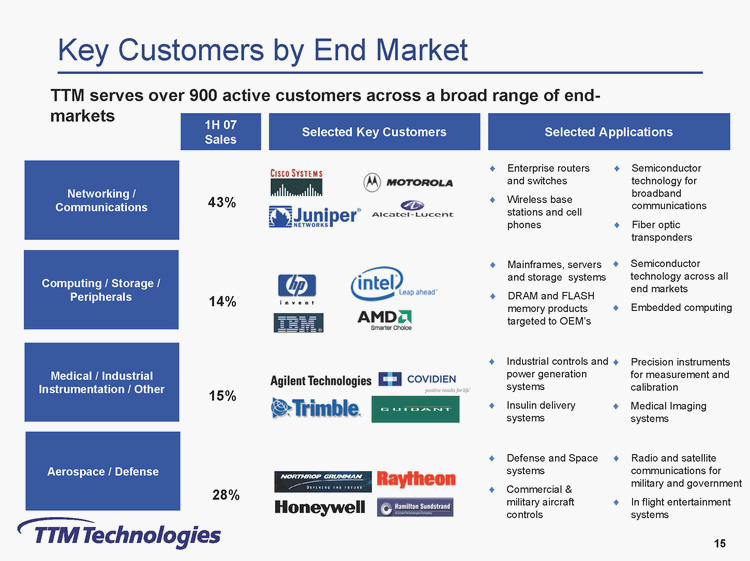
| TTM serves over 900 active customers across a broad range of end-markets 1H 07 Selected Key Customers Selected Applications Sales Enterprise routers Semiconductor and switches technology for Networking / broadband 43% Wireless base Communications communications stations and cell phones Fiber optic transponders Mainframes, servers Semiconductor and storage systems technology across all Computing / Storage / end markets Peripherals 14% DRAM and FLASH memory products Embedded computing targeted to OEMs Industrial controls and Precision instruments Medical / Industrial power generation for measurement and Instrumentation / Other systems calibration 15% Insulin delivery Medical Imaging systems systems Defense and Space Radio and satellite Aerospace / Defense systems communications for military and government 28% Commercial & military aircraft In flight entertainment controls systems Key Customers by End Market 43% 14% 15% 28% |
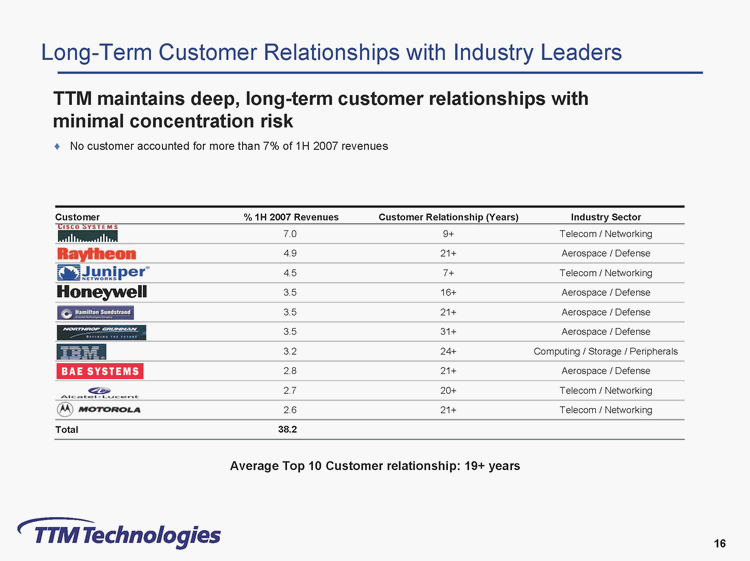
| Long-Term Customer Relationships with Industry Leaders Long-Term Customer Relationships with Industry Leaders TTM maintains deep, long-term customer relationships with minimal concentration risk No customer accounted for more than 7% of 1H 2007 revenues Customer % 1H 2007 Revenues Customer Relationship (Years) Industry Sector 7.0 9+ Telecom / Networking 4.9 21+ Aerospace / Defense 4.5 7+ Telecom / Networking 3.5 16+ Aerospace / Defense 3.5 21+ Aerospace / Defense 3.5 31+ Aerospace / Defense 3.2 24+ Computing / Storage / Peripherals 2.8 21+ Aerospace / Defense 2.7 20+ Telecom / Networking 2.6 21+ Telecom / Networking Total 38.2 Average Top 10 Customer relationship: 19+ years |
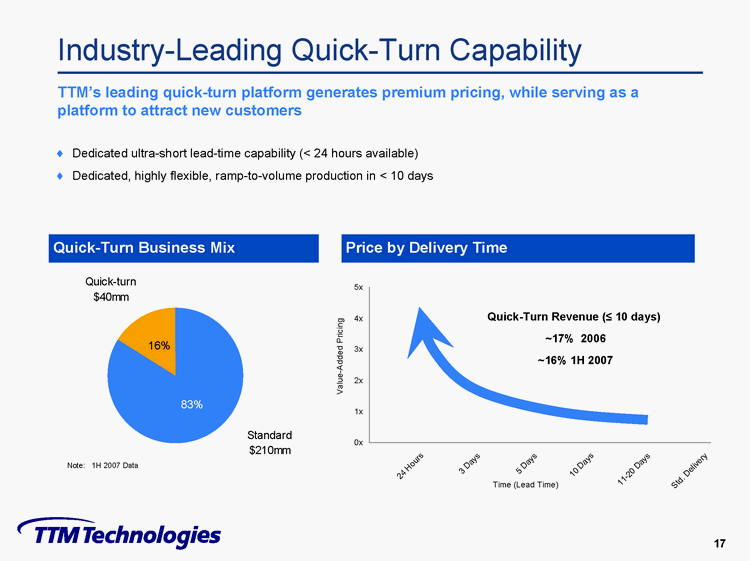
| Industry-Leading Quick-Turn Capability Industry-Leading Quick-Turn Capability TTMs leading quick-turn platform generates premium pricing, while serving as a platform to attract new customers Dedicated ultra-short lead-time capability (< 24 hours available) Dedicated, highly flexible, ramp-to-volume production in < 10 days Quick-Turn Business Mix Price by Delivery Time Quick-turn 5x $40mm 4x Quick-Turn Revenue ( 10 days) ~17% 2006 16% 3x ~16% 1H 2007 Value-Added Pricing 2x 83% 1x Standard 0x $210mm Note: 1H 2007 Data ours Days Days Days ays H D 3 5 0 4 10 2 Delivery 2 . 1 Time (Lead Time) 1 Std 17 |
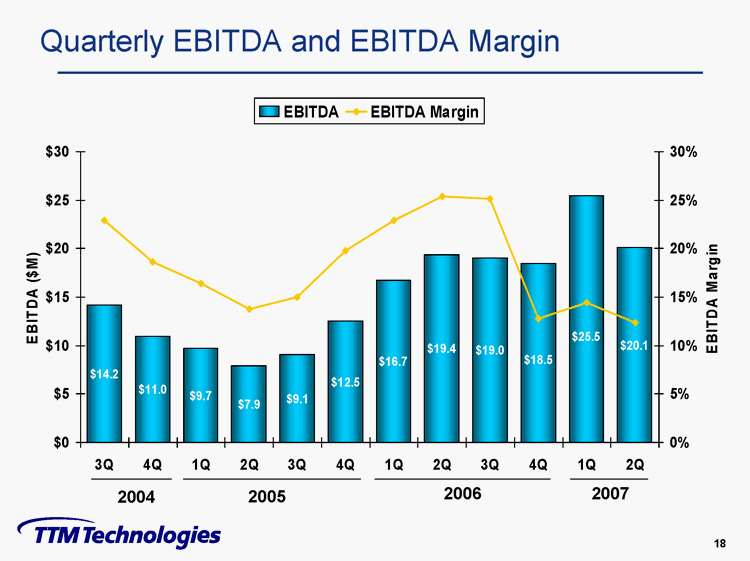
| Quarterly EBITDA and EBITDA Margin |
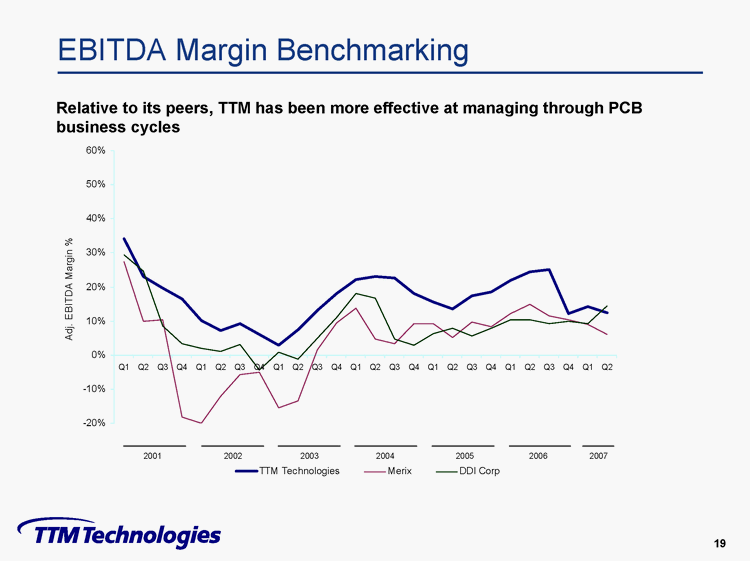
| EBITDA Margin Benchmarking EBITDA Margin Benchmarking Relative to its peers, TTM has been more effective at managing through PCB business cycles 60% |
| Summary Summary Largest player in North America with significant size and scale Leading market #1 in Quick-Turn PCB production and Aerospace & Defense PCB products positions in attractive segments Leadership positions for Advanced technology PCBs, Rigid-Flex and Backplane Assembly products Integrated manufacturing Leading quick-turn platform involves TTM in new product introduction across diverse end markets platform provides one- Products/services support all stages of electronic product life cycle engineering services, prototype through volume production stop solution Focused facility specialization strategy speed, flexibility, technology Difficult business model to replicate Limited competition / Significant technology expertise, employee training and investment required high entry barriers Limited threat from Asian competition in quick-turn, high layer-count and defense markets Large and diversified customer base Leading customers in Strong relationships with leading OEM and EMS customers diverse end markets Long-standing relationships with top customers Profitable business model across cycle Industry-leading Superior margins / operating metrics financial performance Strong balance sheet & proven history of consistent cash flow generation even during protracted downturn from 2001-02 Experienced management Seasoned management team led by CEO with 26 years of industry experience team with proven Focused strategy has provided growth / stability across cycle execution track record Proven ability to integrate acquisitions Prudent Moderate pro forma credit profile total leverage of approximately 1.2x LTM 7/2/07 Adjusted EBITDA balance sheet Strong asset coverage management Minimal near-term maturities limited debt service requirements Strong liquidity approximately $57 million of cash and availability under Revolver |
| Historical Financials Steve Richards Chief Financial Officer, TTM |
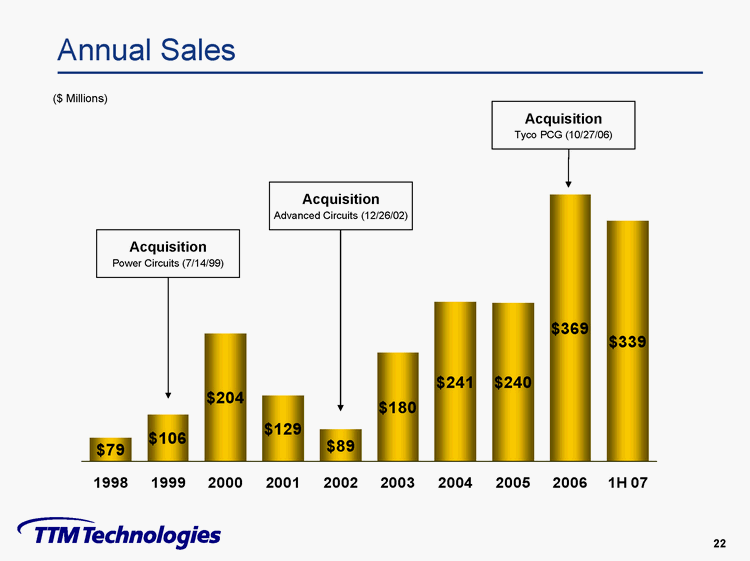
| Annual Sales ($ Millions) Annual Sales ($ Millions) Acquisition Tyco PCG (10/27/06) Acquisition Advanced Circuits (12/26/02) Acquisition Power Circuits (7/14/99) $369 $339 $241 $240 $204 $180 $129 $106 $79 $89 1998 1999 2000 2001 2002 2003 2004 2005 2006 1H 07 |
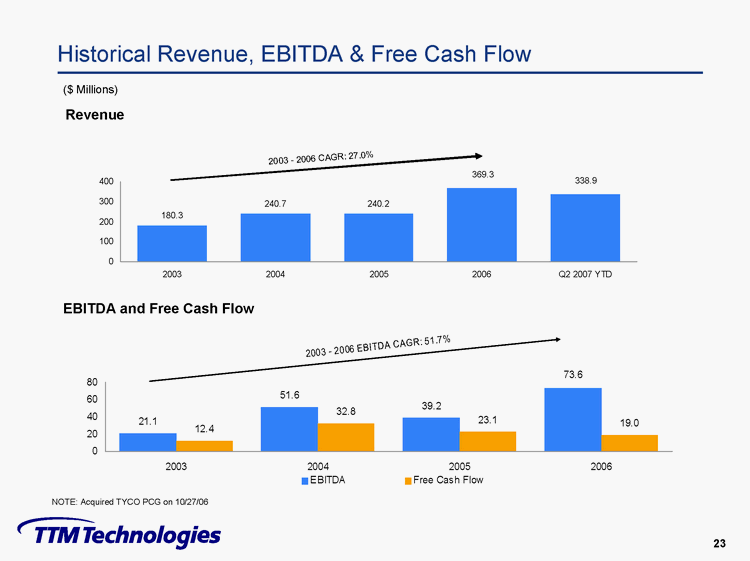
| Historical Revenue, EBITDA & Free Cash Flow NOTE: Acquired TYCO PCG on 10/27/06 |
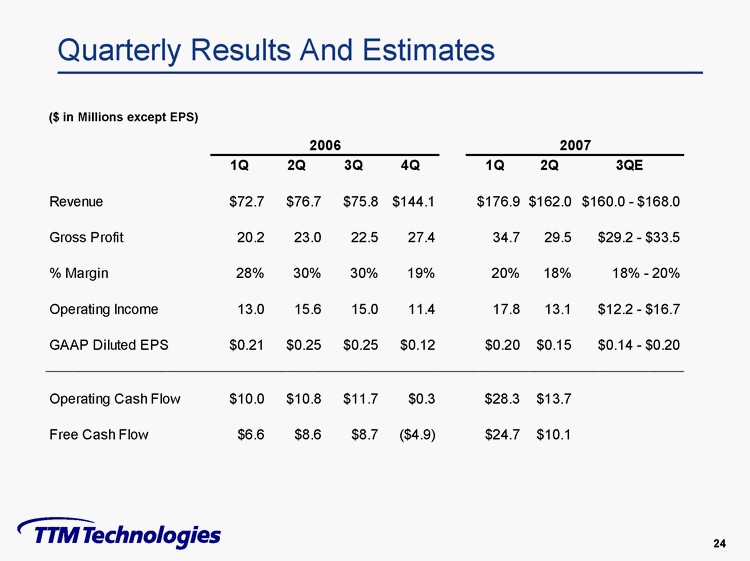
| Quarterly Results And Estimates ($ in Millions except EPS) Quarterly Results And Estimates ($ in Millions except EPS) 2006 2007 1Q 2Q 3Q 4Q 1Q 2Q 3QE Revenue $72.7 $76.7 $75.8 $144.1 $176.9 $162.0 $160.0 $168.0 Gross Profit 20.2 23.0 22.5 27.4 34.7 29.5 $29.2 $33.5 % Margin 28% 30% 30% 19% 20% 18% 18% 20% Operating Income 13.0 15.6 15.0 11.4 17.8 13.1 $12.2 $16.7 GAAP Diluted EPS $0.21 $0.25 $0.25 $0.12 $0.20 $0.15 $0.14 $0.20 Operating Cash Flow $10.0 $10.8 $11.7 $0.3 $28.3 $13.7 Free Cash Flow $6.6 $8.6 $8.7 ($4.9) $24.7 $10.1 |
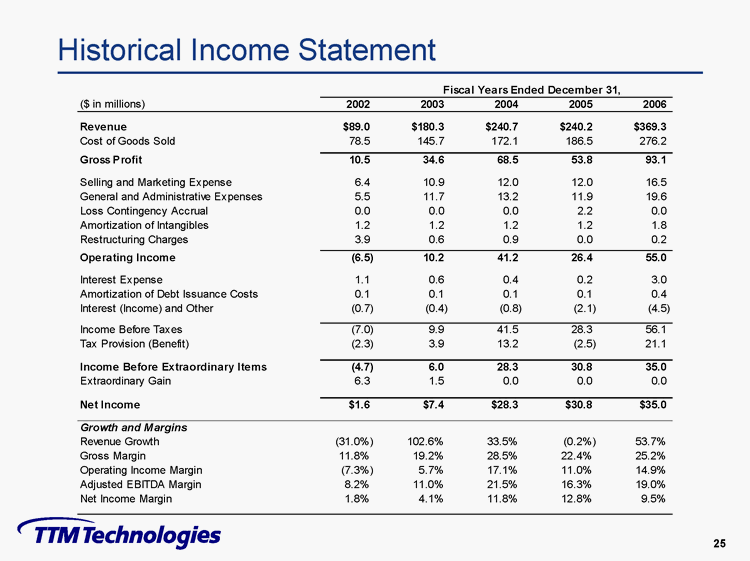
| Historical Income Statement Historical Income Statement Fiscal Years Ended December 31, ($ in millions) 2002 2003 2004 2005 2006 Revenue $89.0 $180.3 $240.7 $240.2 $369.3 Cost of Goods Sold 78.5 145.7 172.1 186.5 276.2 Gross Profit 10.5 34.6 68.5 53.8 93.1 Selling and Marketing Expense 6.4 10.9 12.0 12.0 16.5 General and Administrative Expenses 5.5 11.7 13.2 11.9 19.6 Loss Contingency Accrual 0.0 0.0 0.0 2.2 0.0 Amortization of Intangibles 1.2 1.2 1.2 1.2 1.8 Restructuring Charges 3.9 0.6 0.9 0.0 0.2 Operating Income (6.5) 10.2 41.2 26.4 55.0 Interest Expense 1.1 0.6 0.4 0.2 3.0 Amortization of Debt Issuance Costs 0.1 0.1 0.1 0.1 0.4 Interest (Income) and Other (0.7) (0.4) (0.8) (2.1) (4.5) Income Before Taxes (7.0) 9.9 41.5 28.3 56.1 Tax Provision (Benefit) (2.3) 3.9 13.2 (2.5) 21.1 Income Before Extraordinary Items (4.7) 6.0 28.3 30.8 35.0 Extraordinary Gain 6.3 1.5 0.0 0.0 0.0 Net Income $1.6 $7.4 $28.3 $30.8 $35.0 Growth and Margins Revenue Growth (31.0%) 102.6% 33.5% (0.2%) 53.7% Gross Margin 11.8% 19.2% 28.5% 22.4% 25.2% Operating Income Margin (7.3%) 5.7% 17.1% 11.0% 14.9% Adjusted EBITDA Margin 8.2% 11.0% 21.5% 16.3% 19.0% Net Income Margin 1.8% 4.1% 11.8% 12.8% 9.5% |
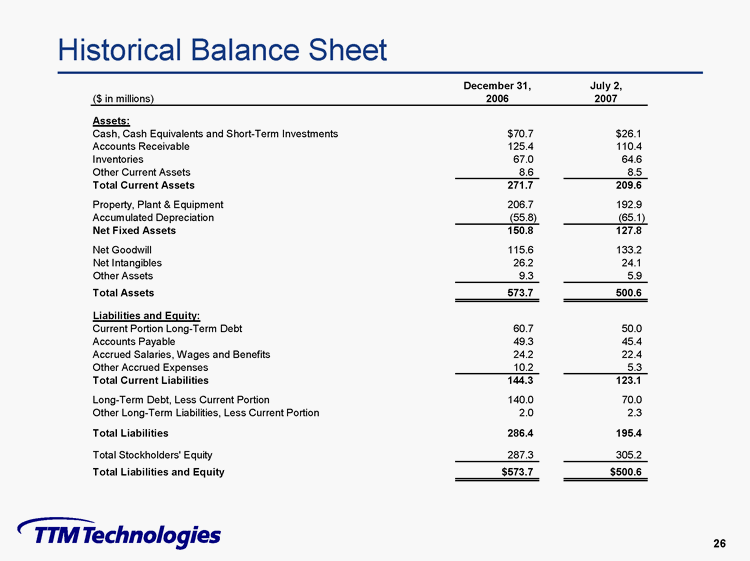
| Historical Balance Sheet Historical Balance Sheet December 31, July 2, ($ in millions) 2006 2007 Assets: Cash, Cash Equivalents and Short-Term Investments $70.7 $26.1 Accounts Receivable 125.4 110.4 Inventories 67.0 64.6 Other Current Assets 8.6 8.5 Total Current Assets 271.7 209.6 Property, Plant & Equipment 206.7 192.9 Accumulated Depreciation (55.8) (65.1) Net Fixed Assets 150.8 127.8 Net Goodwill 115.6 133.2 Net Intangibles 26.2 24.1 Other Assets 9.3 5.9 Total Assets 573.7 500.6 Liabilities and Equity: Current Portion Long-Term Debt 60.7 50.0 Accounts Payable 49.3 45.4 Accrued Salaries, Wages and Benefits 24.2 22.4 Other Accrued Expenses 10.2 5.3 Total Current Liabilities 144.3 123.1 Long-Term Debt, Less Current Portion 140.0 70.0 Other Long-Term Liabilities, Less Current Portion 2.0 2.3 Total Liabilities 286.4 195.4 Total Stockholders Equity 287.3 305.2 Total Liabilities and Equity $573.7 $500.6 |
| TTM Technologies, Inc. Investor Presentation Jefferies Technology Conference Tuesday, October 2, 2007 |