EX-99.1
Published on January 11, 2007
Exhibit 99.1
| TTM Technologies, Inc. Investor Presentation The 9th Annual Needham & Company Conference Thursday, January 11, 2007 |
| Kent Alder - President and Chief Executive Officer, TTM TTM and Industry Overview This presentation contains forward-looking statements that relate to future events or performance. These statements reflect the company's current expectations, and the company does not undertake to update or revise these forward-looking statements, even if experience or future changes make it clear that any projected results expressed or implied in this or other company statements will not be realized. Furthermore, readers are cautioned that these statements involve risks and uncertainties, many of which are beyond the company's control, which could cause actual results to differ materially from the forward-looking statements. These risks and uncertainties include, but are not limited to, the company's dependence upon the electronics industry, the company's dependence upon a small number of customers, general economic conditions and specific conditions in the markets TTM addresses, the unpredictability of and potential fluctuation in future revenues and operating results, increased competition from low-cost foreign manufacturers, and other "Risk Factors" set forth in the company's most recent SEC filings. |
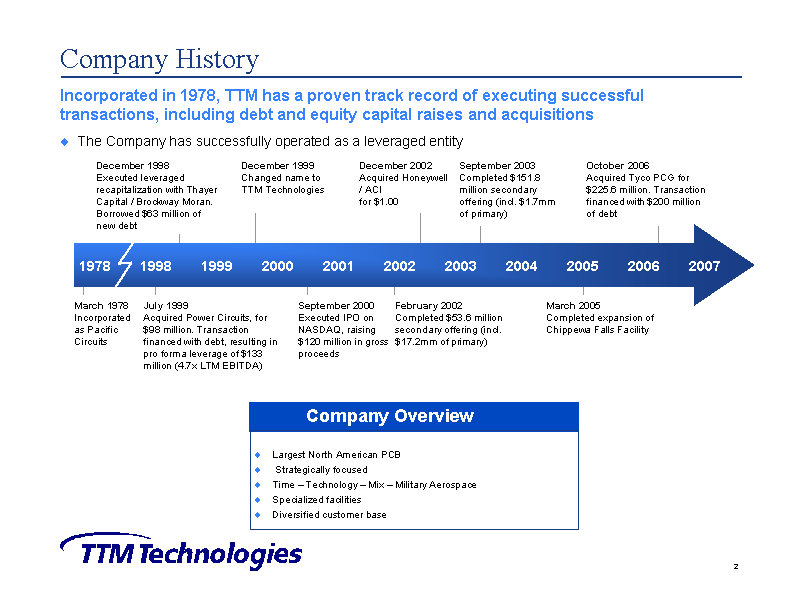
| Company History Largest North American PCB Strategically focused Time - Technology - Mix - Military Aerospace Specialized facilities Diversified customer base Company Overview Incorporated in 1978, TTM has a proven track record of executing successful transactions, including debt and equity capital raises and acquisitions The Company has successfully operated as a leveraged entity October 2006 Acquired Tyco PCG for $225.6 million. Transaction financed with $200 million of debt 1978 1998 1999 2000 2001 2002 2003 2004 2005 2006 March 1978 Incorporated as Pacific Circuits December 1998 Executed leveraged recapitalization with Thayer Capital / Brockway Moran. Borrowed $63 million of new debt July 1999 Acquired Power Circuits, for $98 million. Transaction financed with debt, resulting in pro forma leverage of $133 million (4.7x LTM EBITDA) December 1999 Changed name to TTM Technologies September 2000 Executed IPO on NASDAQ, raising $120 million in gross proceeds December 2002 Acquired Honeywell / ACI for $1.00 March 2005 Completed expansion of Chippewa Falls Facility September 2003 Completed $151.8 million secondary offering (incl. $1.7mm of primary) February 2002 Completed $53.6 million secondary offering (incl. $17.2mm of primary) 2007 |
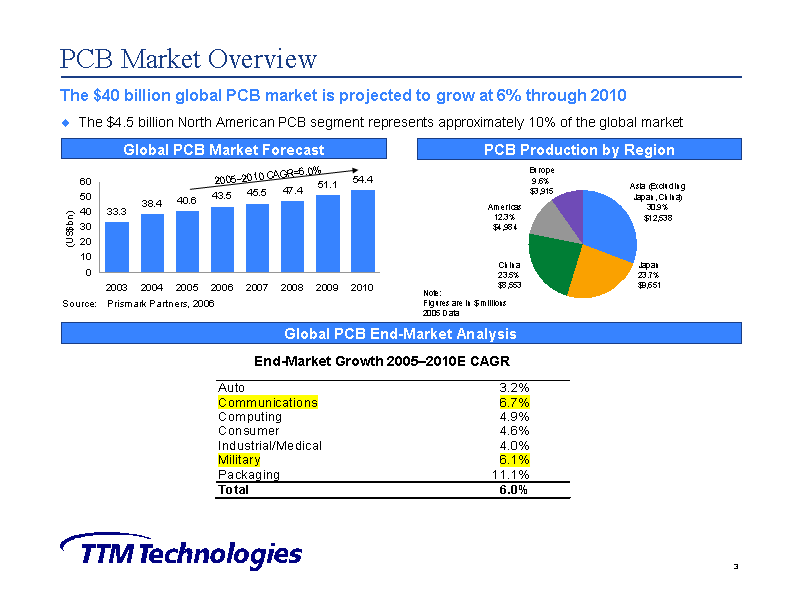
| PCB Market Overview The $40 billion global PCB market is projected to grow at 6% through 2010 Global PCB Market Forecast PCB Production by Region Global PCB End-Market Analysis Source: Prismark Partners, 2006 The $4.5 billion North American PCB segment represents approximately 10% of the global market End-Market Growth 2005-2010E CAGR Note: Figures are in $ millions 2005 Data |
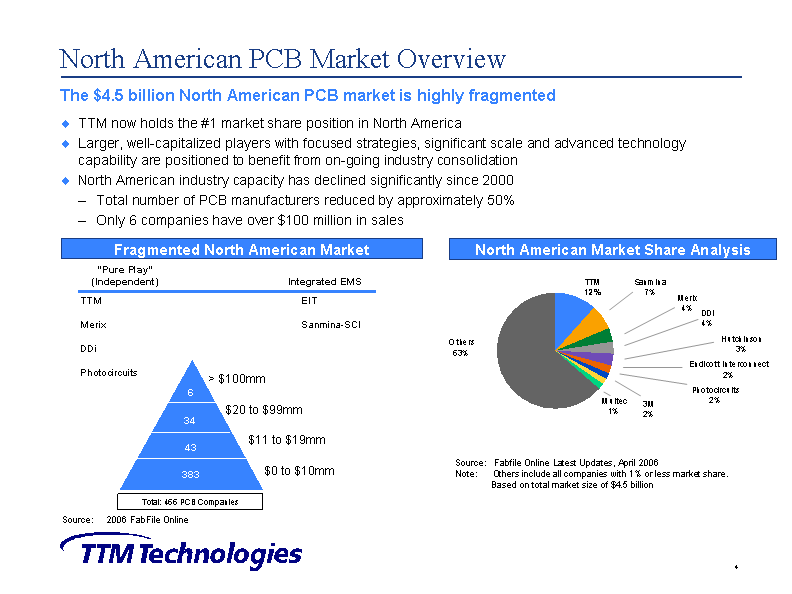
| North American PCB Market Overview TTM now holds the #1 market share position in North America Larger, well-capitalized players with focused strategies, significant scale and advanced technology capability are positioned to benefit from on-going industry consolidation North American industry capacity has declined significantly since 2000 Total number of PCB manufacturers reduced by approximately 50% Only 6 companies have over $100 million in sales The $4.5 billion North American PCB market is highly fragmented Fragmented North American Market North American Market Share Analysis Source: 2006 FabFile Online "Pure Play" (Independent) Integrated EMS TTM EIT Merix Sanmina-SCI DDi Photocircuits Total: 466 PCB Companies > $100mm $20 to $99mm $11 to $19mm $0 to $10mm Source: Fabfile Online Latest Updates, April 2006 Note: Others include all companies with 1% or less market share. Based on total market size of $4.5 billion |
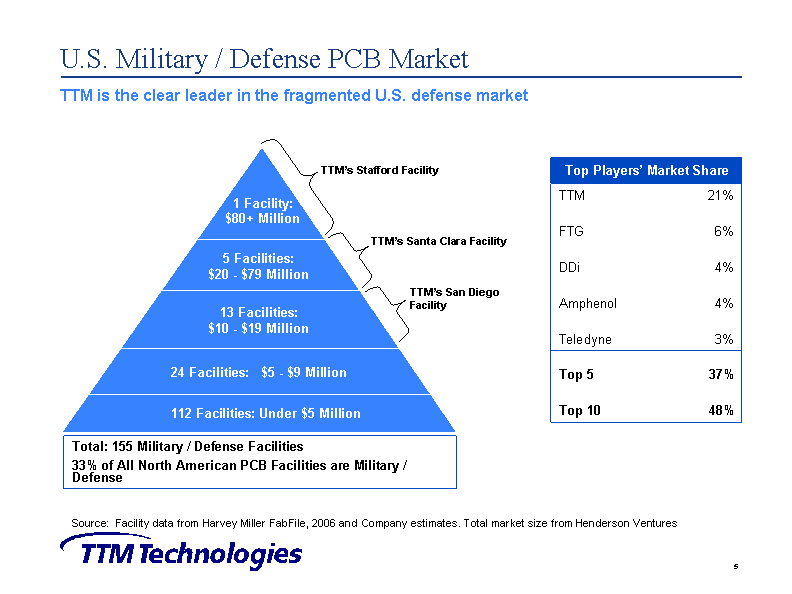
| U.S. Military / Defense PCB Market Source: Facility data from Harvey Miller FabFile, 2006 and Company estimates. Total market size from Henderson Ventures 24 Facilities: $5 - $9 Million 1 Facility: $80+ Million 13 Facilities: $10 - $19 Million Total: 155 Military / Defense Facilities 33% of All North American PCB Facilities are Military / Defense 112 Facilities: Under $5 Million TTM's Stafford Facility 5 Facilities: $20 - $79 Million TTM is the clear leader in the fragmented U.S. defense market TTM's Santa Clara Facility TTM's San Diego Facility Top Players' Market Share TTM 21% FTG 6% DDi 4% Amphenol 4% Teledyne 3% Top 5 37% Top 10 48% |
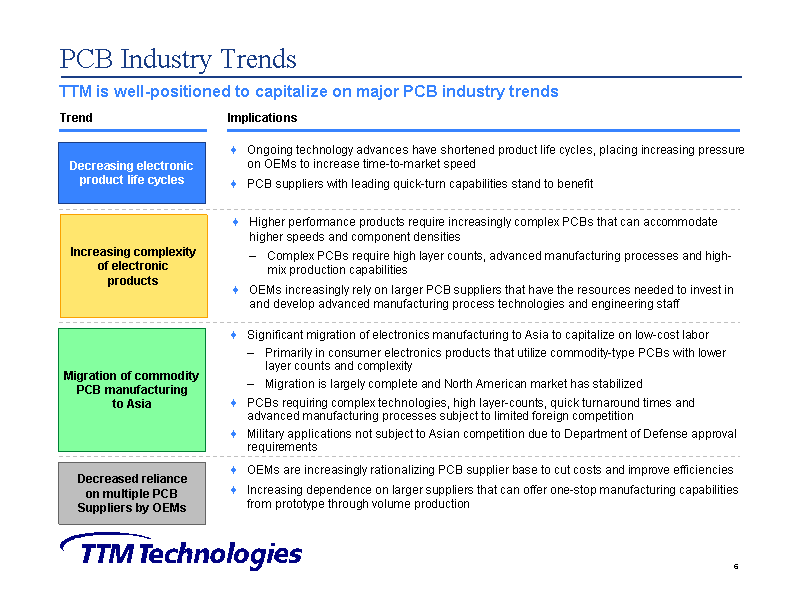
| PCB Industry Trends TTM is well-positioned to capitalize on major PCB industry trends Migration of commodity PCB manufacturing to Asia Decreasing electronic product life cycles Increasing complexity of electronic products Ongoing technology advances have shortened product life cycles, placing increasing pressure on OEMs to increase time-to-market speed PCB suppliers with leading quick-turn capabilities stand to benefit Higher performance products require increasingly complex PCBs that can accommodate higher speeds and component densities Complex PCBs require high layer counts, advanced manufacturing processes and high- mix production capabilities OEMs increasingly rely on larger PCB suppliers that have the resources needed to invest in and develop advanced manufacturing process technologies and engineering staff Significant migration of electronics manufacturing to Asia to capitalize on low-cost labor Primarily in consumer electronics products that utilize commodity-type PCBs with lower layer counts and complexity Migration is largely complete and North American market has stabilized PCBs requiring complex technologies, high layer-counts, quick turnaround times and advanced manufacturing processes subject to limited foreign competition Military applications not subject to Asian competition due to Department of Defense approval requirements Trend Implications Decreased reliance on multiple PCB Suppliers by OEMs OEMs are increasingly rationalizing PCB supplier base to cut costs and improve efficiencies Increasing dependence on larger suppliers that can offer one-stop manufacturing capabilities from prototype through volume production |
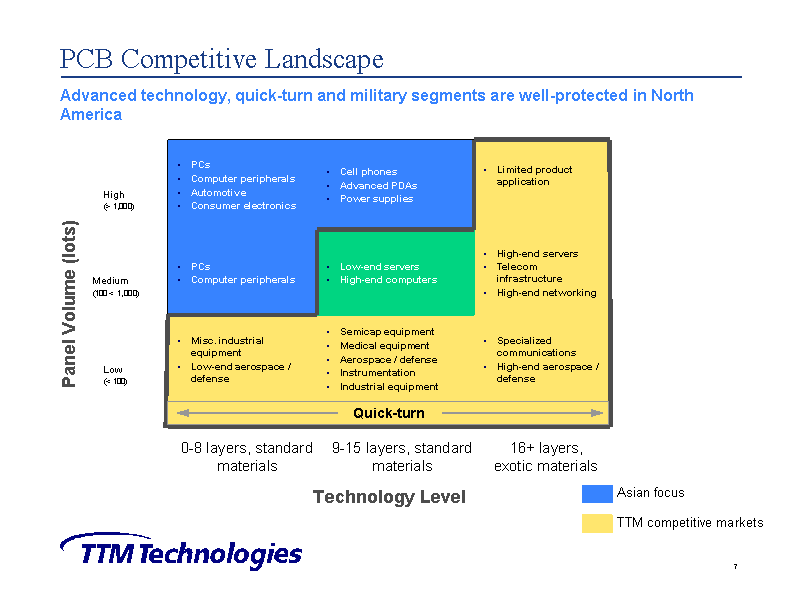
| Low (< 100) Medium (100 < 1,000) High (> 1,000) PCB Competitive Landscape Technology Level Panel Volume (lots) 9-15 layers, standard materials 16+ layers, exotic materials Asian focus 0-8 layers, standard materials TTM competitive markets Specialized communications High-end aerospace / defense Semicap equipment Medical equipment Aerospace / defense Instrumentation Industrial equipment Misc. industrial equipment Low-end aerospace / defense High-end servers Telecom infrastructure High-end networking Low-end servers High-end computers PCs Computer peripherals Limited product application Cell phones Advanced PDAs Power supplies PCs Computer peripherals Automotive Consumer electronics Advanced technology, quick-turn and military segments are well-protected in North America Quick-turn |
| Company Overview - TTM |
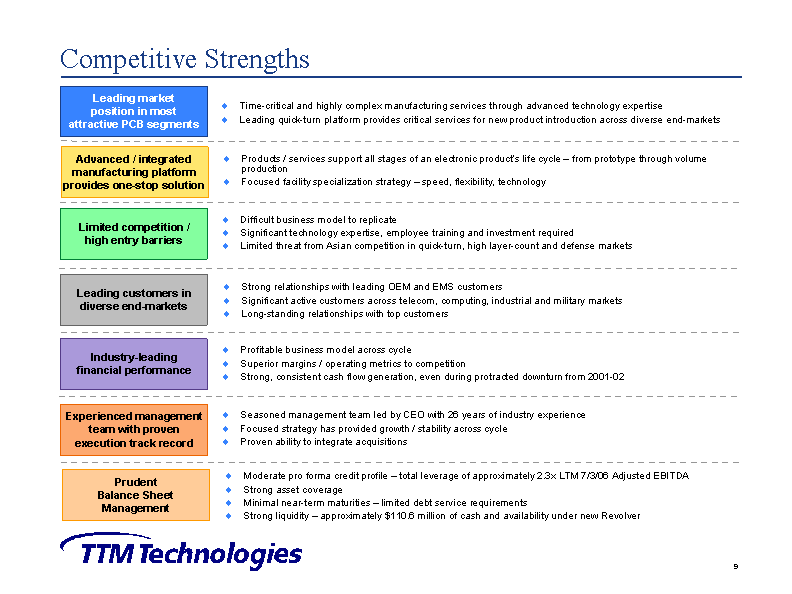
| Competitive Strengths Limited competition / high entry barriers Leading market position in most attractive PCB segments Advanced / integrated manufacturing platform provides one-stop solution Time-critical and highly complex manufacturing services through advanced technology expertise Leading quick-turn platform provides critical services for new product introduction across diverse end-markets Products / services support all stages of an electronic product's life cycle - from prototype through volume production Focused facility specialization strategy - speed, flexibility, technology Difficult business model to replicate Significant technology expertise, employee training and investment required Limited threat from Asian competition in quick-turn, high layer-count and defense markets Leading customers in diverse end-markets Strong relationships with leading OEM and EMS customers Significant active customers across telecom, computing, industrial and military markets Long-standing relationships with top customers Industry-leading financial performance Profitable business model across cycle Superior margins / operating metrics to competition Strong, consistent cash flow generation, even during protracted downturn from 2001-02 Experienced management team with proven execution track record Seasoned management team led by CEO with 26 years of industry experience Focused strategy has provided growth / stability across cycle Proven ability to integrate acquisitions Prudent Balance Sheet Management Moderate pro forma credit profile - total leverage of approximately 2.3x LTM 7/3/06 Adjusted EBITDA Strong asset coverage Minimal near-term maturities - limited debt service requirements Strong liquidity - approximately $110.6 million of cash and availability under new Revolver |
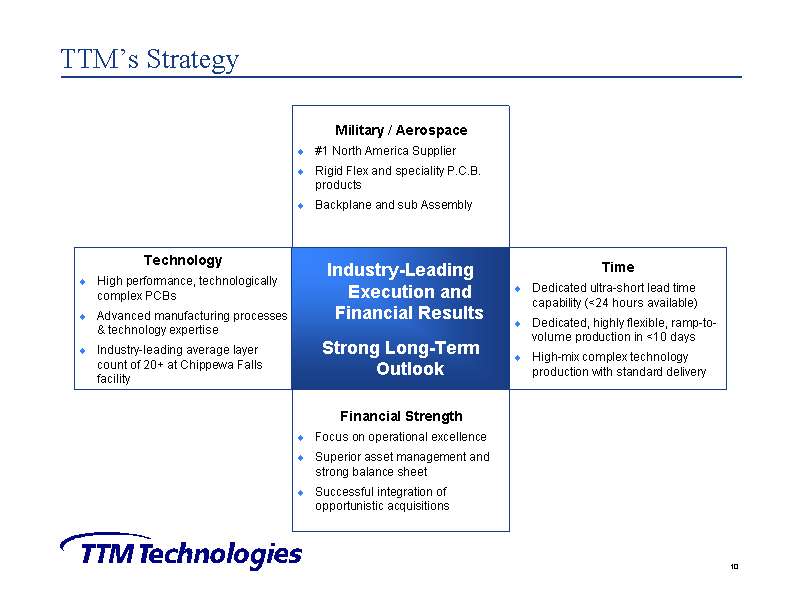
| TTM's Strategy Financial Strength Focus on operational excellence Superior asset management and strong balance sheet Successful integration of opportunistic acquisitions Military / Aerospace #1 North America Supplier Rigid Flex and speciality P.C.B. products Backplane and sub Assembly Time Dedicated ultra-short lead time capability (<24 hours available) Dedicated, highly flexible, ramp-to- volume production in <10 days High-mix complex technology production with standard delivery Industry-Leading Execution and Financial Results Strong Long-Term Outlook Technology High performance, technologically complex PCBs Advanced manufacturing processes & technology expertise Industry-leading average layer count of 20+ at Chippewa Falls facility |
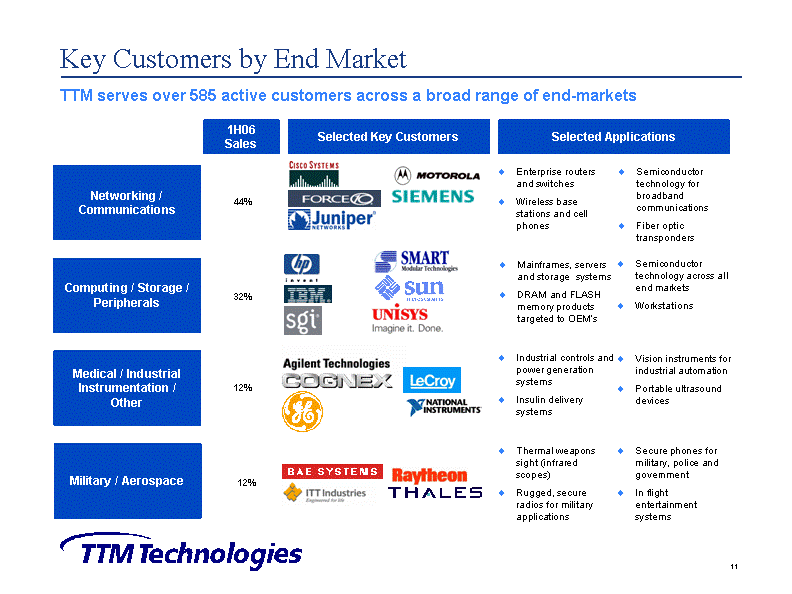
| Key Customers by End Market TTM serves over 585 active customers across a broad range of end-markets Networking / Communications Computing / Storage / Peripherals Medical / Industrial Instrumentation / Other Military / Aerospace Enterprise routers and switches Wireless base stations and cell phones Semiconductor technology for broadband communications Fiber optic transponders Mainframes, servers and storage systems DRAM and FLASH memory products targeted to OEM's Industrial controls and power generation systems Insulin delivery systems Thermal weapons sight (infrared scopes) Rugged, secure radios for military applications Semiconductor technology across all end markets Workstations 44% 32% 12% 12% Selected Key Customers Selected Applications 1H06 Sales Vision instruments for industrial automation Portable ultrasound devices Secure phones for military, police and government In flight entertainment systems |
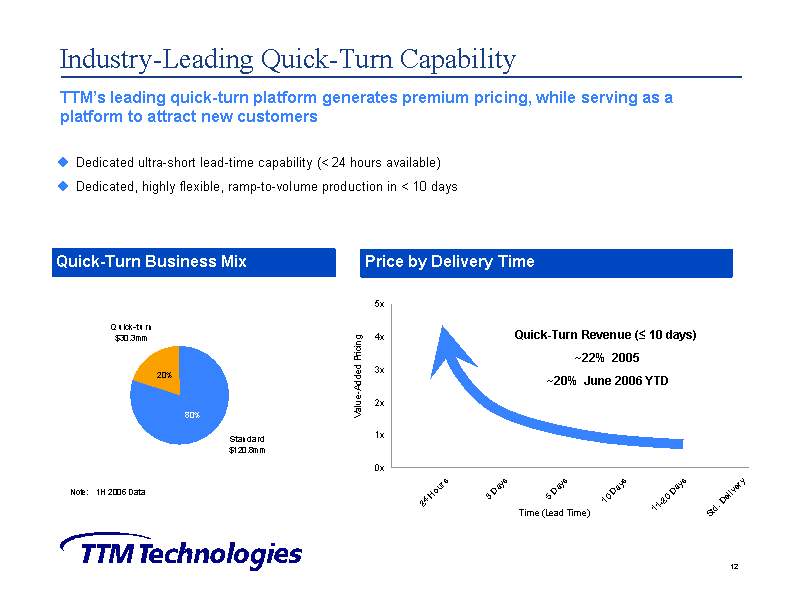
| Industry-Leading Quick-Turn Capability 24 Hours 3 Days 5 Days 10 Days 11-20 Days Std. Delivery Quick-Turn Revenue (^ 10 days) ~22% 2005 ~20% June 2006 YTD Dedicated ultra-short lead-time capability (< 24 hours available) Dedicated, highly flexible, ramp-to-volume production in < 10 days Quick-Turn Business Mix Price by Delivery Time Standard 120.82596 QTA 30.338763 TTM's leading quick-turn platform generates premium pricing, while serving as a platform to attract new customers Note: 1H 2006 Data |
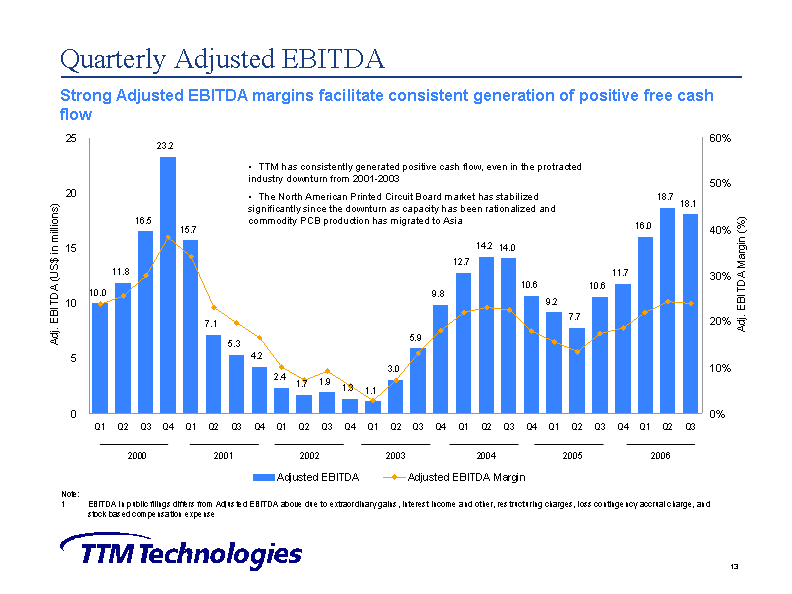
| Quarterly Adjusted EBITDA Strong Adjusted EBITDA margins facilitate consistent generation of positive free cash flow TTM has consistently generated positive cash flow, even in the protracted industry downturn from 2001-2003 The North American Printed Circuit Board market has stabilized significantly since the downturn as capacity has been rationalized and commodity PCB production has migrated to Asia Note: 1 EBITDA in public filings differs from Adjusted EBITDA above due to extraordinary gains, interest income and other, restructuring charges, loss contingency accrual charge, and stock based compensation expense |
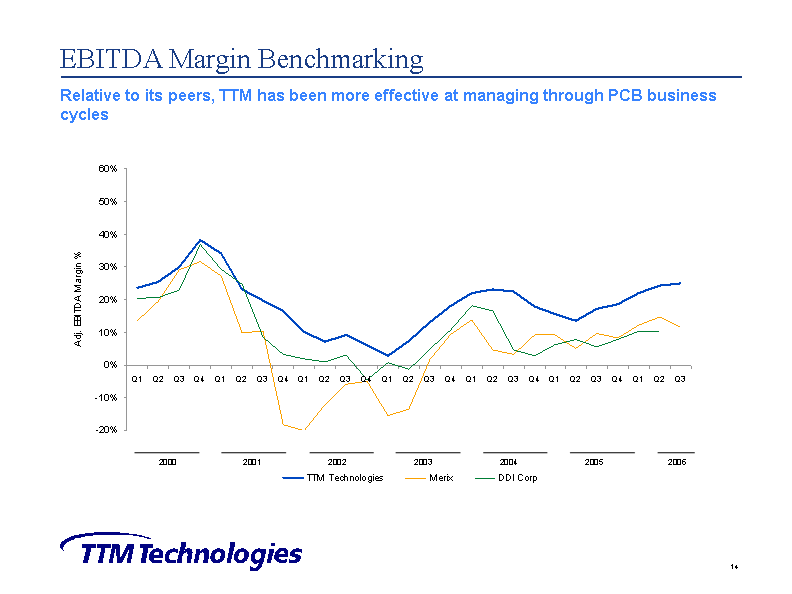
| EBITDA Margin Benchmarking Relative to its peers, TTM has been more effective at managing through PCB business cycles |

| Company Overviews - former Tyco PCG |
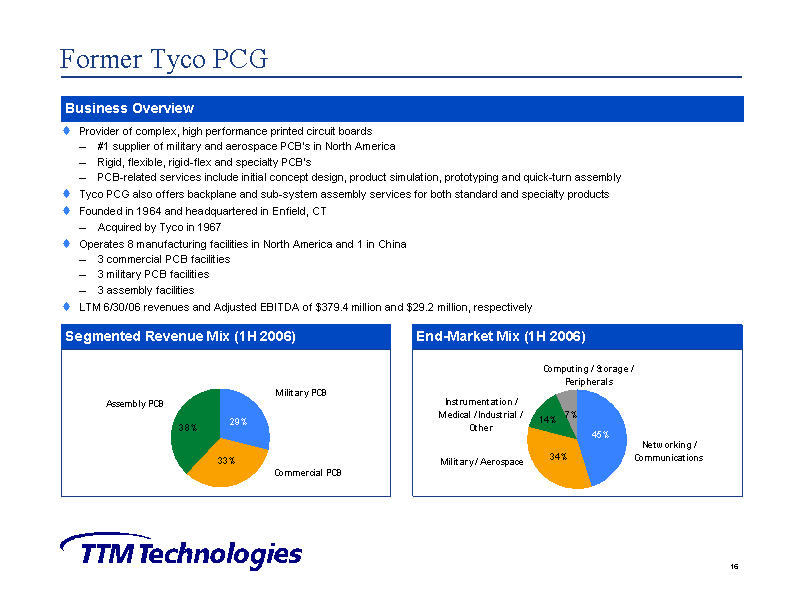
| Former Tyco PCG Provider of complex, high performance printed circuit boards #1 supplier of military and aerospace PCB's in North America Rigid, flexible, rigid-flex and specialty PCB's PCB-related services include initial concept design, product simulation, prototyping and quick-turn assembly Tyco PCG also offers backplane and sub-system assembly services for both standard and specialty products Founded in 1964 and headquartered in Enfield, CT Acquired by Tyco in 1967 Operates 8 manufacturing facilities in North America and 1 in China 3 commercial PCB facilities 3 military PCB facilities 3 assembly facilities LTM 6/30/06 revenues and Adjusted EBITDA of $379.4 million and $29.2 million, respectively Segmented Revenue Mix (1H 2006) End-Market Mix (1H 2006) Business Overview Networking/Communications 0.45 Military/Aerospace 0.34 Instrumentation/Medical/Industrial/Other 0.14 Computing/Storage/Peripherals 0.07 Military PCB 0.29 Commercial PCB 0.33 Assembly PCB 0.38 Computing/Storage/Peripherals 0.07 |
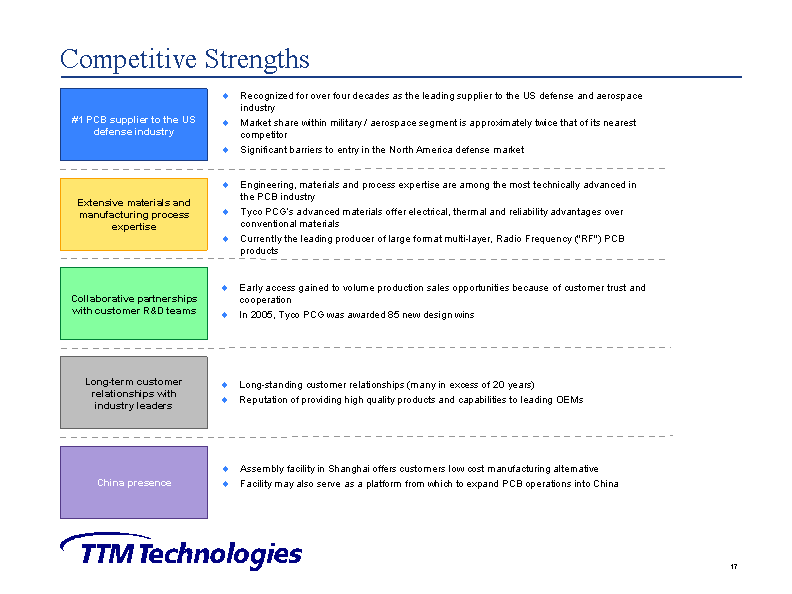
| Collaborative partnerships with customer R&D teams #1 PCB supplier to the US defense industry Competitive Strengths Extensive materials and manufacturing process expertise Recognized for over four decades as the leading supplier to the US defense and aerospace industry Market share within military / aerospace segment is approximately twice that of its nearest competitor Significant barriers to entry in the North America defense market Engineering, materials and process expertise are among the most technically advanced in the PCB industry Tyco PCG's advanced materials offer electrical, thermal and reliability advantages over conventional materials Currently the leading producer of large format multi-layer, Radio Frequency ("RF") PCB products Early access gained to volume production sales opportunities because of customer trust and cooperation In 2005, Tyco PCG was awarded 85 new design wins Long-term customer relationships with industry leaders Long-standing customer relationships (many in excess of 20 years) Reputation of providing high quality products and capabilities to leading OEMs China presence Assembly facility in Shanghai offers customers low cost manufacturing alternative Facility may also serve as a platform from which to expand PCB operations into China |
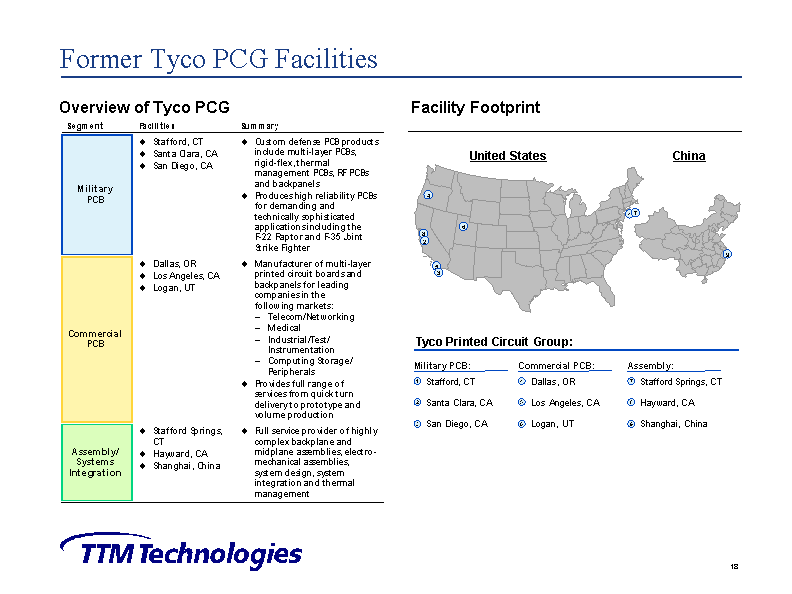
| Former Tyco PCG Facilities Overview of Tyco PCG Facility Footprint 9 1 6 8 2 4 5 7 1 Stafford, CT 4 Dallas, OR Military PCB: Commercial PCB: 5 Los Angeles, CA Assembly: 7 Stafford Springs, CT 9 Shanghai, China 2 Santa Clara, CA 6 Logan, UT 8 Hayward, CA Tyco Printed Circuit Group: 3 San Diego, CA 3 United States China |
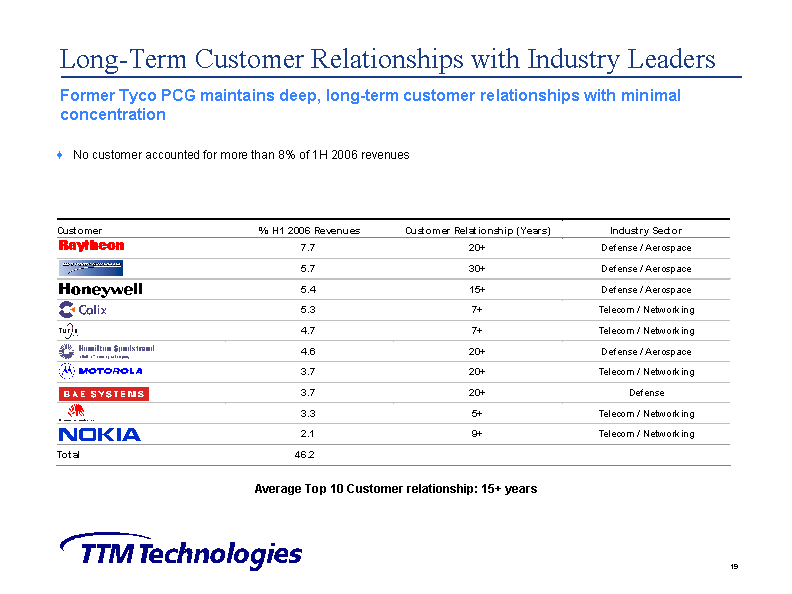
| Long-Term Customer Relationships with Industry Leaders Former Tyco PCG maintains deep, long-term customer relationships with minimal concentration No customer accounted for more than 8% of 1H 2006 revenues Average Top 10 Customer relationship: 15+ years |
| Combined Company Overview |
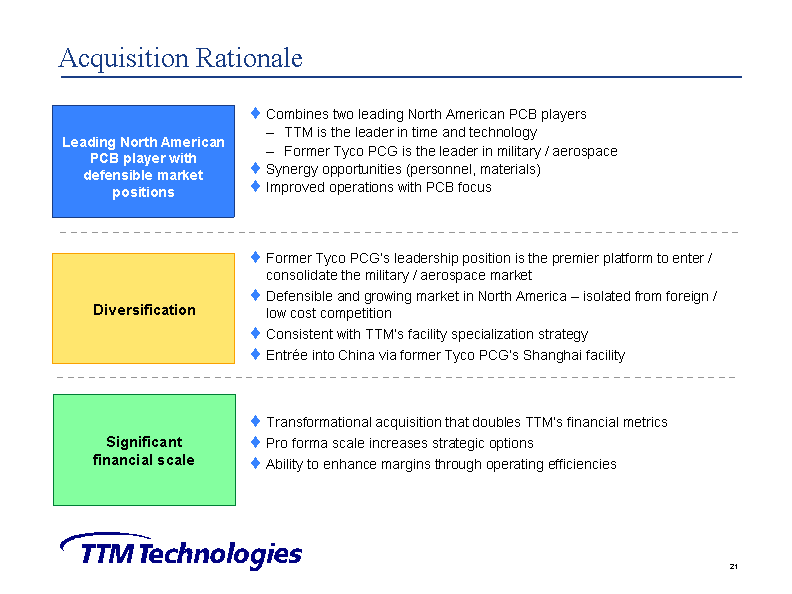
| Acquisition Rationale Combines two leading North American PCB players TTM is the leader in time and technology Former Tyco PCG is the leader in military / aerospace Synergy opportunities (personnel, materials) Improved operations with PCB focus Leading North American PCB player with defensible market positions Former Tyco PCG's leadership position is the premier platform to enter / consolidate the military / aerospace market Defensible and growing market in North America - isolated from foreign / low cost competition Consistent with TTM's facility specialization strategy Entree into China via former Tyco PCG's Shanghai facility Diversification Transformational acquisition that doubles TTM's financial metrics Pro forma scale increases strategic options Ability to enhance margins through operating efficiencies Significant financial scale |
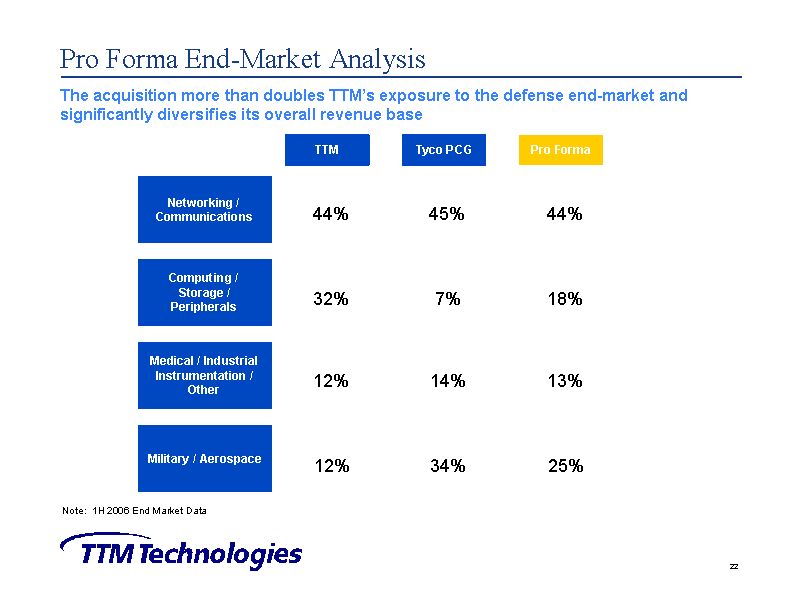
| Pro Forma End-Market Analysis Note: 1H 2006 End Market Data The acquisition more than doubles TTM's exposure to the defense end-market and significantly diversifies its overall revenue base Networking / Communications Computing / Storage / Peripherals Medical / Industrial Instrumentation / Other Military / Aerospace 44% 32% 12% 12% TTM 45% 7% 14% 34% Tyco PCG 44% 18% 13% 25% Pro Forma |
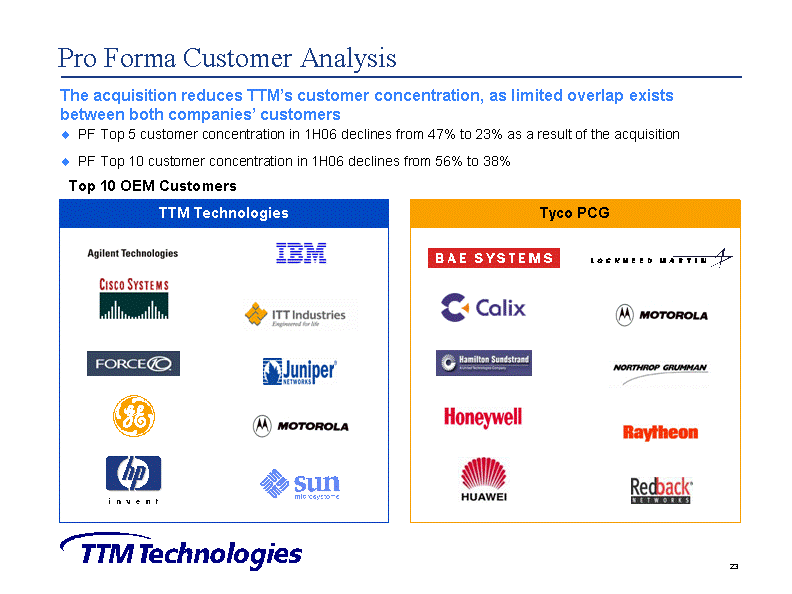
| Pro Forma Customer Analysis The acquisition reduces TTM's customer concentration, as limited overlap exists between both companies' customers Top 10 OEM Customers PF Top 5 customer concentration in 1H06 declines from 47% to 23% as a result of the acquisition PF Top 10 customer concentration in 1H06 declines from 56% to 38% TTM Technologies Tyco PCG |
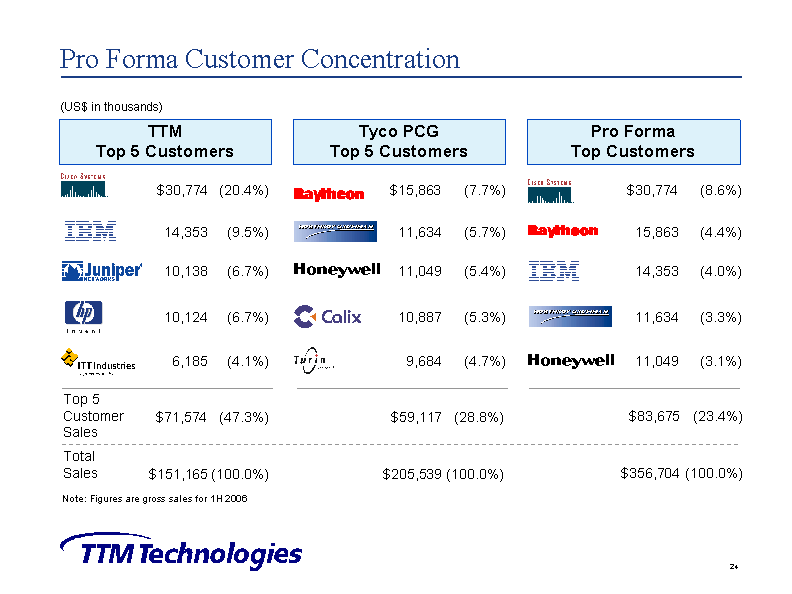
| Pro Forma Customer Concentration (US$ in thousands) TTM Top 5 Customers Tyco PCG Top 5 Customers Pro Forma Top Customers (20.4%) (9.5%) (6.7%) (6.7%) (4.1%) (7.7%) (5.7%) (5.4%) (5.3%) (4.7%) (8.6%) (4.4%) (4.0%) (3.3%) (3.1%) $71,574 (28.8%) (23.4%) Top 5 Customer Sales $151,165 (100.0%) (100.0%) Total Sales $30,774 14,353 10,138 10,124 6,185 (47.3%) (100.0%) $15,863 11,634 11,049 10,887 9,684 $59,117 $205,539 $30,774 15,863 14,353 11,634 11,049 $83,675 $356,704 Note: Figures are gross sales for 1H 2006 |
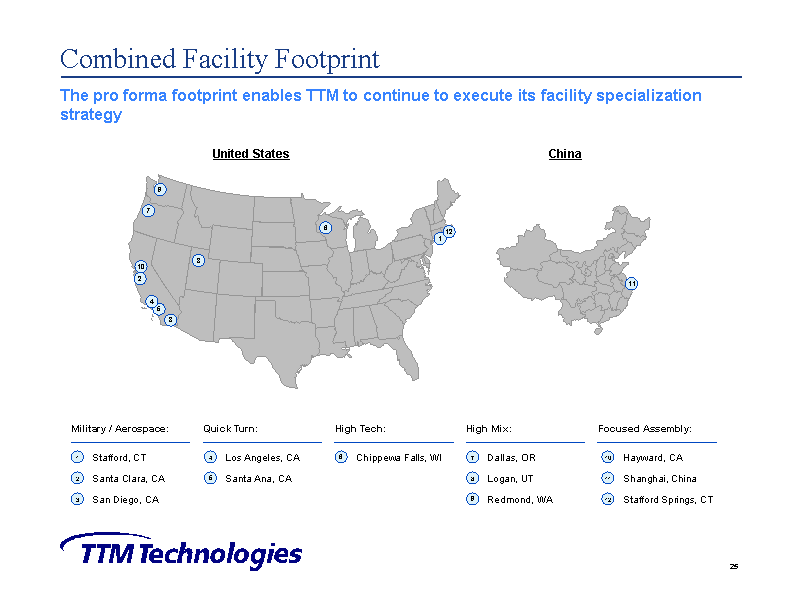
| The pro forma footprint enables TTM to continue to execute its facility specialization strategy Combined Facility Footprint 1 5 8 2 7 9 4 6 10 3 12 United States 11 China |
| Recent Developments - Dallas Plant Closure Other TTM plants can serve this segment and have sufficient capacity 20% - 50% of the Dallas revenue likely to transfer to other plants Production should be completed by end of Q1 2007 We will assist Dallas employees in every way possible Severance costs total $2.6 million $3.8 million worth of equipment to be redeployed |
| Largest player in North America with significant size and scale Leading market position in most attractive PCB segments Summary Diversified revenue base Leading market positions in advanced technology / high layer-count, quick-turn, and military segments Limited competition with high barriers to entry Focused strategy has provided growth and stability across cycle Acquisition results in significantly more diversified pro forma company Balanced end-market exposure Leading OEM customers with minimal revenue concentration #1 market share position in highly fragmented North American market Competitive advantage given improved purchasing leverage, customer credentials, and internal growth potential from resource sharing Industry-leading financial performance Superior margins/operating metrics to competition Strong, consistent cash flow generation Strong balance sheet Experienced management team with proven execution track record Seasoned management team lead by CEO with 26 years of industry experience Strong, long-term customer and supplier relationships Proven ability to integrate acquisitions |
| Steve Richards - Chief Financial Officer, TTM Historical Financials - TTM Technologies |
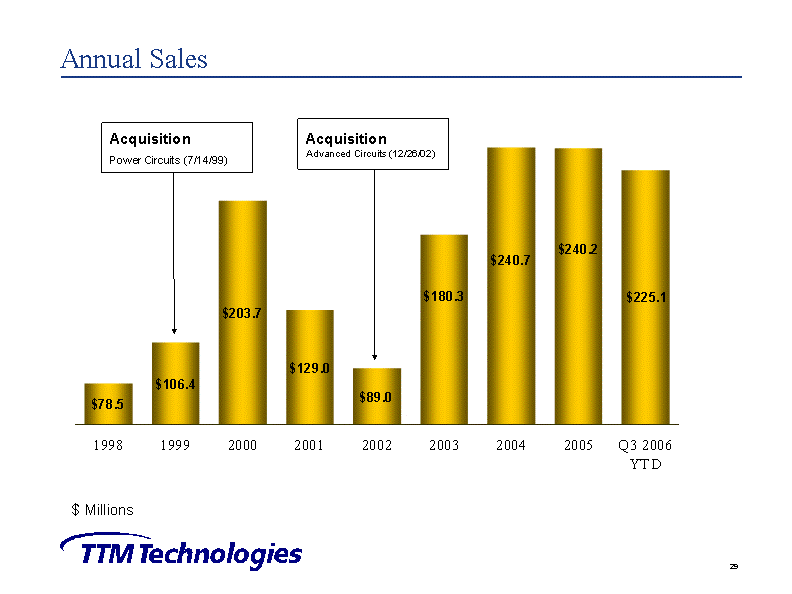
| Annual Sales 1998 1999 2000 2001 2002 2003 2004 2005 Q3 2006 YTD 78.5 106.4 203.7 129 89 180.3 240.7 240.2 225.1 $ Millions Acquisition Advanced Circuits (12/26/02) Acquisition Power Circuits (7/14/99) |
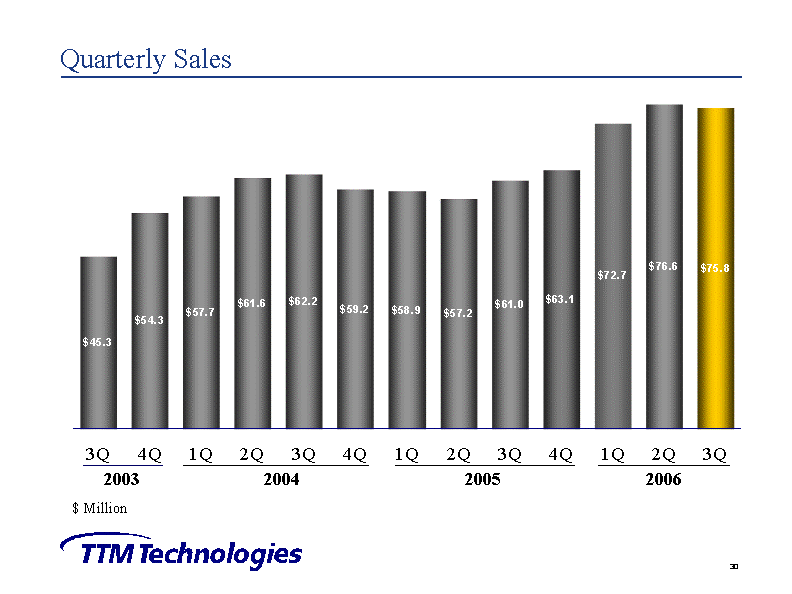
| 2004 3Q 4Q 1Q 2Q 3Q 4Q 1Q 2Q 3Q 4Q 1Q 2Q 3Q 45.3 54.3 57.7 61.6 62.2 59.2 58.9 57.2 61 63.1 72.7 76.6 75.8 2003 $ Million 2005 Quarterly Sales 2006 |
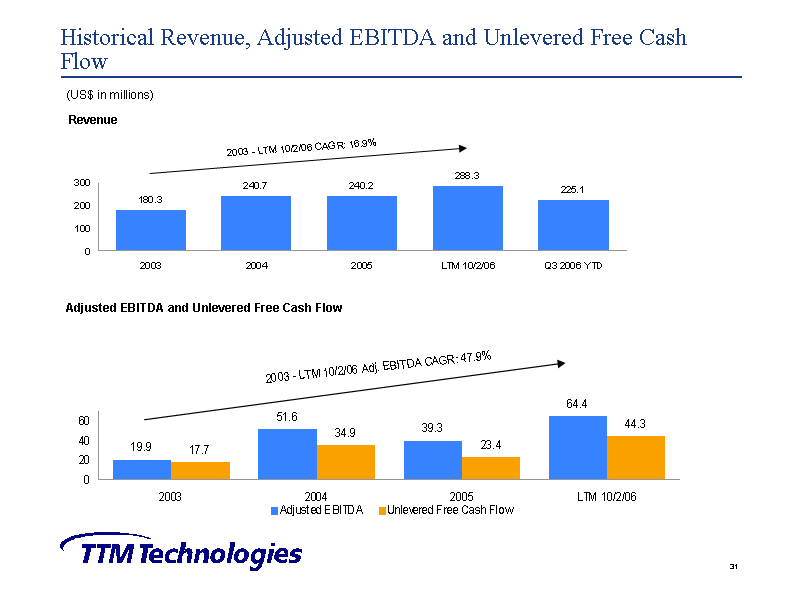
| Historical Revenue, Adjusted EBITDA and Unlevered Free Cash Flow (US$ in millions) Revenue Adjusted EBITDA and Unlevered Free Cash Flow |
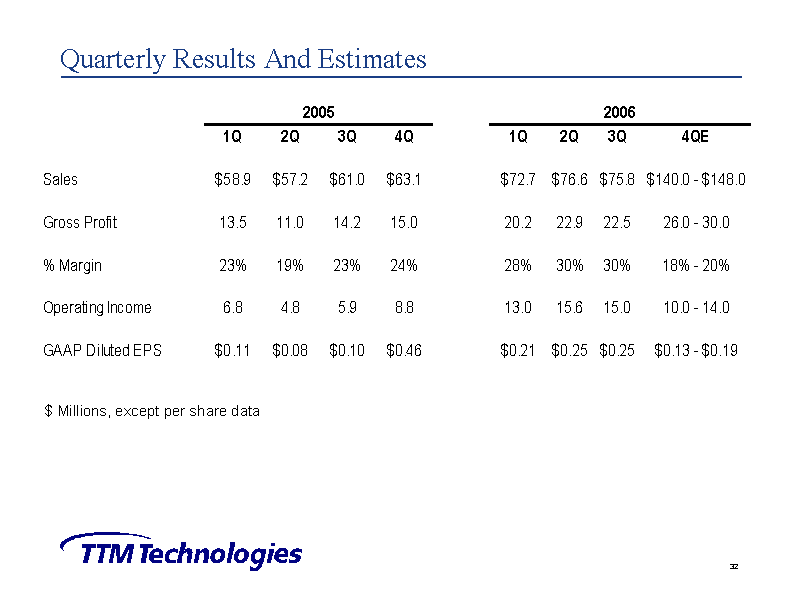
| Quarterly Results And Estimates $ Millions, except per share data |
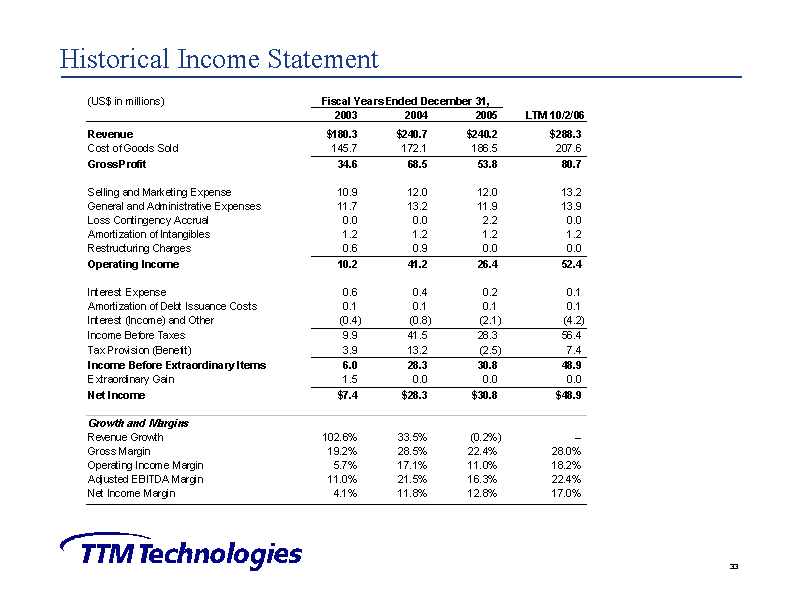
| Historical Income Statement |
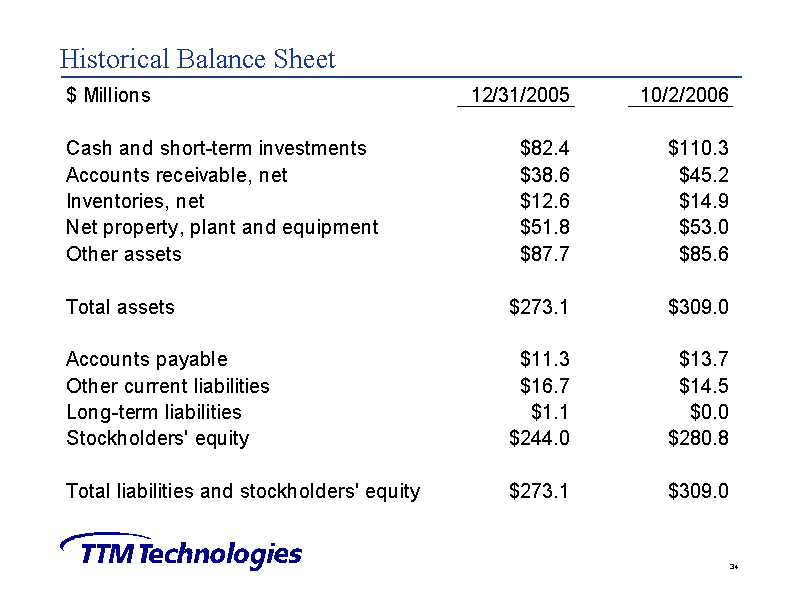
| Historical Balance Sheet |
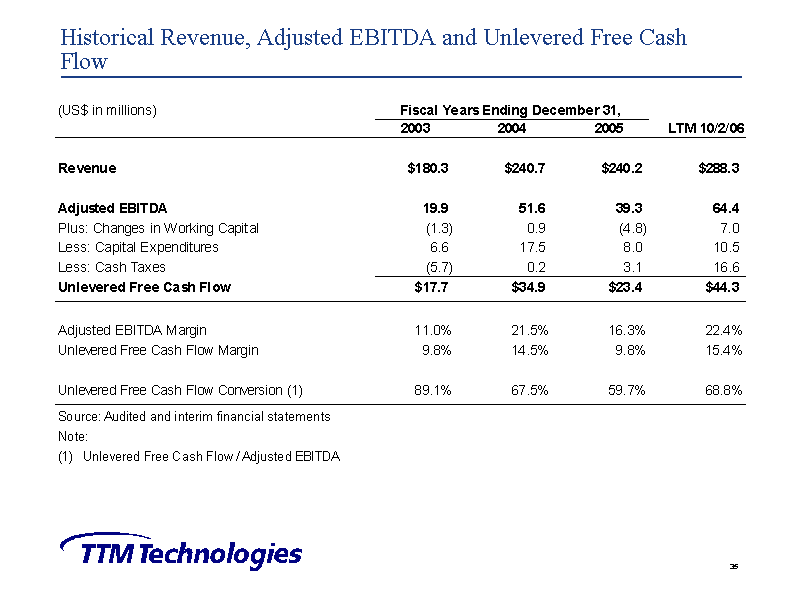
| Historical Revenue, Adjusted EBITDA and Unlevered Free Cash Flow |

| Historical Financials - Tyco PCG |
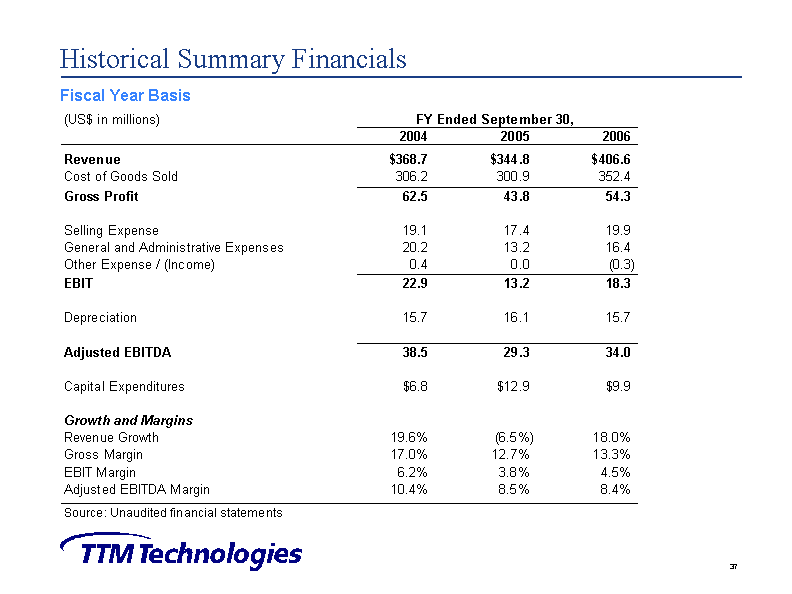
| Historical Summary Financials Fiscal Year Basis |
| Historical Financials - Combined |

| Historical Financials |